The COVID-19 Recession (Real GDP)

Which had a greater impact on U.S. real GDP?  Was it the COVID-19 Recession or the Great Recession?

In Q4 2019, the U.S. real GDP peaked. The new year (2020) started on a positive note with solid job growth in January and February. In March COVID-19 was declared a pandemic. Government leaders put lockdowns and restrictions in place that caused employment and real GDP to plummet.

The rate of change in real GDP for Q1 was -5.0%. The Q1 value was 98.7% of the Q4 2019 value.
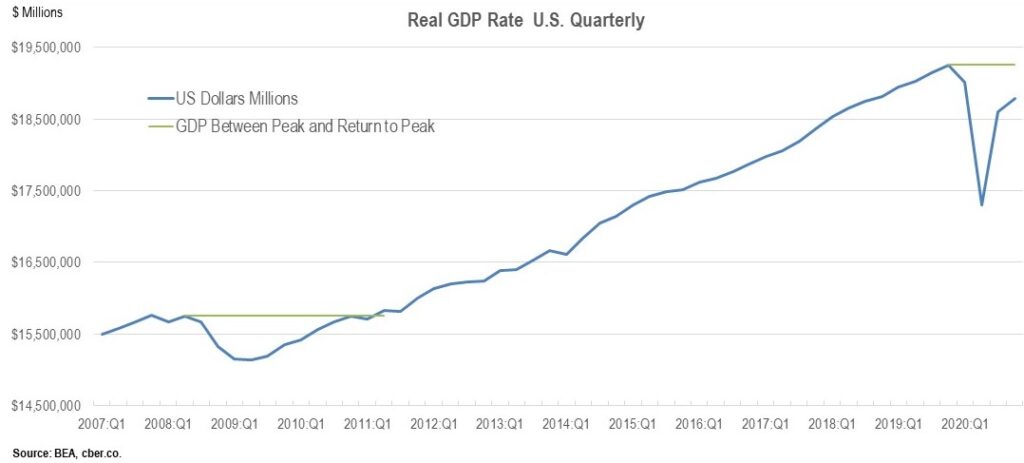
The trough of the downturn occurred in Q2. The rate of change was -31.4%. The Q2 value was 89.9% of the Q4 2019 value.

In Q3, the number of lockdowns and restrictions was reduced and the recovery began. The change in the real GDP growth rate for Q3 was +33.4%. The Q3 value was 96.6% of the Q4 2019 value.

The rate of growth tapered off in Q4 because there was a resurgence in the virus and some government leaders restored lockdowns and other restrictions. The change in the real GDP growth rate for Q4 was 4.0%. The Q4 value was 97.5% of the Q4 2019 value.

The path of the real GDP value was V-shaped during 2020. It will more closely resemble a checkmark when 2020 and 2021 are combined. The value of real GDP will return to the Q4 2019 level in Q4 2021.

In 2021 real GDP growth will be driven by stimulus funding, which will increase employment and spending. There will be stronger growth in the second half of the year.

Overall, there were be two quarters when the value of real GDP declined and six quarters where it recovered to reach the Q4 2019 value. The total time of the decline and recovery is eight quarters or two-years.

A look at the Great Recession shows real GDP peaked in Q2 2008 and it declined for four quarters. Real GDP increased from Q2 2009 to Q2 2011 (eight quarters), until it returned to the Q2 2008 peak. The overall time of the decline and recovery was 12 quarters or 36 months.

The Great Recession was more shallow; however, the COVID-19 Recession recovered more quickly.
The COVID-19 Recession (Employment)

It has been almost a year since the COVID-19 recession hit the U.S.

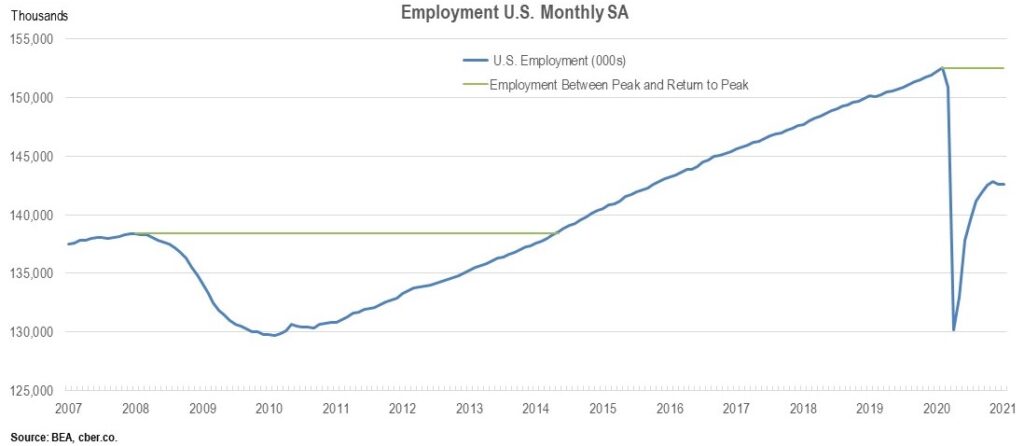
In February 2020, U.S. employment peaked.  In March, WHO declared the COVID-19 virus a pandemic. Government leaders put lockdowns in place that caused employment to decline in March and April. At the trough of the decline, in April, U.S. employment was 85.3% of the February 2020 total. Said differently, in March and April, the U.S. economy lost 22.3 million employees.

By the end of 2020, U.S. employment was 93.48% of the February 2020 total. Only 49,000 jobs were added in January 2021. Employment edged up a notch and was 93.51% of the February 2020 total. On a positive note, January employment had increased by 12.4 million jobs.

Through the first part of the summer, the employment recovery was V-shaped. As net job creation tapered off, it has turned into a checkmark shaped recovery.

U.S. Employment

The Great Recession was much different than the COVID-19 Recession. A shock to the financial system caused the Great Recession. On the other hand, the U.S. financial system was in good shape when policies related to the COVID-19 medical crisis triggered the current recession.

U.S. employment peaked in January 2008. As the financial crisis snowballed, U.S. employment declined for 25 months. This declined was longer than the COVID-19 recession, but not as deep.

At the trough in 2010, U.S. employment was 93.7% of the January 2008 total. It took 51 months of job recovery to return to the January 2008 level. The combined length of the employment decline and recovery was 76 months.

The recovery from the COVID-19 recession will be in Q4 of 2022 or Q1 of 2023. The estimated time of recovery from the trough will be 2.5 to 3.0 years. The total estimated time of recovery from the previous peak is approximately 31 to 37 months.

There are many potential headwinds. Keep your fingers crossed.

U.S. Economic Forecast 2021

The U.S. economic forecast points to improvement in Q3 and Q4. The value of real GDP slowed in Q4 2020. A slower rate of growth will continue in Q1 2021. Economic growth will resume in Q2. The value of real GDP will return to its pre-pandemic level in the second half of 2021.

A similar pattern will occur in the labor market. Job losses are likely to occur in Q1. By mid-year, job growth will return. Total employment will return to its 2019 level in 2022 or 2023. The uptick in unemployment claims will cause the unemployment rate to remain higher than usual. As more people are vaccinated, the economy will open further, and more people will return to work.

The hospitality industry has been hit hard by the lockdowns and restrictions. Employment in those areas is not expected to return until 2023. On a similar note, the airline industry was off by as much as 95%, compared to the prior year. Domestic air travel is not expected to return to pre-pandemic levels until 2023. International air travel will return in 2024.

U.S. Economic Forecast

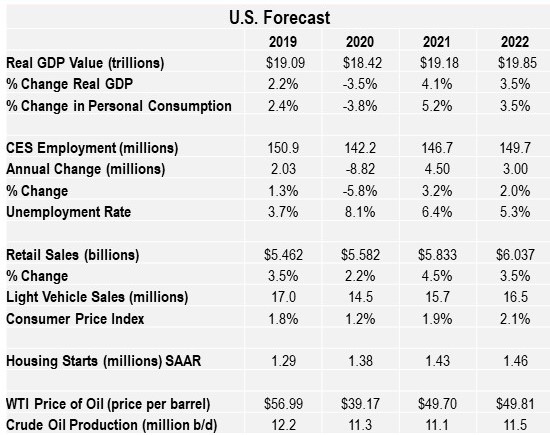
Personal consumption will become positive in 2021. Pent-up demand and stimulus support will drive retail sales higher in 2021. Both will return to pre-pandemic levels in 2022.

Light vehicle sales will gradually improve and return to 17 million units in 2023. At the moment, the automobile industry is plagued with a shortage of semiconductors. This will negatively impact sales.

Inflation will remain near the Federal Reserve’s target of 2.0%. Having said that, some economists fear the stimulus package will cause inflation problems in 2021.

The number of housing starts will increase in 2021 as interest rates remain low.

Crude oil production and prices will remain flat in 2021.They will post slight increases in 2022.

While the overall U.S. economic forecast is positive, there is still significant headwinds.

U.S. Job Market Remains on Solid Ground

Despite the gloom and doom of the new year, there is reason to feel good about the U.S. job market.

The news from the dark side is that oil prices are down, the equity markets are volatile, it is an election year, and there is uncertainty about the global economy….There are always headwinds.

On the sunny side of the street, there is plenty of upside:
• Unemployment is 4.9%.
• About 10 million jobs were added in the last four years (2012 to 2015).
• Weekly initial jobless claims have been below 300,000 for about a year.
• The recent growth in wages exceeds the rate of inflation.
• Low gasoline prices have fueled greater saving and consumption.

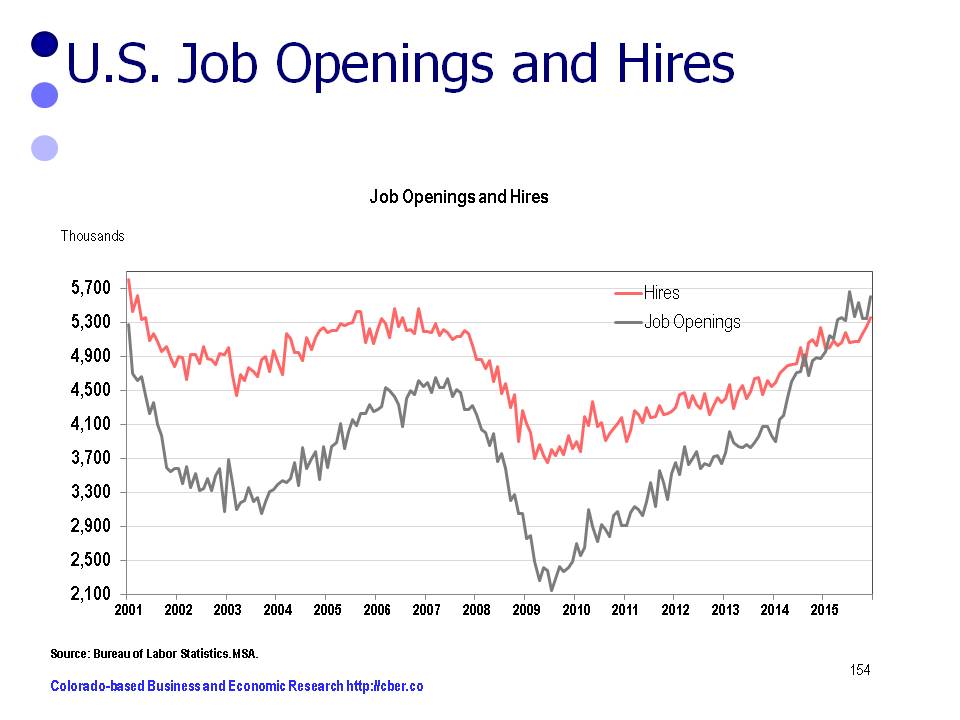
Another data series that points to a solid U.S. job market is the Job Openings and Labor Turnover Survey (JOLTS). This infrequency cited database tracks job openings, hires, and separations. They are defined by the BLS as follows:
• Job Openings – All positions that are not filled on the last business day of the month.
• Hires – All additions to the payroll during the month.
• Separations – all employees separated from the payroll during the months.

During periods of economic growth, the number of openings (grey) and hires (red) increases. When the growth of the economy slows as it did in 2001 and 2008 there is a decline in the number of openings and hires. At present both openings and hires are trending upwards.

U.S. Job Market

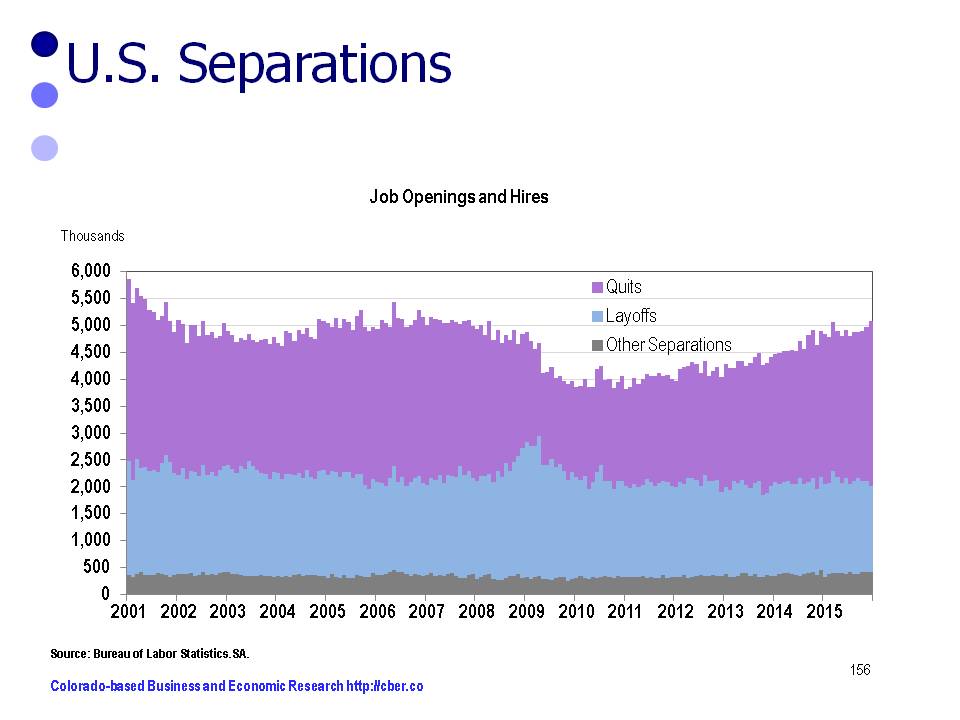
A closer look at separations shows there are positive trends in its three series (other, quits, layoffs). These series are defined as follows:

• Other Separations – retirements; transfers to other locations; deaths; or separations due to employee disability.
• Quits – Employees who leave a company voluntarily.
• Layoffs and Discharges – Involuntary separations initiated by the employer.

Currently, other separations (grey) are flat, layoffs (blue) and discharges are flat or trending downward, and quits (purple) are increasing. These are indicators of a healthy economy.

separations

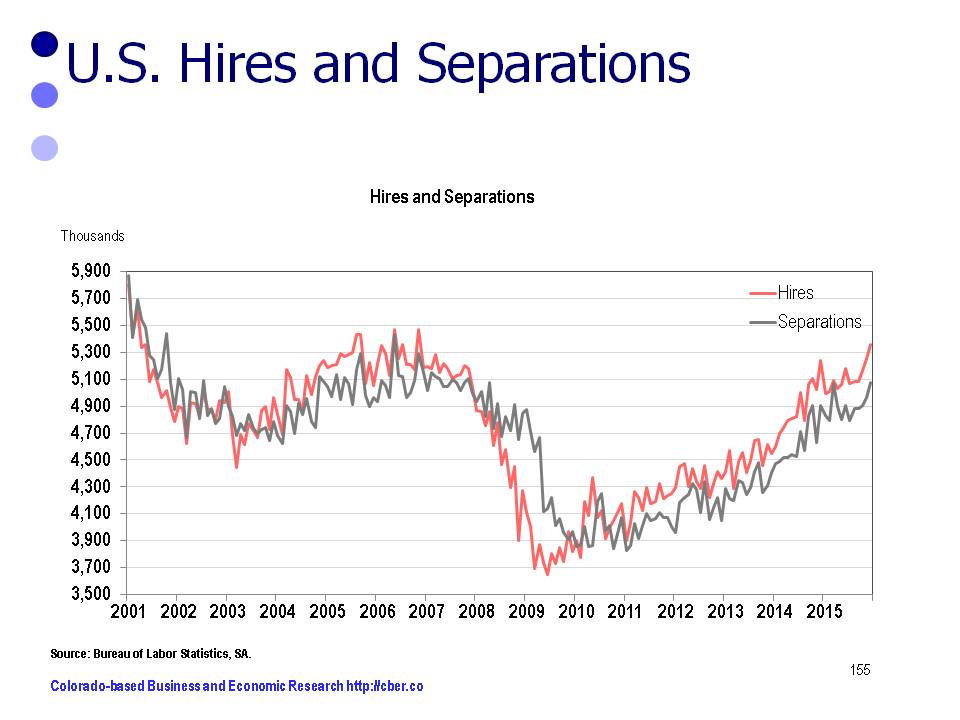
As mentioned earlier, the number of hires moves in conjunction with the performance of the economy. During 2008 and 2009 the number of hires declined sharply. At the same time, the number of separations (grey) declined at a much slower rate, i.e. the number of layoffs increased significantly. The result is the massive job losses associated with the Great Recession.

U.S. Job Market

Since 2010, both hires and separations have trended upwards. As there are more job hires, more people quit their jobs to take positions with other companies.

The bottom line – the U.S. job market appears to be on solid footing for the moment.

Q3 2015 Real GDP Records 2.0% Gain

On December 22nd, the Bureau of Economic Analysis released the “third estimate” of the Q3 2015 Real GDP for the United States. It increased at an annualized rate of 2.0% compared to 3.9% for Q2.

The nominal or current-dollar GDP (chained on 2009) for Q3 increased by $146.5 billion to $18,060.2 billion, a gain of 3.3%. The Q2 current-dollar GDP rose by 6.1% or $264.4 billion.

2015 Real GDP, Chained Dollars (2009 Billions)


Q1

Q2

Q3

        Gross domestic product

$16,177

$16,334

$16,414

Personal consumption expenditures

$11,081

$11,179

$11,262

    Goods

$3,804

$3,855

$3,902

    Services

$7,277

$7,325

$7,363

Gross private domestic investment

$2,830

$2,865

$2,860

    Fixed investment

$2,701

$2,736

$2,761

        Nonresidential

$2,189

$2,211

$2,225

        Residential

$512

$524

$534

    Change in private inventories

$113

$114

$86

Net exports of goods and services

$(541)

$(535)

$(546)

    Exports

$2,091

$2,118

$2,121

        Goods

$1,429

$1,452

$1,449

        Services

$661

$664

$671

    Imports

$2,633

$2,652

$2,667

        Goods

$2,161

$2,178

$2,186

        Services

$470

$472

$480

Government consumption expenditures

$2,839

$2,857

$2,870

    Federal

$1,111

$1,111

$1,112

        National defense

$680

$681

$678

        Nondefense

$431

$430

$433

    State and local

$1,726

$1,744

$1,756

Residual

$(41)

$(45)

$(49)

The 2015 Q3 Real GDP posted gains in the following areas:
• Personal consumption expenditures, the largest category, were up by 3.0% compared to 3.6% in the previous quarter. Goods were up 5.0% and Services were up 2.1%.
• Fixed investments posted a gain of 3.7% in Q3, down from 5.2% in Q2. Nonresidential investments for Q3 were up 2.6% and residential investments rose 8.2%. Both had lower levels of growth than Q2.
• Exports posted a gain of 0.7% for Q3 compared to 5.1% in Q2. Goods actually declined by -0.9% while services increased by 3.9%.
• Imports recorded an increase of 2.3% in Q3 compared to 3.0% in Q2. Goods increased by 2.3% while services posted a 6.4% increase. (Note: Imports are subtracted from the value of the GDP).
• Government consumption increased by 1.8% in Q3 compared to 2.6% in Q2. Federal spending was flat with a decrease in national defense spending and an increase in Nondefense spending. State and local government spending posted a 2.8% gain, down from 4.3% in the prior quarter.

Percent Change From Preceding Period in Real GDP – Seasonally Adjusted at Annualized Rates

Q1 Q2 Q3
        Gross domestic product 0.6 3.9 2.0
Personal consumption expenditures 1.8 3.6 3.0
    Goods 1.1 5.5 5.0
    Services 2.1 2.7 2.1
Gross private domestic investment 8.6 5.0 -0.7
    Fixed investment 3.3 5.2 3.7
        Nonresidential 1.6 4.1 2.6
            Structures -7.4 6.2 -7.2
            Equipment 2.3 0.3 9.9
            Intellectual property products 7.4 8.3 -0.8
        Residential 10.1 9.3 8.2
    Change in private inventories
Net exports of goods and services
    Exports -6.0 5.1 0.7
        Goods -11.7 6.5 -0.9
        Services 7.3 2.3 3.9
    Imports 7.1 3.0 2.3
        Goods 7.2 3.2 1.4
        Services 6.7 2.0 6.4
Government consumption expenditures -0.1 2.6 1.8
    Federal 1.1 0.0 0.2
        National defense 1.0 0.3 -1.4
        Nondefense 1.2 -0.5 2.8
    State and local -0.8 4.3 2.8
Addendum:
    Gross domestic product, current dollars 0.8 6.1 3.3

Q4 2015 Real GDP is expected to be stronger than Q3 and the rate of growth for 2015 will be in the range of 2.3% to 2.5%.

U.S. Employment Continues Growth at a Slower Rate

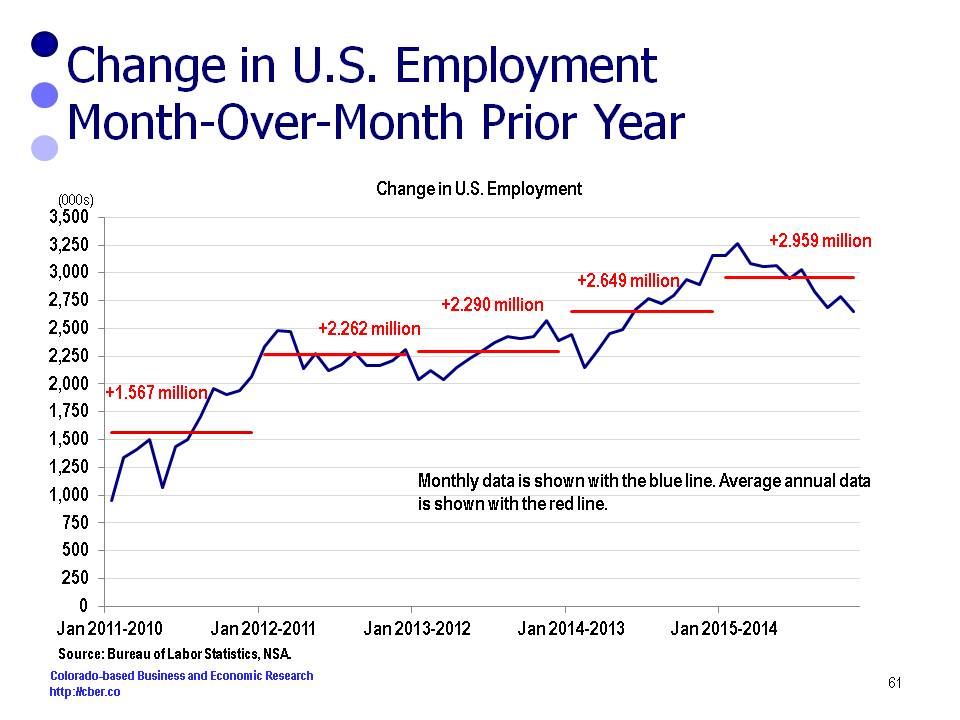
On December 4th, the Bureau of Labor Statistics released its monthly update for U.S. nonfarm payroll employment for November. The number of non-seasonally adjusted jobs increased by 2,650,000 in November compared to a year ago.

Based on current trends, the U.S. is on track to add 2,959,455 jobs in 2015.That equates to about 269,000 workers per month.

The November unemployment rate remained at 5.0% down from 5.8% a year ago. There were 7.9 million unemployed compared to 9.0 million last November.

A look at the seasonally adjusted data shows that job growth occurred in construction, professional and technical services, and health care. Losses occurred only in the mining and information sectors.

• Construction employment posted a gain of 46,000 in November. About 26,000 of those jobs were in the residential specialty trade contracting subsector. Year-over year construction employment is about 259,000 workers greater than last November.

• Professional and technical services added 28,000 jobs in November. About 11,000 jobs were in accounting and bookkeeping services and 5,000 were in computer systems design services. Compared to a year ago, the PST sector is about 298,000 jobs greater than the same period in 2015.

• Health care employment for November was 24,000 greater than October. About 13,000 workers were added in the hospital subsector. On a YOY basis health care employment is about 470,000 greater in 2015.

• Employment in food services and drinking places increase by about 32,000 jobs in November and it is up by 374,000 greater than a year ago.

• Combined, the four sectors mentioned above show job gains of about 1.4 million compared to a year ago.

• Compared to the prior month there was little change in the following sectors: manufacturing, wholesale trade, transportation and warehousing, financial activities, and government.

All eyes will continue to be on the Fed and their meeting later this month. Although U.S. employment has increased at a decreasing rate through 2015, the latest BLS report is probably strong enough for them to finally announce a hike in short term interest rates.

Moving forward the $64 question is, “Will job growth continue at the rate experienced in the second half of the year or will we move forward at the more robust rate shown in the first half of the year?”

U.S. Employment

Expect Solid Job Growth in Upcoming BLS State Release

On Friday November 20th, the BLS will release the state wage and salary employment data through October. In light of the release of U.S. employment earlier this month, the state data is likely to show solid job growth in most cases. This brief overview of the national economy sets the tone for the upcoming release of the Colorado data.

The U.S. Economy
In a nutshell, some of the top reasons to feel upbeat about the U.S. economy are:
• U.S. Consumer Sentiment is up as measured by the University of Michigan Consumer Sentiment Survey.
• There was strong U.S. job growth for October – 271,000 jobs were added.
• The U.S. unemployment rate continues to decline. Theoretically, the U.S. is at or near full employment and the economy is operating efficiently.
• The ISM Non-Manufacturing Purchasing Managers Index is strong.
• Construction spending continues to be strong.
• Many companies are cash rich and they are strategically expanding through mergers and acquisitions.
• Inflation remains low.

Turbulence – Concerns That we Have Come to Grips With
There are always reasons for people to feel jittery about the economy.
• Since 2010 there have been concerns that the Greek debt crisis would unravel the EU. Those concerns reappeared earlier this year, but have subsided.
• There are worries that the slowdown in the growth rate for the Chinese economy and the impact it will have on their immediate trading partners will cause a downturn in the global economy. This is less of an issue than it was several months ago
• The summer volatility in the equity markets has subsided. The VIX has dropped from almost 41 in late August to about 17 on November 19th. Much of the lost ground has been regained. For example, the S&P 500 closed at 2,081 on November 19th, up from 1,868 in late August.
• The inaction of the Fed to raise interest rates is reminiscent of a shy high school boy who is smitten with his first girl friend. He keeps thinking, “Is now the right time for me to kiss her.” And she is thinking, “He must not like me because he won’t kiss me.” While many agree that a rate increase is long overdue, the issue is the timing of that increase – just like that first kiss. Now is the time.

Turbulence – Areas that Continue to Make us Uneasy
Terrorism and the price of oil are areas that cause everyone to toss and turn at night.
• It is unlikely we will ever get used to the “sick-in-your-stomach feeling” caused by ISIS and other terrorist groups. Their direct impact is psychological. Indirectly, consumers will be more cautious and businesses will be obligated to spend more on security.
• For over a year now, the price of oil has disrupted the economies in Tier I oil producing states. In some states such as Colorado, production has remained strong; however, it will likely drop off as there is a glut of oil and a lack of storage facilities. Problems in the industry could be exacerbated by further declines in the price for a barrel of oil caused by the glut. Some industry experts project oil could drop to $20 per barrel.

Other National Concerns
Holiday retail sales are projected to increase by 3.5% to 4.0% compared to last year and online sales will be double that amount. This is solid growth, but is an issue only in the sense that it is not stronger.

The major concern about the U.S. economy is the manufacturing sector. The ISM manufacturing index has trended downward since August 2014 and has been near 50 for the past two months. Purchasing managers are ambivalent about the level of growth in their companies. At the moment the industry appears to be on the verge of a downturn.

Concluding Thought
With this as a background, Coloradans should expect the upcoming BLS report to say that job growth will be much stronger than recent months.

U.S. Employment Shows Strong Gain in October

On November 6th, the Bureau of Labor Statistics released its monthly update for U.S. nonfarm payroll employment. The number of seasonally adjusted jobs increased by 271,000 in October. Over the previous 12 months, employment has increased by an average of 230,000 workers per month. That equates to 2.8 million per year.

The unemployment rate was down from 5.7% to 5.0% a year ago and 5.1% in the previous month. The number of unemployed persons was down from million a year ago to 7.9 million in October.

The areas with the largest increases were professional and business services (PBS), health care, retail trade, food services and drinking places, and construction.
• Employment in the PBS Sector increased by 78,000 in October, compared with an average gain of 52,000 per month over the prior 12 months.
• Health care employment increased by 45,000 jobs in October. Over the past year, health care has added about 41,200 jobs per month, or slightly less than a half million jobs for the year. About 27,000 jobs were added in ambulatory health care services and 18,000 in hospitals.
• The number of retail trade jobs increased by 44,000 in October. This is well above the average monthly gain of 25,000 jobs for the past 12 months. In October about 20,000 were added in clothing and accessories stores, 11,000 were added in general merchandise stores and 6,000 were added in automobile dealerships.
• About 42,000 workers were added in food services and drinking places in October. For the past year the monthly average has been about 31,000.
• Finally, construction employment rose by 31,000 in October. This is slightly higher than previous months. About two-thirds of the October growth was in nonresidential specialty trade contractors.

On the down side, mining employment fell by 5000 workers. The sector peaked in December 2014 and has since shed 109,000 jobs.

Employment in other major industries was similar to the prior month.
It was encouraging to see this level of job gains. Next month, we will learn whether the level of October employment was a “one hit wonder” or a reversal of the downward trend that has been taking place since the second quarter.

U.S. Posts Weak Job Growth in September

On October 2nd the Bureau of Labor Statistics released its monthly update for U.S. nonfarm payroll employment. The number of seasonally adjusted jobs increased by a meager 142,000 workers in September.

Despite the weak job growth in September, the unemployment rate was unchanged at 5.1% and is likely to continue on a downward trend for the remainder of the year.

For the month of September job growth occurred in five major areas.

• Health care added 34,000 jobs in September. This is slightly below the average increase of 38,000 jobs per month over the prior 12 months. About 16,000 jobs were added in hospitals and another 13,000 in ambulatory health care services.

• Employment in information rose by 12,000 in September. The sector has about 44,000 more workers than a year ago.

• During September professional and business services added 31,000 jobs. This is well below the average of 45,000 per month so far this year. By comparison, the sector increased by an average of 59,000 in 2014. Notable job gains occurred in computer systems design and legal services. Because many companies in this sector are a part of the country’s advanced technology cluster, there are concerns that growth is not stronger.

• Retail trade employment rose by 24,000 in September. This is slightly less than the average monthly gain of 27,000 jobs over the past 12 months. Notable gains were in general merchandise stores and automobile dealers.

• Employment in food services and drinking places added 21,000 workers in September, well below the monthly average of 29,100 workers.

Once again, mining employment dropped sharply, this time a decrease of 10,000 workers. Most of the lost jobs were in support activities. Lower prices for a barrel of oil is taking a toll on the industry.

Employment in other major industries was similar to previous months.

Two things are unsettling about the employment report for September:
•The level of job growth is weak.
• The quality of jobs are weak. While it is great that people are finding work, many of the jobs have lower than average wages.

Time will tell whether the economy has headed south or if it has hit a bump in the road.

If the Economy is Doing so Well, Why Doesn’t it Feel More Robust?

The Great Recession has been over for five years, but in many ways the economy still feels like we are still in the recovery stages.

In 2001 the business cycle was coming to an end when 9/11 exacerbated the situation. Workers in most sectors were touched by the recession. Fortunately, we could blame the downturn on the terrorists.

The country rallied, and with fiscal policies such as zero percent financing we recovered – some would say it was a false recovery because we stole sales from the future. By 2007 we were confident that all would be well, but that didn’t turn out to be the case.

In both recessions many families were hit hard, regardless of race, job title, or income level. In some cases one or both spouses lost their job, establishments went out of business, people had their houses foreclosed on, and there was no place to hide. Both recessions touched nearly everyone and the fact they were back-to-back doubled the pain.

In 2007 most economists did not see the 2007 recession coming and when they realized something was wrong, they failed to acknowledge that it was for real. In fact some of the state’s leading economists were in denial. (It is almost funny to re-read newspaper articles and emails from that era talking about the economy.)

In retrospect there were some small signs pointing to the 2007 recession, such as declines in financial employment. These signs weren’t sufficient to make anyone believe a major downturn was impending. For the most part, the public did not have access to the data and information that caused the problem. Many of those who had access to the information may not have understood the ramifications of what was actually happening. In some cases those who had access to the information conveniently ignored it. As business leaders and the public learned about the cause of the recession some felt betrayed by what happened. They had a right to be upset because the 2007 recession was not part of a normal business cycle. It was self-inflicted.

Psychologically the “back-to-back” recessions changed the structure of the way companies do business. Companies had to find ways to be successful with fewer employees. As a result they became more efficient and hired fewer workers during the recovery.

It was difficult for some of the laid off workers to come to terms with the realization they wouldn’t have a job waiting for them when things got better. It was tough for older workers to be ungraciously kicked off the payrolls. At the same time, several graduating classes of college students, with hefty student loans, were passed over because there were no jobs for them.

Many of the workers who held onto their jobs felt both blessed and cursed. They were fortunate to have a job, yet at times they were taken advantage of (minimal or no pay increases, reduced benefits, longer hours, more responsibilities). Work became a necessary burden for many.

As a result of the “back-to-back” recessions consumers changed spending patterns, particularly in retail. Many people have been more discrete with their spending, they may not spent as much they once spent, and they tend to wait for items to be on sale before they purchase them. Adults with family members who had experienced the Great Depression may have benefitted from their experiences. As the Rolling Stones said, “You can’t always get what you want, but if you try sometime you find you get what you need.”

Economists are partially to blame for the feeling the economy does not feel more robust. They continually refer back to the recession in their charts and their discussions. By continuing to refer to the recession, economists are continually reminding people how bad the economy was just a few years ago. It is difficult to feel the economy is robust when you are always looking over your shoulder.