The COVID-19 Recession (Real GDP)

Which had a greater impact on U.S. real GDP?  Was it the COVID-19 Recession or the Great Recession?

In Q4 2019, the U.S. real GDP peaked. The new year (2020) started on a positive note with solid job growth in January and February. In March COVID-19 was declared a pandemic. Government leaders put lockdowns and restrictions in place that caused employment and real GDP to plummet.

The rate of change in real GDP for Q1 was -5.0%. The Q1 value was 98.7% of the Q4 2019 value.

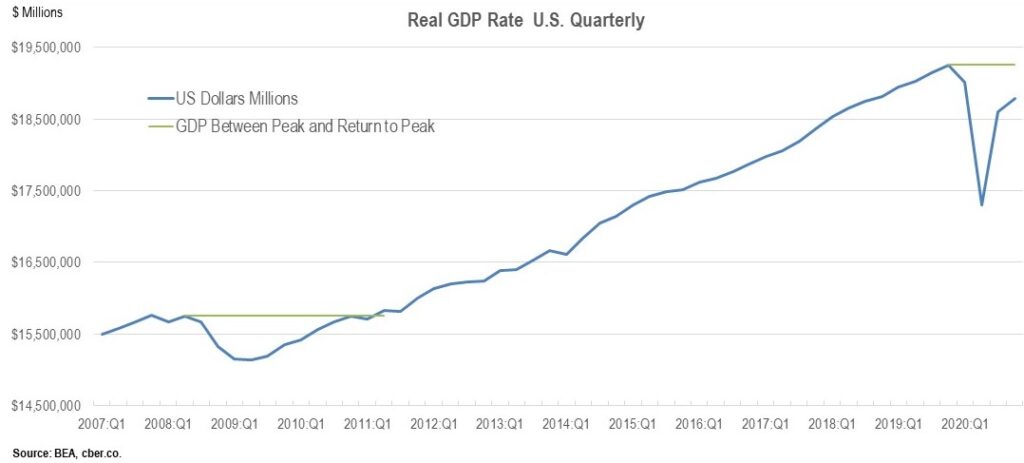
The trough of the downturn occurred in Q2. The rate of change was -31.4%. The Q2 value was 89.9% of the Q4 2019 value.

In Q3, the number of lockdowns and restrictions was reduced and the recovery began. The change in the real GDP growth rate for Q3 was +33.4%. The Q3 value was 96.6% of the Q4 2019 value.

The rate of growth tapered off in Q4 because there was a resurgence in the virus and some government leaders restored lockdowns and other restrictions. The change in the real GDP growth rate for Q4 was 4.0%. The Q4 value was 97.5% of the Q4 2019 value.

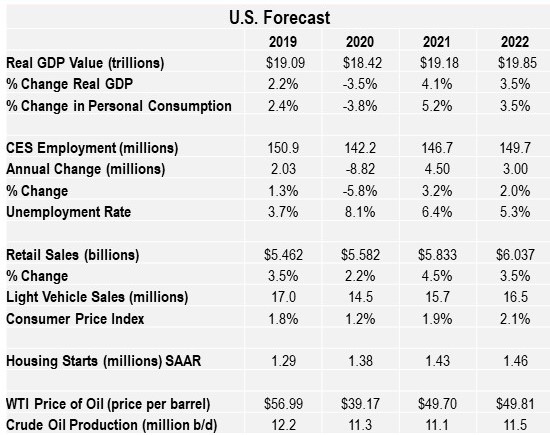
The path of the real GDP value was V-shaped during 2020. It will more closely resemble a checkmark when 2020 and 2021 are combined. The value of real GDP will return to the Q4 2019 level in Q4 2021.

In 2021 real GDP growth will be driven by stimulus funding, which will increase employment and spending. There will be stronger growth in the second half of the year.

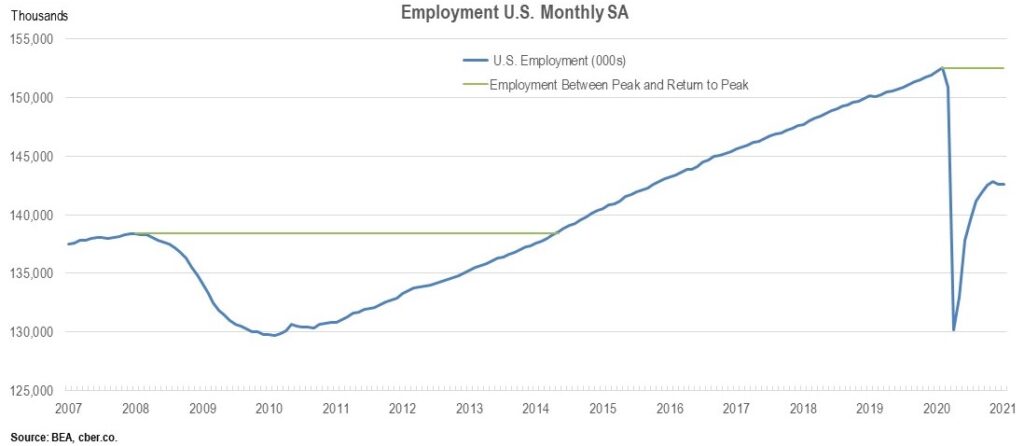
Overall, there were be two quarters when the value of real GDP declined and six quarters where it recovered to reach the Q4 2019 value. The total time of the decline and recovery is eight quarters or two-years.

A look at the Great Recession shows real GDP peaked in Q2 2008 and it declined for four quarters. Real GDP increased from Q2 2009 to Q2 2011 (eight quarters), until it returned to the Q2 2008 peak. The overall time of the decline and recovery was 12 quarters or 36 months.

The Great Recession was more shallow; however, the COVID-19 Recession recovered more quickly.

The COVID-19 Recession (Employment)

It has been almost a year since the COVID-19 recession hit the U.S.

In February 2020, U.S. employment peaked.  In March, WHO declared the COVID-19 virus a pandemic. Government leaders put lockdowns in place that caused employment to decline in March and April. At the trough of the decline, in April, U.S. employment was 85.3% of the February 2020 total. Said differently, in March and April, the U.S. economy lost 22.3 million employees.

By the end of 2020, U.S. employment was 93.48% of the February 2020 total. Only 49,000 jobs were added in January 2021. Employment edged up a notch and was 93.51% of the February 2020 total. On a positive note, January employment had increased by 12.4 million jobs.

Through the first part of the summer, the employment recovery was V-shaped. As net job creation tapered off, it has turned into a checkmark shaped recovery.

U.S. Employment

The Great Recession was much different than the COVID-19 Recession. A shock to the financial system caused the Great Recession. On the other hand, the U.S. financial system was in good shape when policies related to the COVID-19 medical crisis triggered the current recession.

U.S. employment peaked in January 2008. As the financial crisis snowballed, U.S. employment declined for 25 months. This declined was longer than the COVID-19 recession, but not as deep.

At the trough in 2010, U.S. employment was 93.7% of the January 2008 total. It took 51 months of job recovery to return to the January 2008 level. The combined length of the employment decline and recovery was 76 months.

The recovery from the COVID-19 recession will be in Q4 of 2022 or Q1 of 2023. The estimated time of recovery from the trough will be 2.5 to 3.0 years. The total estimated time of recovery from the previous peak is approximately 31 to 37 months.

There are many potential headwinds. Keep your fingers crossed.

U.S. Economic Forecast 2021

The U.S. economic forecast points to improvement in Q3 and Q4. The value of real GDP slowed in Q4 2020. A slower rate of growth will continue in Q1 2021. Economic growth will resume in Q2. The value of real GDP will return to its pre-pandemic level in the second half of 2021.

A similar pattern will occur in the labor market. Job losses are likely to occur in Q1. By mid-year, job growth will return. Total employment will return to its 2019 level in 2022 or 2023. The uptick in unemployment claims will cause the unemployment rate to remain higher than usual. As more people are vaccinated, the economy will open further, and more people will return to work.

The hospitality industry has been hit hard by the lockdowns and restrictions. Employment in those areas is not expected to return until 2023. On a similar note, the airline industry was off by as much as 95%, compared to the prior year. Domestic air travel is not expected to return to pre-pandemic levels until 2023. International air travel will return in 2024.

U.S. Economic Forecast

Personal consumption will become positive in 2021. Pent-up demand and stimulus support will drive retail sales higher in 2021. Both will return to pre-pandemic levels in 2022.

Light vehicle sales will gradually improve and return to 17 million units in 2023. At the moment, the automobile industry is plagued with a shortage of semiconductors. This will negatively impact sales.

Inflation will remain near the Federal Reserve’s target of 2.0%. Having said that, some economists fear the stimulus package will cause inflation problems in 2021.

The number of housing starts will increase in 2021 as interest rates remain low.

Crude oil production and prices will remain flat in 2021.They will post slight increases in 2022.

While the overall U.S. economic forecast is positive, there is still significant headwinds.

Colorado Recovery Lagging Other States

Last summer, Colorado was one of the top states in the recovery from the C-19 pandemic. As time has passed, its economic performance has gotten worse.

The most recent release of data from the Bureau of Labor Statistics shows that Colorado lost 20,300 jobs in December, compared to November. December was the second consecutive month that the state lost jobs. 

The unemployment rate jumped to 8.4%. That rate was the 48th highest rate in the country. It was slightly worse than New York but less than California, Nevada, and Hawaii.

Only 2 states in the top 25 lost jobs in December 2020.

The two charts in this post show the following:

  • Column 1 is the rank of the recovery (column V).
  • Column II is the absolute change in employment from November 2020 to December 2020.
  • Column III is the percentage change in employment from November 2020 to December 2020.
  • Column V is the percentage recovery from February 2020 to December 2020.

Colorado (green) has the 25th lowest percentage of recovery, 94.6%. Two states, Utah and Idaho, have already returned to their employment pre-pandemic employment levels.

The chart above shows that 2 of the 25 states lost jobs between November and December.

The chart below shows that 19 of 26 states lost jobs between November and December.

State and local leaders have struggled to maintain a balance between the number of new C-19 cases and deaths and the health of the economy. Stay tuned.

19 of 26 states lost jobs in the 26 to 51 ranking.

2021 Colorado Economic Forecast

The following forecast is from the 2021 cber.co Economic Forecast for the United States and Colorado.

Colorado’s real GDP growth rate for 2021 will be slightly higher than the U.S. rate It will return to its pre-pandemic value in late 2021.

Colorado employment posted declines in Q4 2020. The negative trend will continue in Q1 2021. Employment will return to its 2019 level in 2022.

Colorado’s unemployment rate will be greater than most states because unemployment claims will remain high.

Retail sales will rebound in 2021 as a result of pent-up demand. Sales will level off at pre-pandemic levels in 2022.

In 2021 and 2022, inflation will be slightly higher than the U.S. rate.

This image has an empty alt attribute; its file name is image-1.png

The number of passengers through DIA in 2020 was about half of the 2019 total. Domestic flights will return to their 2019 level in 2023. International flights will return to their pre-pandemic level in 2024.

There was an increase in the number of building permits issued in 2020. There will be more permits in 2021 as the population increases. Also, there is a need for affordable housing in the metro areas.

State regulations and reduced demand caused a decline in oil production in 2020. The production of oil will be flat in 2021 and 2022.

COVID-19 cases per 100,000 – U.S. vs Colorado

The Opportunity Insights project is tracking the recovery of the U.S. economy from COVID-19-19. The following data is through January 12, 2021.

There were 44.4 COVID-19 cases per 100,000 in Colorado and 75.9 cases per 100,000.

The Colorado rate is trending down while the U.S. rate is trending up. The light grey lines in the background represent other states. The rate for Colorado is appears to be lower than most states.

Colorado has paid a steep price economically for having lower COVID-19 rates per 100,000. The state was ranked 48th in December for the worst unemployment rate in the nation.

States with the lowest rates (per 100,000 people) include Hawaii, 13.8, and Vermont, 25.2 States with the highest rates include Arizona, 130.0, and California, 110.0.

COVID-19 Colorado vs. U.S.

The 2018 Colorado Economic Forecast – Call it Steady

The best description of the 2018 Colorado economic forecast is steady.

After adding jobs at a rate of 2.2% in both 2016 and 2017, Colorado will add jobs at a rate of 2.0% in 2018. Given all the moving pieces in an economy, that is steady!

Watch for the following on Colorado’s economic front in the coming months.

  • Colorado will benefit from stable global and U.S. real GDP growth.
    Net migration will be comparable to the last two years.
  • The Colorado inflation rate will increase; it will be about a point greater than the U.S. rate.
  • The Colorado economy is not operating efficiently because the unemployment rate is too low.
  • The Colorado real GDP growth rate will be greater than the U.S. rate and will be driven by health care, real estate, and the extractive industries.
  • The state’s economic growth would be slowed if the Fed Funds rate is increased 3 times in 2018.
  • Manufacturing growth will be driven by a handful of larger companies.
  • Retail trade is evolving. Retail sales will remain strong. 
  • The 2018 legislative session will be dicey as legislators struggle to address social issues, congestion, transportation issues, the state pension fund, and how much funding should be allocated to education.
  • The state’s information sector is quietly evolving; there will be minimal job growth, but high value added.
  • The growth of the state will be constrained by the lack of workers to complete construction projects.
  • There are three economies in Colorado – Front Range, micropolitan areas such as Durango, and rural Colorado. It is an understatement to say that many rural counties are significantly challenged.
  • Amazing things are happening at DIA and the area surrounding it – Welcome Gaylord!
  • The lack of snow in December and early January has left its mark on the state’s ski areas. It would be worse if they had not invested in snowmaking.

There will be ups and downs, but 2018 will be a good year! It will be steady!

For more details about the Colorado economy check out the  cber.co 2018 Colorado economic forecast on this website.

Colorado Job Growth Holds Steady

In early March the Bureau of Labor Statistics released revised employment data for Colorado showing that 2014 was the 3rd strongest year of job growth in the state’s history and 2015 was ranked 9th.

Data released near the end of March shows that average year-over-year Colorado job growth for the past seven months has been about 67,000 jobs greater than the previous 12-month period. The reduced rate of expansion has occurred for the following reasons:
• The slowdown in the Chinese economy has caused many countries to experience lower rates of GDP growth.
• Colorado’s extractive industries are continuing to contract.
• Just as the Broncos can’t win the Super Bowl every year, it is not possible to have “Super-Bowl-like” job growth all the time.

Although the rate of growth for employment and the GDP are less than last year, the economy will still experience solid growth for the following reasons:
• There is solid GDP growth across most Colorado sectors.
• Job growth is stable in most industries and occupations.
• Solid and diverse growth will continue in the state’s personal income, population, and per capita personal income.
• There is a strong outlook for the construction industry in Colorado and the U.S.
• Robust new car sales are a reflection of solid personal consumption.
• There is increased activity at DIA and the area surrounding the airport.
• While low unemployment can be problematic it will drive higher wages.
• Higher wages will cause increased consumption and offset higher living costs.

Despite the headwinds, Colorado is on track for continued solid growth in 2016. For more details check out the most recent updates by clicking here or check out cber.co Colorado Economic 2016 Forecast.

Colorado Job Growth

Colorado 2015 Job Growth – 9th Best Year In History of State

This past week, the Bureau of Labor Statistics (BLS) announced that Colorado job growth for 2014 was revised upwards to 83,000 and 2015 job growth was bumped up to 76,300. The respective rates of Colorado job growth were 3.5% in 2014 and 3.1% in 2015.

The upward benchmark revisions made 2014 the third strongest year of absolute job growth while 2015 was the ninth strongest year. This is the best news for the state since the Broncos won the Super Bowl on February 7th.

During 2014 the BLS monthly estimates reported the Colorado economy was adding jobs at a declining rate. This past year, BLS showed that Colorado was adding jobs at an even faster declining rate than in 2014. Thank goodness the BLS projection models were grossly flawed. the benchmark revisions match the activity that has taken place on the streets for the past two years.

In 2015 the five largest sectors/subsectors were:
• Health Care
• Retail
• Accommodations and Food Services
• Professional, Scientific and Technical Services
• Financial Activities
These five industries accounted for 45.8% of total employment. Total employment for 2015 was 2,541,200.

In 2015, the five largest sectors/subsectors for the number of jobs added were:
• Health Care
• Construction
• Accommodations and Food Services
• Professional, Scientific and Technical Services
• Retail
These five industries accounted for 60% of the jobs added. The job growth for these five industries combined was 4.1% in 2015.

Job growth in 2016 will be solid, but slightly off the pace of 2015. Growth will be slowed by low oil prices, the slow economy in China, and a strong dollar abroad.

For more details check out the review of Colorado 2015 job growth by clicking here. And there is much more. For more details check out the cber.co Colorado Economic 2016 Forecast.

2015 job growth

Fifty-Four Million Passengers Passed Through DIA in 2015

It is official, Denver International Airport celebrated its 20th anniversary with a record setting 54 million passengers in 2015.

To be exact, there were 54,014,502 passengers in 2015 up from 53,472,514 in 2014. This is an increase of 1.0% or 541,988.

The record growth was made possible by solid traffic throughout the year that included a record number of passengers in April and the last four months of the year.

International traffic in 2015 was flat compared to the previous year, 2,292,613 in 2015 vs. 2,208,209 in 2014. A DIA press release indicates that the use of the airport’s custom facility increased by 16%; however, Canadian preclearance flights declined 22%. The Canadian shortfall was attributed to the decreased activity in the oil and gas industry caused by lower prices for a barrel of oil.

DIA Passengers

It was also a good year for cargo. DIA handled 545,784,431 pounds of cargo in 2015 compared to 519,434,240 pounds the prior year. This is an increase of 5.1%.

United continued to be Denver’s airline of choice with 42.3% market share. Southwest was second with 29.8% followed by Frontier with 12.4%.

The airline with animals on the tails of its planes had a disastrous year in 2015. It led the industry in complaints and the number of Frontier passengers in 2015 declined by almost 32% from the prior year.

Airline and Affiliates 2014 Passengers 2015 Passengers % Increase Market Share
American 3,078,481 3,287,333 6.8% 6.09%
Delta 2,364,589 2,675,472 13.1% 4.95%
Frontier 9,840,553 6,697,139 -31.9% 12.40%
Southwest 14,100,970 15,814,696 12.2% 29.80%
United 21,750,604 22,855,819 5.1% 42.31%
Other 2,337,317 2,684,043 24.8% 4.97%

During each of the 20 years that DIA has been in operation, the airport has become more important to the Colorado economy. That will continue to be in case in the years ahead with the addition of the Westin Hotel at the end of the terminal.

In addition there will be a stronger connection to downtown Denver when the light rail project between DIA and Denver is completed. Over the past 20 years businesses have sprung up around DIA. A prime example of that is the Gaylord project that is expected to open in 2-3 years.

DIA has two distinctive competencies over many other airports. First, it is located in the middle of the U.S. Second, it has room to expand when growth becomes necessary.

DIA is poised to be an economic engine for Colorado in 2016 and many years into the future.