The COVID-19 Recession (Real GDP)

Which had a greater impact on U.S. real GDP?  Was it the COVID-19 Recession or the Great Recession?

In Q4 2019, the U.S. real GDP peaked. The new year (2020) started on a positive note with solid job growth in January and February. In March COVID-19 was declared a pandemic. Government leaders put lockdowns and restrictions in place that caused employment and real GDP to plummet.

The rate of change in real GDP for Q1 was -5.0%. The Q1 value was 98.7% of the Q4 2019 value.
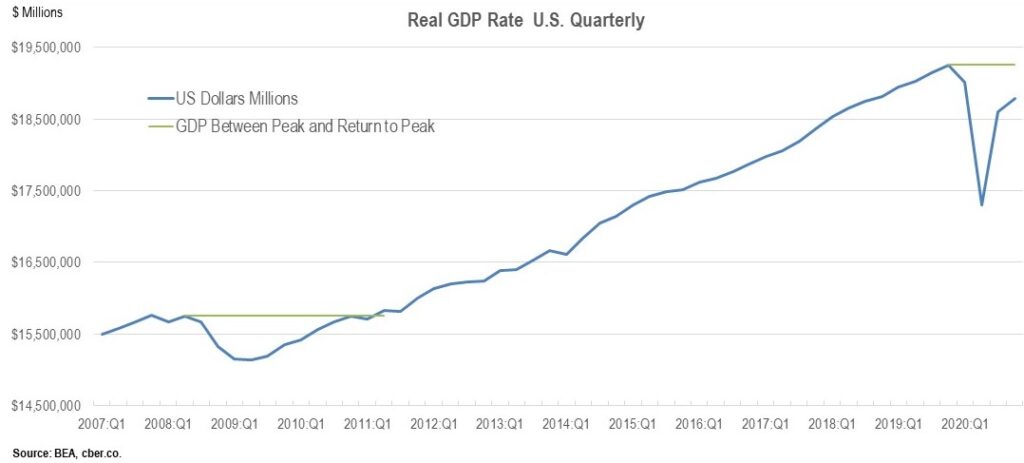
The trough of the downturn occurred in Q2. The rate of change was -31.4%. The Q2 value was 89.9% of the Q4 2019 value.

In Q3, the number of lockdowns and restrictions was reduced and the recovery began. The change in the real GDP growth rate for Q3 was +33.4%. The Q3 value was 96.6% of the Q4 2019 value.

The rate of growth tapered off in Q4 because there was a resurgence in the virus and some government leaders restored lockdowns and other restrictions. The change in the real GDP growth rate for Q4 was 4.0%. The Q4 value was 97.5% of the Q4 2019 value.

The path of the real GDP value was V-shaped during 2020. It will more closely resemble a checkmark when 2020 and 2021 are combined. The value of real GDP will return to the Q4 2019 level in Q4 2021.

In 2021 real GDP growth will be driven by stimulus funding, which will increase employment and spending. There will be stronger growth in the second half of the year.

Overall, there were be two quarters when the value of real GDP declined and six quarters where it recovered to reach the Q4 2019 value. The total time of the decline and recovery is eight quarters or two-years.

A look at the Great Recession shows real GDP peaked in Q2 2008 and it declined for four quarters. Real GDP increased from Q2 2009 to Q2 2011 (eight quarters), until it returned to the Q2 2008 peak. The overall time of the decline and recovery was 12 quarters or 36 months.

The Great Recession was more shallow; however, the COVID-19 Recession recovered more quickly.
Q3 2015 Real GDP Records 2.0% Gain

On December 22nd, the Bureau of Economic Analysis released the “third estimate” of the Q3 2015 Real GDP for the United States. It increased at an annualized rate of 2.0% compared to 3.9% for Q2.

The nominal or current-dollar GDP (chained on 2009) for Q3 increased by $146.5 billion to $18,060.2 billion, a gain of 3.3%. The Q2 current-dollar GDP rose by 6.1% or $264.4 billion.

2015 Real GDP, Chained Dollars (2009 Billions)


Q1

Q2

Q3

        Gross domestic product

$16,177

$16,334

$16,414

Personal consumption expenditures

$11,081

$11,179

$11,262

    Goods

$3,804

$3,855

$3,902

    Services

$7,277

$7,325

$7,363

Gross private domestic investment

$2,830

$2,865

$2,860

    Fixed investment

$2,701

$2,736

$2,761

        Nonresidential

$2,189

$2,211

$2,225

        Residential

$512

$524

$534

    Change in private inventories

$113

$114

$86

Net exports of goods and services

$(541)

$(535)

$(546)

    Exports

$2,091

$2,118

$2,121

        Goods

$1,429

$1,452

$1,449

        Services

$661

$664

$671

    Imports

$2,633

$2,652

$2,667

        Goods

$2,161

$2,178

$2,186

        Services

$470

$472

$480

Government consumption expenditures

$2,839

$2,857

$2,870

    Federal

$1,111

$1,111

$1,112

        National defense

$680

$681

$678

        Nondefense

$431

$430

$433

    State and local

$1,726

$1,744

$1,756

Residual

$(41)

$(45)

$(49)

The 2015 Q3 Real GDP posted gains in the following areas:
• Personal consumption expenditures, the largest category, were up by 3.0% compared to 3.6% in the previous quarter. Goods were up 5.0% and Services were up 2.1%.
• Fixed investments posted a gain of 3.7% in Q3, down from 5.2% in Q2. Nonresidential investments for Q3 were up 2.6% and residential investments rose 8.2%. Both had lower levels of growth than Q2.
• Exports posted a gain of 0.7% for Q3 compared to 5.1% in Q2. Goods actually declined by -0.9% while services increased by 3.9%.
• Imports recorded an increase of 2.3% in Q3 compared to 3.0% in Q2. Goods increased by 2.3% while services posted a 6.4% increase. (Note: Imports are subtracted from the value of the GDP).
• Government consumption increased by 1.8% in Q3 compared to 2.6% in Q2. Federal spending was flat with a decrease in national defense spending and an increase in Nondefense spending. State and local government spending posted a 2.8% gain, down from 4.3% in the prior quarter.

Percent Change From Preceding Period in Real GDP – Seasonally Adjusted at Annualized Rates

Q1 Q2 Q3
        Gross domestic product 0.6 3.9 2.0
Personal consumption expenditures 1.8 3.6 3.0
    Goods 1.1 5.5 5.0
    Services 2.1 2.7 2.1
Gross private domestic investment 8.6 5.0 -0.7
    Fixed investment 3.3 5.2 3.7
        Nonresidential 1.6 4.1 2.6
            Structures -7.4 6.2 -7.2
            Equipment 2.3 0.3 9.9
            Intellectual property products 7.4 8.3 -0.8
        Residential 10.1 9.3 8.2
    Change in private inventories
Net exports of goods and services
    Exports -6.0 5.1 0.7
        Goods -11.7 6.5 -0.9
        Services 7.3 2.3 3.9
    Imports 7.1 3.0 2.3
        Goods 7.2 3.2 1.4
        Services 6.7 2.0 6.4
Government consumption expenditures -0.1 2.6 1.8
    Federal 1.1 0.0 0.2
        National defense 1.0 0.3 -1.4
        Nondefense 1.2 -0.5 2.8
    State and local -0.8 4.3 2.8
Addendum:
    Gross domestic product, current dollars 0.8 6.1 3.3

Q4 2015 Real GDP is expected to be stronger than Q3 and the rate of growth for 2015 will be in the range of 2.3% to 2.5%.

Which has the Top Economy – Colorado, Utah, Washington?

There are frequent references in the local media about how Colorado is one of the top state economies in the country. And it is!

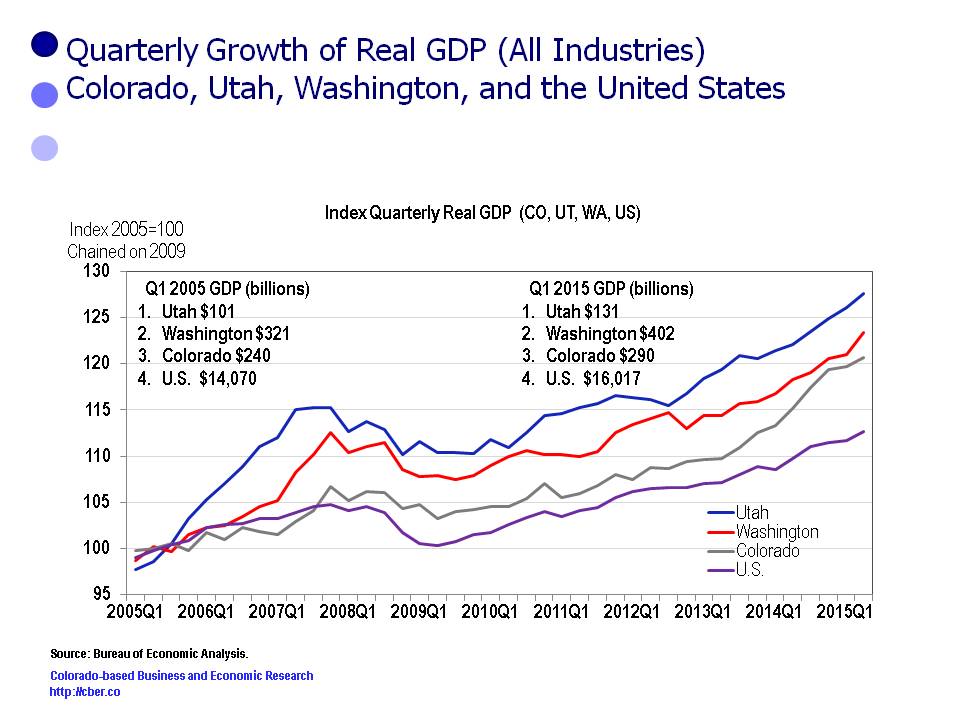
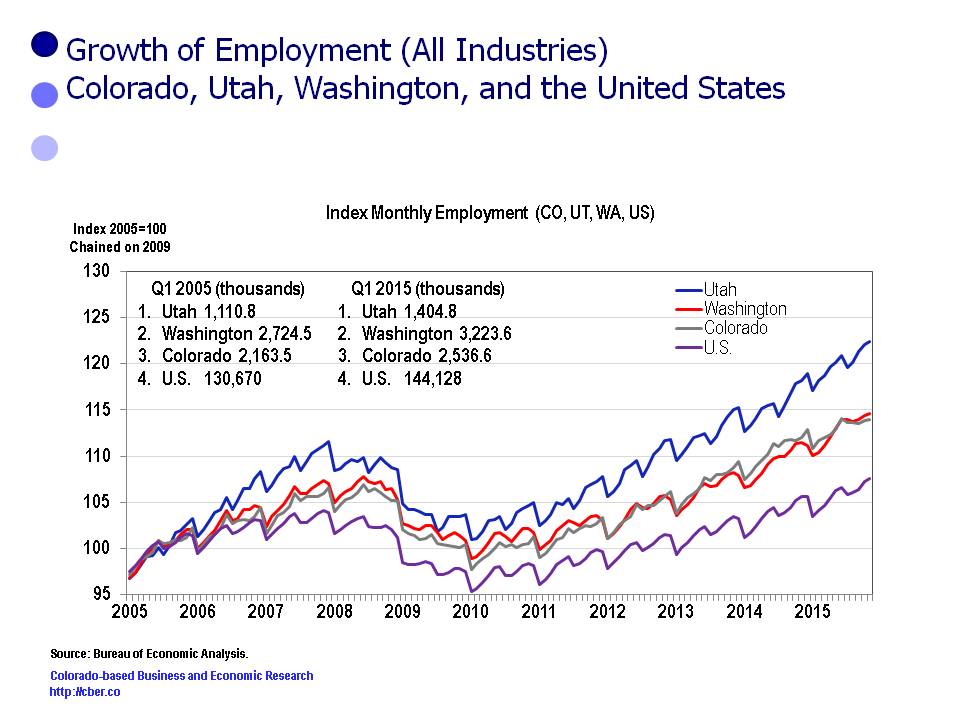
There are many metrics that can be used to compare state economies. The two best metrics are the growth rates for Real GDP and employment. In this post we look at these metrics from 2005 to the present for Colorado, Utah, Washington and the U.S.

Employment
• Washington has the greatest number of employees, followed by Colorado.
• Utah had the highest rate of employment growth of the three states. Colorado and Washington have grown at similar rates; however, Washington’s rate of growth has been off a larger base of employment.
• Employment for all three states has grown at a faster rate than the U.S. That rate of growth has accelerated since 2010 for all three states.

Colorado Utah Washington

Real GDP
• Washington has the largest GDP, followed by Colorado.
• The Real GDP for all three states has grown at a higher rate than the U.S.
• Utah had the fastest rate of Real GDP growth from 2005 to present followed by Washington. Colorado is third.
• Since the end of the recession the GDP for all three states has grown at a faster rate than the United States. Colorado had the fastest rate of Real GDP growth from 2013 to present because of the rapid growth in the extractive industries. That rate of growth is likely to decrease in 2015 and beyond as a result of challenges facing the oil and gas industry caused by lower oil prices.

Colorado Utah Washington

Based on these metrics Washington has the largest economy and Utah is growing at a faster rate than the other two states. The strengths of the economies in Utah, Washington, and Colorado make them great places to live, work, and play. Here’s to a prosperous year for all three states in 2016.

Colorado Economy On Track to Add At Least 68,600 Jobs in 2015

At the midpoint of the year the U.S. economy is on solid footing and the second half of the year will be much stronger than the first half. The Colorado economy continues to outperform the U.S. in its rate of growth for population, employment, and GDP.

Key Data Points for the U.S.
Real GDP – Q2 will be stronger. Annual growth will be 2.5% to 2.9% in 2015.
Retail Sales – Up 1.3% for 6 months, projected to be up 3.0% for 2015.
U.S. Employment – The U.S. is on track to add 3.1 million jobs this year.
Unemployment Rate – 5.3%, down from 6.1% a year ago, 8.3 million unemployed, trending down.
ISM Indices –Manufacturing is sluggish and expected to remain that way; Non-Manufacturing is steady and well above 50.
Price of a Barrel of Oil (WTI) – Since mid-March it has varied from $43 to $61. Currently in the low 50s, but trending down.
Construction – For 6 months, employment up 4.2%, weekly earnings up 3.0%.
Case Shiller Housing Prices – U.S. prices up 4.2% from a year ago.
Dow Jones Industrial Average – On July 17rd the DJIA was 18,086, up 1.5% from 17,823 at the end of the year.

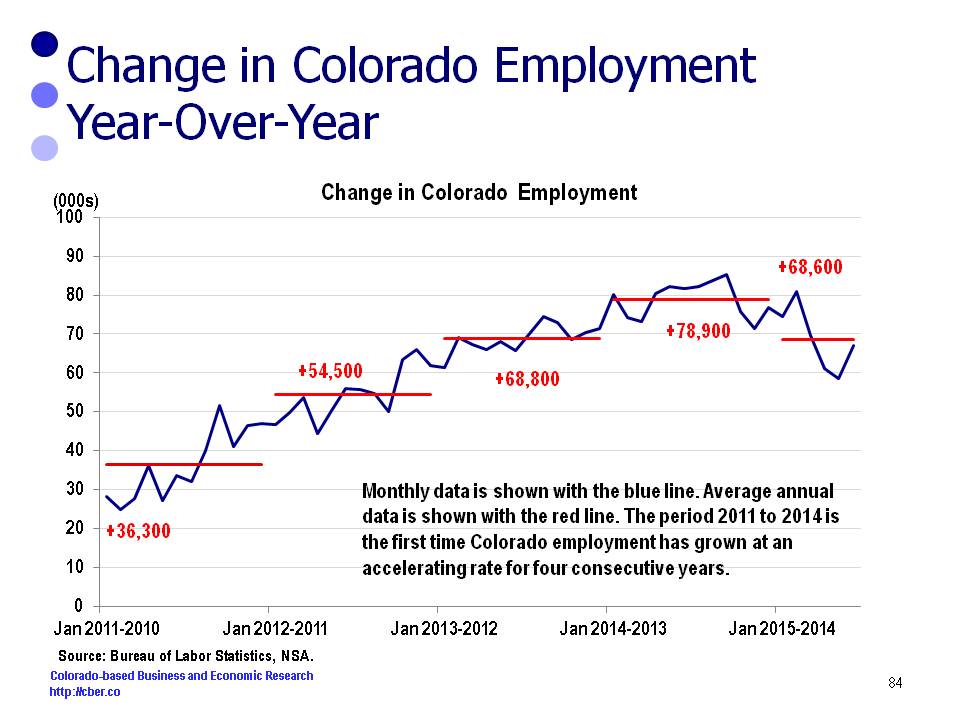
Average Colorado employment is 68,600 greater than the same period last year, with the potential of being revised upward at a later date.

Colorado Economy

As has been the case in the past, the sectors with the top job growth are: Health Care; Accommodations and Food Services (part of the Tourism Industry); Construction; Professional, Scientific, and Technical Services; and Manufacturing. These sectors accounted for about 72% of total job growth in the first half of 2015.

The Bureau of Economic Analysis has released the 2014 Gross Domestic Product for Colorado. The state’s Real GDP expanded at a rate of 4.7% compared to 2.2% for the U.S.

Key Data Points for Colorado
QCEW Revisions – Recent revisions to Q4 2014 could cause 2014 employment to be revised upward in the March 2016 benchmark revisions. There was stronger momentum coming into 2015 than originally anticipated.
Population – Colorado’s population will increase by 88,800 people this year.
Unemployment Rate – 4.4%, down from 5.0% a year ago.
MSA Unemployment Rate – Boulder and Ft. Collins have the lowest rates at 3.5% and 3.6% respectively.
2014 Colorado GDP – The state Real GDP grew by 4.7% in 2014 compared to 2.2% for the U.S.
2014 Contribution to GDP Growth – The Mining sector accounted for 6.2% of GDP and 18.2% of GDP growth in 2014.
Wage and Salary Employment – On average Colorado has added 68,600 jobs this year based on current data. This is not adjusted for the projected revisions.
Leading Sectors for Growth – About 72.2% of the jobs have been added in the Health Care; Construction; Accommodations and Food Services; Professional, Scientific, and Technical Services; and Manufacturing.

For details or more information about the Colorado economy, check out the 2015 cber.co forecast and economic updates on this website, https://cber.co.

The Strengths of the National Economy will Impact Colorado

The U.S. economy is currently stronger than it was in 2014. The good news is the Colorado economy is outperforming the U.S. economy in three key areas:
• The Colorado rate of population growth in 2015 is projected to be 1.6% vs. 0.7% for the U.S.
• The Colorado rate of job growth in 2015 is currently projected to be 3.0% vs. 2.2% for the U.S.
• The recently released GDP data shows that Colorado outperformed the U.S. in the rate of growth, 4.7% vs. 2.2% in 2014.

Currently, the strengths of the national economy outnumber the risks. With that in mind this post reviews the manner in which these strengths will impact the Colorado economy.  For each strength the impact on Colorado is highlighted in italics.

The Fed – Janet Yellen has indicated the Federal Reserve is confident the U.S. economy is performing well enough that interest rates can be raised.

Colorado has experienced stronger economic growth than the nation throughout the first half of the year. The state will continue to experience solid growth in the second half of the year.

Real GDP – After a weak start in Q1, Real GDP growth for the year is projected to be in the 2.5% to 2.9% range – better than last year.

In 2014, Colorado’s rate of Real GDP growth was more than twice that of the U.S. Solid growth is expected to continue in 2015.  strengths of the national economy - retail

Retail – The woes of Q1 seem to be behind us. Consumer spending is expected to be stronger in the second half. This may lead to strong back-to- school sales – a significant source of sales for retailers.

The Colorado economy had strong momentum coming into 2015. It did not experience problems felt elsewhere in Q1. Population and job growth will drive continued solid retail growth in 2015.

Jobs – The U.S. is on track to add more than 3.0 million jobs this year. The unemployment rate and the long-term unemployment rate have continued to decline.

As the year has progressed, U.S. job growth has increased at a solid, but decreasing rate. A similar trend may be happening in Colorado.

Consumer Sentiment – According to the Consumer Sentiment Survey, consumers are upbeat.

The mood of shoppers in the malls and the waiting times at local restaurants suggests that Coloradans are upbeat about the economy.

Industry Sentiment – Purchasing managers have a positive outlook for both goods and services. Manufacturing is more sluggish and may remain that way through the end of the year.

Continued optimism in the non-manufacturing sectors points to ongoing solid growth for these sectors and the Colorado economy.

Inflation – Inflation is below the Fed’s target rate of 2.0%. As interest rates increase, inflation will approach the target rate.

The increase in Colorado housing prices will cause the state’s rate of inflation to further exceed that of the nation.

Construction – There is strong activity in both the residential and non-residential markets. Construction job growth will be constrained by the lack of trained workers.

Despite the lack of trained construction workers, Colorado’s construction industry is responsible for about 18% of the jobs added in 2015.

Housing Prices – The housing market remains strong – too strong in some areas.

Home owners like having greater equity and local governments benefit from higher property taxes.

These strengths of the national economy have created momentum that will strengthen the U.S. and Colorado into 2016.

Advanced Technology Cluster Contributes 17.8% to GDP Growth

In early June the Bureau of Economic Analysis released Gross Domestic Product at the state level for two-digit NAICS Codes.

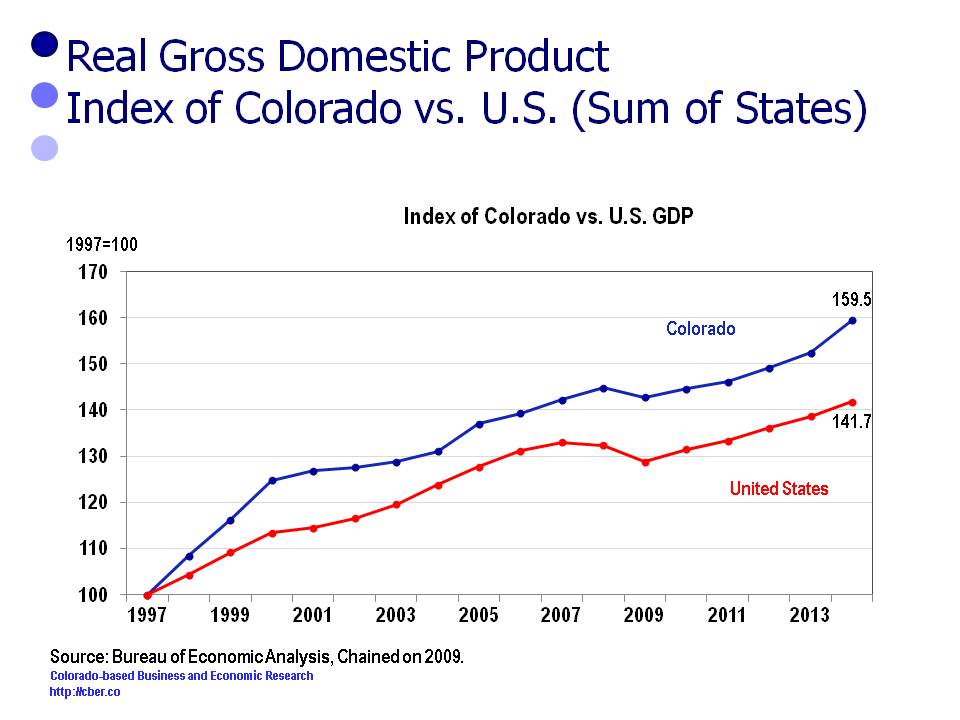
Since 1997 Colorado Real GDP has grown at a faster rate than the Real GDP for the U.S. (Sum of States) in 11 of 17 years. The 2014 U.S. rate of growth was 2.2% compared to 4.7% for Colorado.

Since 1997 Colorado Real GDP has grown at a faster rate than the U.S. (Sum of States), 2.8% vs. 2.1%.

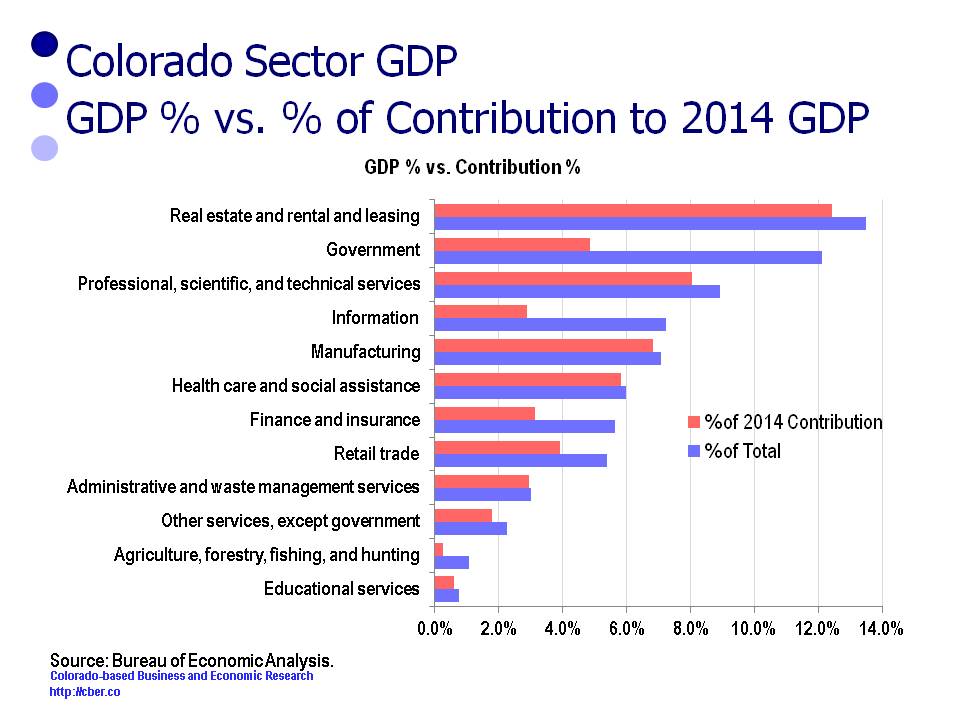
There were 12 sectors that lost share in 2014, i.e. their percent of contribution for these sectors was less than their percent of the 2014 total. Collectively, they accounted for 72.9% of the 2014 GDP and 53.5% of the change in the GDP. It was disappointing that the proxy for Colorado’s advanced technology cluster only contributed 17.8% to state’s GDP.

The following table shows the sectors, their percentage of the 2014 GDP and their contribution to the GDP.

Sector % of 2014 Total % of 2014 Contribution
Educational services 0.7% 0.6%
Agriculture, forestry, fishing, and hunting 1.1% 0.3%
Other services, except government 2.3% 1.8%
Administrative and waste management services 3.0% 2.9%
Retail trade 5.4% 3.9%
Finance and insurance 5.6% 3.1%
Health care and social assistance 6.0% 5.8%
Manufacturing 7.1% 6.8%
Information 7.2% 2.9%
Professional, scientific, and technical services 8.9% 8.1%
Government 12.1% 4.8%
Real estate and rental and leasing 13.5% 12.4%

There are concerns regarding the level of contribution for the five sectors that have the greatest share of the state’s GDP. The top sectors are:
• Real Estate 13.5%
• Government 12.1%
• Professional, scientific, and technical services, 8.9%
• Information 7.2%
• Manufacturing 7.1%
These five sectors accounted for 48.8% of the 2014 GDP; however they only contributed 35.0% of the 2014 GDP growth.

Of specific concern is the fact that PST, Information, and Manufacturing accounted for 23.2% of the state’s 2014 GDP, yet these 3 sectors only contributed 17.8% of the growth of the GDP. These three sectors are a proxy for the state’s advanced technology cluster, a cluster that is supposed to provide the state with a competitive advantage.

Despite these concerns, the level of Real GDP Growth in 2014 provided significant momentum for the Colorado economy moving into 2015.

GDP losing share - Advanced Technology Cluster

2014 Colorado Real GDP Growth More than Twice the Rate for U.S.

In early June the Bureau of Economic Analysis released Gross Domestic Product at the state level for two-digit NAICS Codes.

Since 1997 Colorado Real GDP has grown at a faster rate than the Real GDP for the U.S. (Sum of States) in 11 of 17 years.

gdp index

Since 1997 Colorado Real GDP has grown at a faster rate than the U.S. (Sum of States), 2.8% vs. 2.1%. The 2014 U.S. rate of growth was 2.2% compared to 4.7% for Colorado.

gdp index

There were 8 sectors that gained share in 2014, i.e., their percent of contribution to GDP was greater than their percent of the 2014 total GDP. Collectively, they accounted for 27.1% of the 2014 GDP and 46.5% of the change in the GDP. These sectors were:
• Arts, entertainment, and recreation
• Utilities
• Management of companies and enterprises
• Transportation and warehousing
• Accommodation and food services
• Construction
• Wholesale trade
• Mining

There were 12 sectors that lost share in 2014, i.e. their percent of contribution for these sectors was less than their percent of the 2014 total. Collectively, they accounted for 72.9% of the 2014 GDP and 53.5% of the change in the GDP. These sectors were:
• Educational services
• Agriculture, forestry, fishing, and hunting
• Other services, except government
• Administrative and waste management services
• Retail trade
• Finance and insurance
• Health care and social assistance
• Manufacturing
• Information
• Professional, scientific, and technical services
• Government
• Real estate and rental and leasing

The level of Real GDP Growth in 2014 provided significant momentum for the Colorado economy moving into 2015.

Strong Colorado Manufacturing Output is Essential to Growth of Colorado

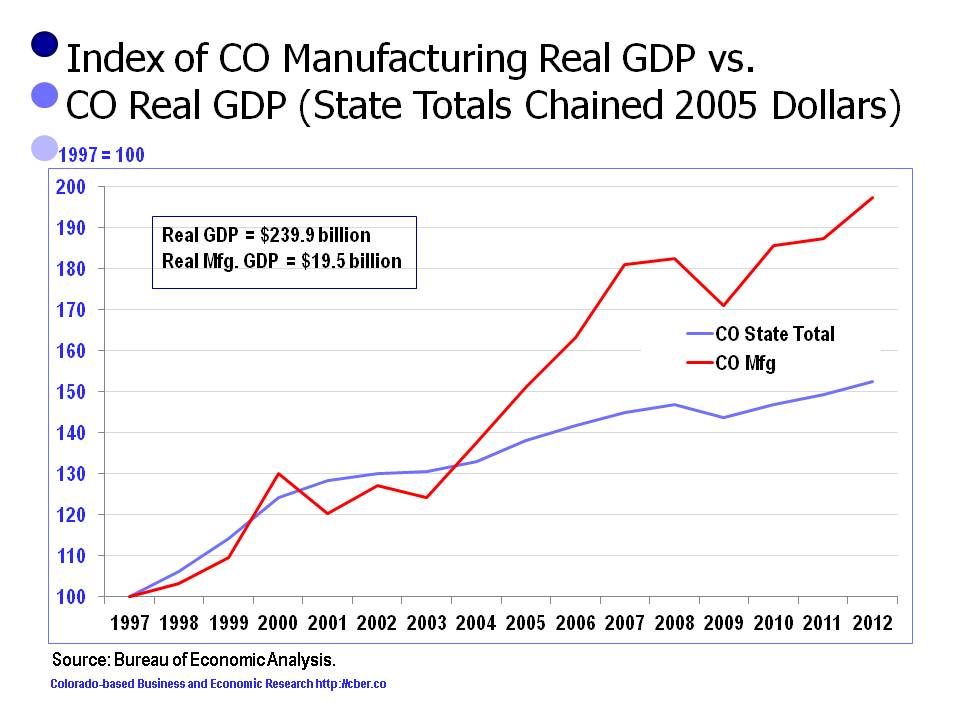
For the period 1997 to 2012, Colorado Real GDP expanded on a more consistent basis than the Colorado manufacturing output. In other words, overall output growth was less volatile.

However; manufacturing Real GDP grew at an annualized rate of 4.6% compared to 2.9% for Real GDP. The faster rate of growth for Colorado occurred, in part, because the manufacturing sector expanded off a much smaller base. Also, a portion of Colorado manufacturing is high value goods, such as electronics.

For this period, total employment increased as an annualized rate of 1.0% and manufacturing declined at an annualized rate of 2.3%. It is clear that gains in output were made as a result of capital expenditures, rather than investment in labor.

Note: At the time of this writing, the 2012 data was the most current data available.

Colorado Manufacturing Output
Growth of Colorado manufacturing output has outpaced growth of state output.


Jobs and Output Data Point to Stronger Growth for Colorado

Earlier today, the Bureau of Labor Statistics released November jobs data for Colorado. As measured by increased jobs and decreased unemployment, the update showed the improvement in the economy is geographically broad-based. Most states are enjoying the recovery!

Specifically the highlights from the jobs data are:

  • Wage and salary employment increased in 43 states and decreased in 7 states and the District of Columbia.
  • Decreased unemployment rates were recorded in 42 states and the District of Columbia compared to a year ago, 1 state was flat and 7 states were higher. Nationally, November unemployment registered 7.0%, down 0.8 percentage points from a year ago.
  • In Colorado the November unemployment rate was down 1.1 percentage points from the same time last year (7.6% compared to 6.5%).

A stronger national economy bodes well for Colorado.

Earlier in the month the Bureau of Labor Statistics indicated its projection models had understated the rate of job growth in the state in 2013. Latest estimates project the state will actually add 60,000 to 65,000 jobs this year.

More good news came today when the Bureau of Economic Analysis revised Q3 GDP upward to 4.1%. Exports and business and consumer spending were stronger than anticipated.

The stronger jobs and output data suggest the impacts of sequestration, the partial government shutdown, and the fallout from the earlier budget and debt ceiling debates may have had less of a net impact than originally thought.

For the first time in 6 or 7 years, Colorado and the U.S. will be entering a new year with a solid foundation for growth. If that foundation remains in place, there is reason to believe that Colorado will add at least 65,000 jobs in 2014.

©Copyright 2011 by CBER.

Leeds Economic Forecast Points to Slower Growth in Year Ahead – AGAIN

On December 8th Professor Richard Wobbekind and the Leeds School of Business (SOB) released the 49th annual economic forecast for Colorado. Unfortunately, the fundamentals of the 2014 outlook were as questionable as the 2012 and 2013 forecasts.

For three consecutive years (2012 to 2014) the SOB has projected fewer jobs would be added in the coming year, even though Real GDP was predicted to increase significantly in two of those three years.

A summary of the SOB forecasts from 2012 to 2014 are provided in the table below.


Leeds School of Business Forecast – US Real GDP and Colorado Employment

Year

Change in Real GDP

Change in State Employment


2012

In 2012 Real GDP will show a significant increase in the rate of growth for 2011

Fewer jobs will be added in the coming year


2013

In 2013 Real GDP will growth at about the same rate as 2012, a slight decrease is possible

Fewer jobs will be added in the coming year


2014

In 2014 Real GDP will increase at a rate almost double the 2013 rate

Fewer jobs will be added in the coming year


Source:  SOB BEOF publications


The actual data for 2012 and preliminary data for 2013 are provided in the table below.


Performance of the Economy – US Real GDP and Colorado Employment

Year

Change in Real GDP

Change in State Employment


2012

The rate of growth of 2012 was significantly greater than the rate of growth for 2011

More jobs were added in 2012 than 2011


2013

The 2013 preliminary rate of growth was significantly lower than the rate of growth for 2012.

More jobs were added in 2013 than 2012


2014

To be determined

To be determined


Source: BLS, BEA, CBER


A historical look at the recoveries from the last three recessions is instructive.

After the 1991 recession, Colorado added jobs at an increasing rate for three years (1992 to 1994). This recovery was exceptionally strong. Job growth in 1994 was second highest in state history.

  •  Following the 2001 recession, Colorado “added” jobs at an increasing rate for four years (2003 to 2006). That rate of recovery for that period was anemic, but improving. Continued job growth at an increasing rate was cut short by the 2007 recession.
  •  After the 2007 recession, Colorado has “added” jobs at an increasing rate for four years (2010 to current). The rate of recovery has been so-so. In other words, there is a strong likelihood that job growth will continue at an increasing rate in 2014.

The saying “Every blind squirrel finds an acorn now and then” can be applied to the 2012-2014 SOB forecasts. If they continue to predict the state will add fewer jobs next year than this year, at some point they will be correct. Will 2014 finally be the year they are right?

We can only hope the SOB is wrong again!


©Copyright 2011 by CBER.