U.S. and Colorado Unemployment Rates Continue to Decline

Nationally, the unemployment rate has dropped below 6.0%, to 5.9% and the number of unemployed is now below 9.3 million. While this decline is a positive sign, the number of unemployed remains about 2.5 million above the low point in the second half of 2006.

The BLS tracks the unemployment rate in 22 occupations. Ten of those occupations have unemployment rates below the natural rate of unemployment (5.0%).

Most likely there is upward pressure on wages in these occupations at a national level, as well as in Colorado.

Occupation Unemployment Rate
Legal occupations 2.2%
Management occupations 2.3%
Architecture and engineering occupations 2.4%
Healthcare practitioner and technical occupations 2.4%
Business and financial operations occupations 2.7%
Computer and mathematical occupations 2.8%
Life, physical, and social science occupations 2.8%
Community and social service occupations 3.3%
Education, training, and library occupations, 3.3%
Installation, maintenance, and repair occupations 3.4%
Healthcare support occupations 4.9%

Of the above occupations, the ones most critical to Colorado are:
• Architecture and engineering occupations
• Healthcare practitioner and technical occupations
• Computer and mathematical occupations
• Healthcare support occupations

Although the U.S. unemployment rate is approaching the natural rate of unemployment (5.0%), there is limited upward pressure on wages across the nation. This is reflected in the National Association of Business Economists October Survey, which indicated that in Q3 2014, 24% of the respondent firms raised their wages and salaries, about half the percentage that raised their wages in Q2. If there was a potential for upwards wage pressures earlier in the year, those pressures have eased significantly.

The Colorado unemployment rate, 4.7%, and the number of unemployed, 131,348, continues to decline.

Even though the unemployment rate is near the natural rate of unemployment there appears to be minimal upward pressure on wages, except in a few categories of occupations such as specialized high -tech jobs, computer related occupations, and healthcare. In addition, wage pressures may be felt in geographic areas, such as Weld County, where the extractive industries are booming.

In 2009 the average annual wages for all occupations in Colorado, as measure by the QCEW data, was $46,861. By 2013, average annual wages had increased to $50,873, an annualized rate of growth of 2.1%.

Unfortunately, during that same period, the Consumer Price Index for the Denver-Boulder-Greeley area increased at an annualized rate of 2.6%. In other words pay increases did not keep up with increases in the cost of living. This year inflation is projected to increase at a higher rate than the gain in total wages.

On average, Colorado employment is 65,200 greater for the first 9 months of 2014 than the same period in 2013. That total will likely be revised upwards when the BLS benchmarks the CES data series in March 2015.

Looking ahead for the remainder of the year, the tourism; construction; health care; and professional, scientific, and technical services sectors will continue to be the primary sources of growth. Although, the extractive industries are small they are the source of greater indirect job growth and significant output growth.

Holiday Retail Sales will be Strong – Grinch to Visit Elsewhere

noGrinchnoThe outlook for holiday retail sales is upbeat. It is doubtful the Grinch will be visiting Colorado this Christmas season. Most likely he will be in parts of Europe, Japan, and Mexico where the economy is not as strong.

The National Retail Federation expects holiday sales to increase by 4.1% this November and December compared to a 3.1% increase last year. Over the past 10 years, average holiday growth has been about 2.9%. In other words, lower unemployment rates and an improved economy means retail trade sales this holiday season will be above average.

Sales in November and December (excluding autos, gasoline, and restaurant sales) represent about 19.2% of the annual total. Nationally, up to 800,000 workers will be hired on a seasonal basis for November and December.  Online sales will increase by 8% to 11%.

The optimistic expectations for national retail sales bode well for Colorado. The Colorado Legislative Council and the Office of State Planning and Budgeting expect Colorado’s 2014 annual retail sales to be 6.0% greater than last year. Given the strength of the state economy, holiday sales should easily exceed the national projected growth rate of 4.1% and may exceed the 6.0% projection for the year.

Colorado average retail trade employment in November and December is about 10,000 workers greater than the average for the other 10 months of the year. A similar increase in retail employment should be expected in 2014.

Over the past decade consumers have become accustomed to deep discounting during the holiday season. Despite an outlook for a brisk holiday season, there will likely be a sufficient number of markdowns and bargain basement deals. As the t-shirts on consumers in the local mall say, “Stay Calm and Shop On” or is it “Stay Calm and Shop Online.”

Happy shopping!

Colorado Outperforms U.S. in Real GDP Growth

Today the Bureau of Economic Analysis released its updated real GDP data by state for 2013. There were increases in 49 of the 50 states, with Alaska being the one state showing a decline.

In 2013 U.S. Real GDP growth expanded at a rate of 1.8%, compared to 2.5% in 2012. Private sector growth grew by 2.3% in 2013 compared to 3.0% in 2012.

In short, Colorado outperformed the U.S. in output growth last year. While the rate for the U.S. declined, real GDP growth for Colorado increased.

Nationally, the top six contributors to absolute growth were:

• Real estate and rental and leasing
• Agriculture, forestry, fishing, and hunting
• Health care and social assistance
• Finance and insurance
• Wholesale trade
• Professional, scientific, and technical services.

Combined, these 6 categories accounted for 53.6% of the change in U.S. output in 2013.

The Colorado Real GDP growth increased from 3.0% in 2012 to 3.8% in 2013. Real private sector growth expanded at a rate of 4.2% in 2013 compared to 3.4% in 2012.

In Colorado the leading contributors to absolute growth were:
• Mining
• Real estate and rental and leasing
• Professional, scientific, and technical services
• Agriculture, forestry, fishing, and hunting
• Construction
• Government.

Combined these six sectors accounted for 75% of the change in Colorado output in 2013.

There is a significant difference between the composition of the top contributors for the U.S. and Colorado. In part this helps explain why the Colorado economy has outperformed the U.S. economy over the past five years.

Note: There is a slight difference between the national GDP and the national GDP calculated as a summary by state outputs. Details are explained on the BEA website. Also, for methodological reasons, the contributions to absolute growth were calculated using the nominal GDP data.

Colorado’s Manufacturing Output Similar to Arizona, Kansas, and Utah

Manufacturing is important to the Colorado economy because it is a primary job creator – it brings in investment from outside the state, it creates jobs with higher than average wages, and the industry often has a deeper local supply chain than other industries. In 2012, the most current data available, Colorado manufacturing output totaled $19.99 billion and was 8.4% of private sector output (BEA).

Colorado is proud to have manufacturing competencies in some high-tech areas and food and beverage and state economic development officials have focused their support on the select sectors where they have strength or potential strength.

In 2012, Colorado was ranked 29th for total manufacturing output. States with similar levels of output include Arizona, Kansas, Utah, Maryland, and Oklahoma.


State Output (millions) Percent Cumulative Percent
California $213,257 11.4% 11.4%
Texas $210,968 11.3% 22.7%
Illinois $92,383 4.9% 27.7%
North Carolina $88,252 4.7% 32.4%
Ohio $87,174 4.7% 37.1%
Indiana $84,150 4.5% 41.6%
Pennsylvania $70,634 3.8% 45.4%
Michigan $66,230 3.5% 48.9%
New York $63,088 3.4% 52.3%
Oregon $55,158 3.0% 55.2%
Louisiana $55,097 3.0% 58.2%
Wisconsin $49,981 2.7% 60.9%
Georgia $48,599 2.6% 63.5%
Washington $46,507 2.5% 66.0%
Massachusetts $41,629 2.2% 68.2%
Tennessee $41,411 2.2% 70.4%
Minnesota $40,441 2.2% 72.6%
Virginia $40,116 2.1% 74.7%
New Jersey $38,199 2.0% 76.8%
Florida $37,023 2.0% 78.8%
Missouri $32,275 1.7% 80.5%
Alabama $30,001 1.6% 82.1%
Kentucky $29,746 1.6% 83.7%
South Carolina $28,708 1.5% 85.2%
Iowa $25,406 1.4% 86.6%
Connecticut $24,079 1.3% 87.9%
Arizona $21,934 1.2% 89.1%
Kansas $20,503 1.1% 90.2%
Colorado $19,992 1.1% 91.2%
Utah $19,184 1.0% 92.3%
Maryland $18,657 1.0% 93.3%
Oklahoma $17,497 0.9% 94.2%
Arkansas $15,604 0.8% 95.0%
Mississippi $15,254 0.8% 95.8%
Nebraska $12,484 0.7% 96.5%
New Hampshire $7,657 0.4% 96.9%
Idaho $7,556 0.4% 97.3%
West Virginia $6,223 0.3% 97.7%
New Mexico $5,805 0.3% 98.0%
Nevada $5,504 0.3% 98.3%
Maine $5,497 0.3% 98.6%
Delaware $4,393 0.2% 98.8%
South Dakota $4,008 0.2% 99.0%
Rhode Island $3,919 0.2% 99.2%
Vermont $3,150 0.2% 99.4%
North Dakota $3,037 0.2% 99.6%
Montana $2,860 0.2% 99.7%
Wyoming $2,269 0.1% 99.8%
Alaska $1,671 0.1% 99.9%
Hawaii $1,274 0.1% 100.0%
District of Columbia $256 0.0% 100.0%
Total $1,866,700 100.0%

Colorado Manufacturing Employment Stronger than U.S.

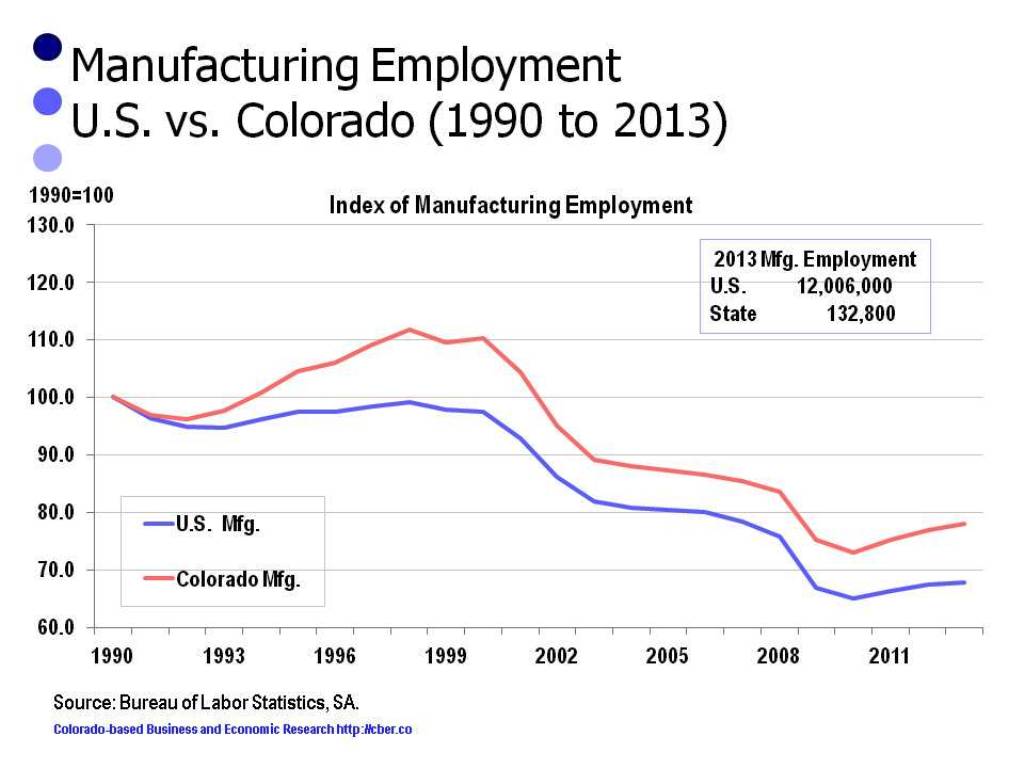
Since 1990 Colorado manufacturing employment has fared better than U.S. manufacturing employment. This has occurred in part because Colorado has grown off a much smaller base. Also the mix of companies in Colorado has not included some of the industries, such as textiles, that were hit hardest by outsourcing.

Colorado’s strength in manufacturing is beverages such as Coors/Miller and Budweiser. As well, the state has competencies in select high-tech sectors.

The bad news for Colorado is that the industry’s location quotient, or concentration, is well below 1.0 and trending downward.  In other words, Colorado has a lower concentration of manufacturers than the U.S.

U.S. vs. Colorado Manufacturing Employment
U.S. vs. Colorado Manufacturing Employment.


Strong Colorado Manufacturing Output is Essential to Growth of Colorado

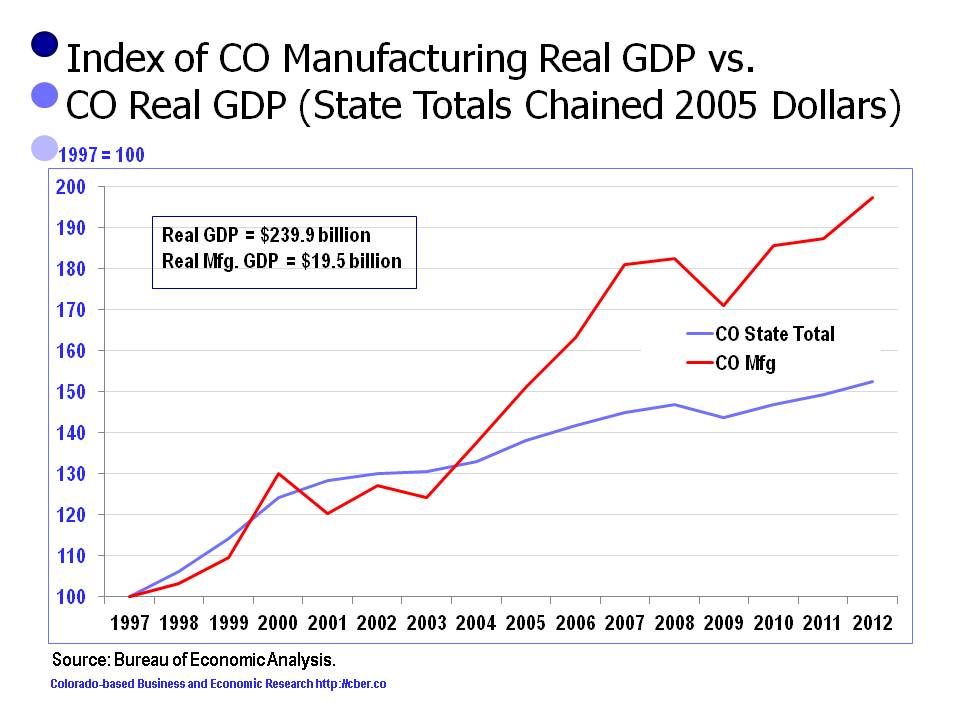
For the period 1997 to 2012, Colorado Real GDP expanded on a more consistent basis than the Colorado manufacturing output. In other words, overall output growth was less volatile.

However; manufacturing Real GDP grew at an annualized rate of 4.6% compared to 2.9% for Real GDP. The faster rate of growth for Colorado occurred, in part, because the manufacturing sector expanded off a much smaller base. Also, a portion of Colorado manufacturing is high value goods, such as electronics.

For this period, total employment increased as an annualized rate of 1.0% and manufacturing declined at an annualized rate of 2.3%. It is clear that gains in output were made as a result of capital expenditures, rather than investment in labor.

Note: At the time of this writing, the 2012 data was the most current data available.

Colorado Manufacturing Output
Growth of Colorado manufacturing output has outpaced growth of state output.


Colorado’s Concentration of Manufacturing is Lower than the U.S.

Colorado manufacturers produce coffee (Boyer’s Coffee) and beer (Coors). These types of products are classified as nondurable goods. Durable goods products include satellites (Ball Aerospace), air safety devices (Particle Measuring Systems), or ice making machines (Ice-O-Matic).

Many manufacturers create primary jobs – that is an economic development term. Many primary job creators pay higher than average wages. In addition, they attract outside investment to our local communities. In other words, their products are exported outside the state. As well, they often have higher “multiplier” effects. In non-economic terms that means they have a local supply chain.

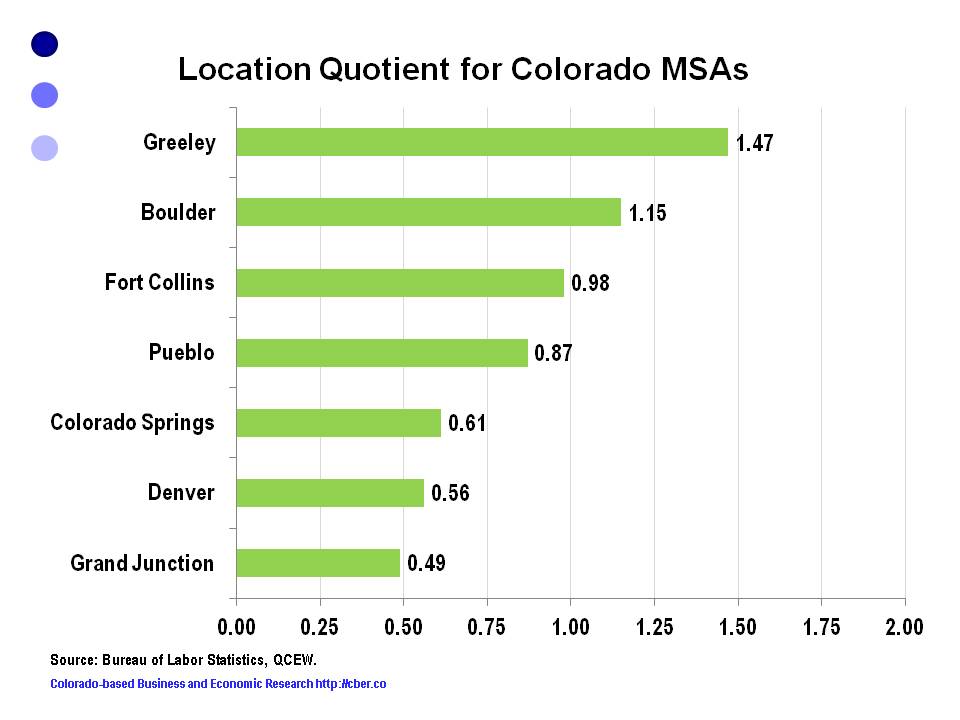
The concentration, or location quotient (LQ), for Colorado manufacturing was .65 in 2012 (calculated using the most recent QCEW data). In other words, Colorado has a much lower concentration of manufacturers than the U.S.

The majority of manufacturers are located in the Denver MSA; however, Northern Colorado and Boulder have the highest concentration of manufacturing employees.

Greeley and Boulder are the only MSAs with a concentration of manufacturing greater than 1.0.
Greeley and Boulder are the only MSAs with manufacturing location quotients greater than 1.0.

Colorado Remains on Track to Add at Least 71,000 Jobs in 2014

The state remains on track to add at least 71,000 jobs this year.

The BLS released their monthly employment report for Colorado earlier today. Rather than prepare a sector-by-sector analysis, the following comments evaluate the situation from 30,000 feet.

Colorado has had the perfect winter – snow in the mountains, but not so much that people couldn’t get to there to spend their money and ski. The state has had an excellent ski season which bodes well for hospitality industry employment. Good snow also means good rafting for the summer season.

A strong ski season also bodes well for the construction industry. Nationally, hotels and resorts had delayed repairs and expansions because of the recession. Upgrades and new construction that have been on hold are likely to occur in the months ahead.

A trip to DIA shows the importance of tourism to the state. Progress is being made on the Westin hotel located at the south end of the terminal. As well there are signs the light rail will soon be a reality. That will make it easier for travelers to connect to the metro area, which will further enhance Denver’s image as a place to hold conventions and conduct business.

It also appears the Gaylord project has cleared its latest set of hurdles and will begin construction soon. Shuttle drivers are anxiously telling their passengers where the project will be located.

The fact that Denver is on the short list for the Republican National Convention speaks to the increased reputation Denver is gaining as a place to host conventions. The fact that Colorado is a blue/purple state makes it an even more attractive destination. Wouldn’t the Republicans love to unseat the Democrats at a convention held in the Democrat’s backyard?

The snow and the cold of the winter season have not stymied construction along the Front Range. The state added over 10,000 construction jobs in 2013. Job growth has continued to be strong in 2014. Moving forward, the industry may be challenged to find sufficient workers, as unemployment in the industry has decreased substantially.

The construction industry will remain strong, with most of the growth coming from private sector investment. Despite improvement in tax revenues, the public sector is still not in a position to fund construction – such as schools or institutions.

Road construction has been held back by limited tax collections. One downside to improved fuel efficiency is less fuel is being consumed. The tax rates have not increased to support maintenance and repairs to our transportation infrastructure.

Residential construction will continue to improve, but will not approach the rates of growth that occurred prior to the Great Recession. For a variety of reasons, multifamily growth will remain strong. For example, young buyers prefer to live in the metro areas vs. the suburbs and many of them have high debt levels.

Obamacare enrollment has finally come to a close. For better or worse, the program is officially moving forward and healthcare organizations have greater clarity about how they can operate. They will be challenged by thin margins and will have to constantly be on top of their operations to remain profitable.

The industry continues to evolve rapidly. For example a focus for many organizations is bringing health care to local neighborhoods through urgent care and emergency facilities. The ACA will drastically impact the way healthcare organizations deliver services.

The oil and gas industry will continue to be extremely strong in Northern Colorado. In 2013 the state produced 64 million barrels of oil and about 80% was produced in Weld County. Colorado is one of the country’s top 10 states in terms of oil reserves. There are smaller counties that have enjoyed growth in oil production because of the Niobrara oil field, i.e. the industry is benefitting many parts of the state. Finally, the natural gas industry is strong on the western slope.

The state remains on track to add at least 71,000 jobs this year.


Colorado’s Natural Gas Production Declines in 2013

In 2013 Colorado’s Coal bed methane and natural gas production declined by 5.8%, from 1.7 billion Mcf to 1.6 billion Mcf. The 2013 level of production is similar to 2009. Twenty-six of Colorado’s 38 counties that produce gas posted declines last year.

Three counties account for 81.3% of total production: Garfield, La Plata and Weld.

In 1999 production in Garfield County was 56.9 million Mcf. It rose to 700.1 million Mcf in 2012, but dropped off to 649.3 million Mcf in 2013.

La Plata County has been a leader in production since 1999. In 2003 production peaked at 473.4 million Mcf and has declined gradually since. In 2013 it has fallen to 356.5 Mcf.

Weld County has experienced steady growth between 1999 and 2013, rising from 127.7 million Mcf to 271.8 million Mcf.  Unlike Weld and La Plata counties, Weld County showed solid growth in 2013.

The combined total of the other 35 counties has grown gradually from 1999 to 2013, from 145.1 million Mcf in 1999 to 355.3 Mcf in 2013.

Colorado has 26 counties where there is no gas production.

Natural gas production remains strong in Colorado
Despite the decline in 2013, natural gas production remains strong.


©Copyright 2011 by CBER.

Can You Say Boom in Oil Production for Weld County?

When you mention Greeley, Colorado some people think of the smell of money (the feedlots), others think of the Greeley Stampede, and some are reminded of their days in college at the University of Northern Colorado.

More recently, Greeley has gained notoriety as the leader of the state’s boom in oil production. In 2013 Weld County accounted for 81% of production for the state.

Between 2008 and 2013 oil production has almost tripled in Weld County, increasing from 17.6 million barrels to 51.9 million barrels. For this six year period, production at the state level more than doubled, rising from 29.6 million barrels to 64.1 million barrels.

Between 1999 and 2013 the total oil production for Rio Blanco and Garfield County was unchanged at 6.8 million barrels; however, production in this area was volatile during that period. In 2013 the combined total production of these two counties was the second largest for the state.

Between 1999 and 2013 oil production in the other 33 counties declined from 6.4 million barrels to 5.3 million barrels. Within this period, these 33 counties experienced significant volatility. Production increased in 14 counties, but decreased in 19.

Colorado has 28 counties where there is no oil production.

Boom in Oil Production for Weld County
Colorado Oil Production By Top Counties. Growth led by Weld County


©Copyright 2011 by CBER.