Colorado New Vehicle Registrations Trend Upward

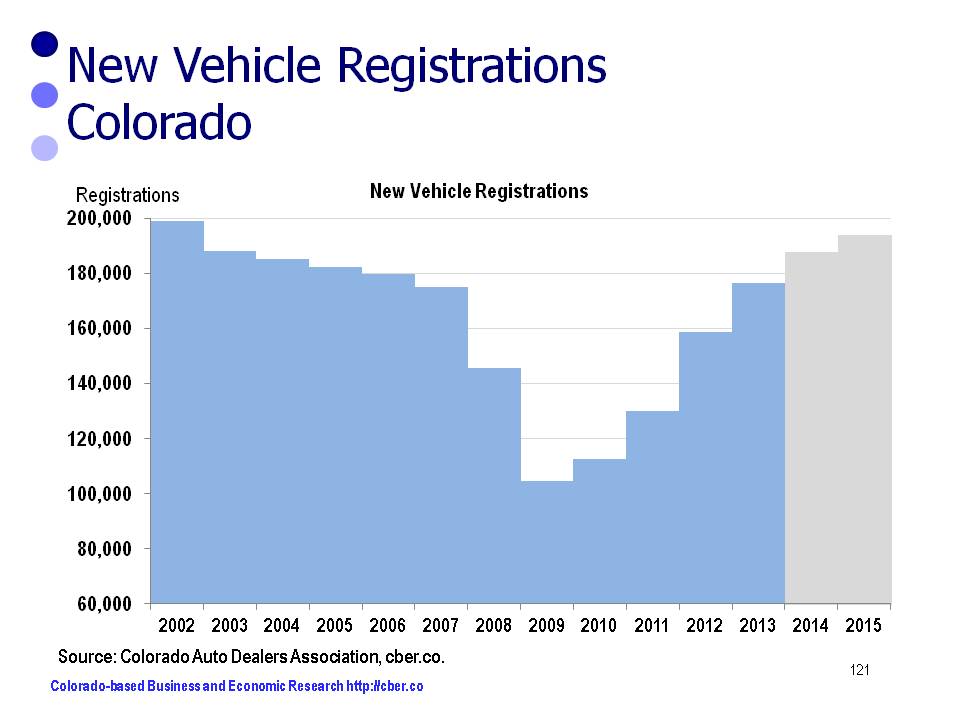
One of many signs of a solid Colorado economy is the growth in the number of new vehicle registrations. Increased registrations are usually a function of a growing population and solid job growth.

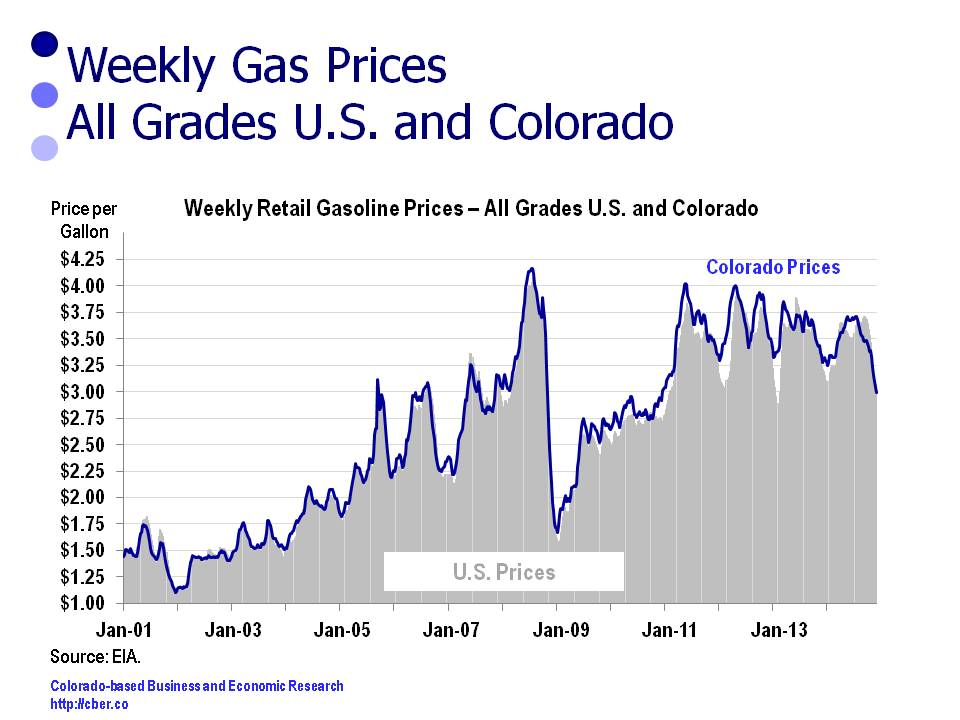
New registrations are also stimulated by low interest rates and higher consumer confidence. As well, lower gas prices may fuel the sales of models that have lower gas mileage, such as large pickups or four-wheel drive vehicles.

The number of new vehicle registrations in Colorado decreased from 198,910 in 2002 to 104,687 in 2009. Even though there was a steady increase in the state population, back-to-back recessions caused the sharp decline in registrations.

A solid recovery began in 2010 followed by double digit growth in 2011, 2012, and 2013. In 2013 there were 176,433 new vehicle registrations.

The estimated rate of growth will slow to 6.5% in2014 with 187,901 registrations. In 2015 there will be a 3.2% growth rate to 194,000 registrations. The “slowdown” in the rate of growth will occur as sales will increase at a more sustainable rate. In addition, uncertainty in the extractive industries will cause some consumers to be more cautious.

new vehicle registrations

Colorado Economy Remains on Solid Footing

The most recent data release by the Bureau of Labor Statistics showed the Colorado economy remains on solid footing.

The unemployment rate dropped from 6.2% a year ago to 4.0% this year. That sharp of a drop produces significant shock within the system, more so than when the change is more gradual.

With that sharp of decline, it becomes difficult to find workers in some occupations. That difficulty will be accentuated by a sense of urgency to find workers. As well, more industries will face upward wage pressures. That is good for workers, but will cut into the bottom line of companies.

The recent jobs data is another indicator the Colorado economy is continuing to grow at a steady pace. For all practical purposes, it is meaningless to talk about the December numbers. When BLS makes their annual revisions in March, it is likely the number of Colorado jobs will be revised upwards.

The U.S. economy is solid which bodes well for Colorado. New car sales have returned to pre-recession levels, real GDP will be stronger this year both globally and for the U.S., the U.S. should add more than 2.6 million jobs this year (and Colorado should be at least 2.7% of that total), government spending will be stronger, and purchasing managers in manufacturing and service companies are optimistic.

In Colorado, BLS data will show that the number of establishments increased at a greater rate than in 2013. If there are more businesses there are more potential job opportunities for workers.

In 2015 about 60% of job growth will be in construction; health care; accommodations and food services; retail trade; and professional and technical services.

Admittedly, the price of oil will have an effect on the rate of job growth in 2015; however, at a statewide level, most of the top sectors will show steady growth unless the price of oil stays low for an extended period.

The steady growth that is currently occurring in the Colorado economy is much easier to manage and deal with than the rapid growth the state experienced during the 1990s.

Colorado Employment to Continue at Steady Pace in 2015

Later this week, cber.co will release its Colorado economic forecast for 2015. The primary focus of the Colorado forecast is employment within the state. As economic developers say, “it all starts with a job.”

Each year the forecast provides an optimistic, pessimistic, and most likely scenario.

The 2015 optimistic scenario calls for:
• U.S. Real GDP growth will be greater than 2.9%.
• Colorado will add more than 76,000 workers.

The projected likelihood of this scenario is 15%. The Colorado economy has experienced solid job growth since 2012; however, there is nothing to believe that it will experience growth at a significantly greater rate during 2015.

The pessimistic scenario calls for:
• U.S. Real GDP growth will be less than 2.5%.
• Less that 70,000 Colorado workers.

Unfortunately, there is more downside risk to the forecast than upside risk. The projected likelihood of this scenario is 30%. While the global and U.S. economies are expected to see slight growth in output, the Colorado economy could be derailed if the price of oil remains below $65 per barrel (the estimated breakeven point for the Niobrara Oil field) for an extended period.

The most likely scenario calls for:
• U.S. Real GDP will be 2.5% to 2.9%.
• The U.S. will add at least 2.6 million workers.
• Colorado will add 3.0% of total U.S. jobs added.
• Colorado will add 70,000 to 76,000 workers, job growth will be 2.8% to 3.0%.

Despite downside risks associated with lower prices for oil and reduction production in Colorado there is a 55% likelihood this forecast will occur. Since 2012 growth has been steady and broad-based. Much of the growth has been in sectors such as tourism, which have an indirect link to the extractive industries.

Average Colorado employment will be 2,525,600 for 2015.

For additional information about the 2015 cber.co Colorado Economic Forecast click here.

Mining and Real Estate – Drivers of the Colorado Economy

Thank goodness for the  mining and real estate industries! From an output perspective these industries are the primary drivers of the Colorado economy.

In 2013, Colorado’s nominal GDP was $294.4 billion (most current data available). The state’s economy expanded by $157.1 billion between 1997 and 2013 (1997 is the first year that data was available). Between 2009 and 2013 the GDP expanded by $46.3 billion.

The Great Recession had a major impact on the way the economy expanded. This is evident when comparing the contribution to output for the periods 1997 to 2013 and 2009 to 2013.

Between 1997 and 2013 the contribution to GDP was broken down as follows:
• Goods Producing 20.5%
• Service Producing 68.6%
• Private sector (Goods + Services) 89.0%
• Government 11.0%

Between 1997 and 2013 the annualized rate of growth for the GDP follows:
• Total 4.9%
• Private 5.0%
• Government 4.1%

Between 2009 and 2013 the contribution to GDP was broken down as follows:
• Goods Producing 28.0%
• Service Producing 65.5%
• Private sector (Goods + Service) 93.6%
• Government 6.4%

Between 2009 and 2013 the annualized rate of growth for the GDP follows:
• Total 4.4%
• Private 4.7%
• Government 2.2%

Thank goodness for the Goods Producing Sectors (Agriculture, Mining, Construction, and Manufacturing)!

Industry 2013 GDP (millions) 2013 minus 1997 % of Total 2013 minus 2009 % of Total
All industry total $294,443 $157,072 $46,266
Private industries $258,217 $139,860 89.0% $43,287 93.6%
Goods Producing $57,447 $32,144 20.5% $12,964 28.0%
Service Producing $200,771 $107,718 68.6% $30,325 65.5%
Government $36,226 $17,212 11.0% $2,979 6.4%

The following two tables provide more detail by industry.

The following table shows more detail by industry sector. It is sorted in descending order by the column 2013 minus 1997.

Industry 2013 GDP (millions) 2013 minus 1997 % of Total 2013 minus 2009 % of Total
Real estate and rental and leasing $40,194 $21,355 13.6% $6,895 14.9%
Mining $19,848 $17,964 11.4% $8,518 18.4%
Government $36,226 $17,212 11.0% $2,979 6.4%
Professional, scientific, and technical services $26,355 $16,084 10.2% $4,233 9.1%
Information $21,578 $12,019 7.7% $1,407 3.0%
Health care and social assistance $17,438 $10,503 6.7% $2,262 4.9%
Wholesale trade $15,915 $7,818 5.0% $2,606 5.6%
Retail trade $16,105 $6,926 4.4% $1,965 4.2%
Manufacturing $21,600 $6,657 4.2% $2,171 4.7%
Finance and insurance $14,480 $6,067 3.9% $2,436 5.3%
Accommodation and food services $9,409 $5,255 3.3% $1,769 3.8%
Management of companies and enterprises $6,207 $5,106 3.3% $1,550 3.4%
Construction $11,820 $4,861 3.1% $208 0.4%
Administrative and waste management $8,653 $4,308 2.7% $1,090 2.4%
Transportation and warehousing $7,984 $4,094 2.6% $1,598 3.5%
Other services $6,549 $2,784 1.8% $605 1.3%
Agriculture, forestry, fishing, and hunting $4,179 $2,662 1.7% $2,067 4.5%
Arts, entertainment, and recreation $3,848 $2,029 1.3% $890 1.9%
Utilities $3,798 $1,782 1.1% $646 1.4%
Educational services $2,258 $1,588 1.0% $373 0.8%

The following table shows more detail by industry sector. It is sorted in descending order by the column 2013 minus 2009.

Industry 2013 GDP (millions) 2013 minus 1997 % of Total 2013 minus 2009 % of Total
Mining $19,848 $17,964 11.4% $8,518 18.4%
Real estate and rental and leasing $40,194 $21,355 13.6% $6,895 14.9%
Professional, scientific, and technical services $26,355 $16,084 10.2% $4,233 9.1%
Government $36,226 $17,212 11.0% $2,979 6.4%
Wholesale trade $15,915 $7,818 5.0% $2,606 5.6%
Finance and insurance $14,480 $6,067 3.9% $2,436 5.3%
Health care and social assistance $17,438 $10,503 6.7% $2,262 4.9%
Manufacturing $21,600 $6,657 4.2% $2,171 4.7%
Agriculture, forestry, fishing, and hunting $4,179 $2,662 1.7% $2,067 4.5%
Retail trade $16,105 $6,926 4.4% $1,965 4.2%
Accommodation and food services $9,409 $5,255 3.3% $1,769 3.8%
Transportation and warehousing $7,984 $4,094 2.6% $1,598 3.5%
Management of companies and enterprises $6,207 $5,106 3.3% $1,550 3.4%
Information $21,578 $12,019 7.7% $1,407 3.0%
Administrative and waste management $8,653 $4,308 2.7% $1,090 2.4%
Arts, entertainment, and recreation $3,848 $2,029 1.3% $890 1.9%
Utilities $3,798 $1,782 1.1% $646 1.4%
Other services $6,549 $2,784 1.8% $605 1.3%
Educational services $2,258 $1,588 1.0% $373 0.8%
Construction $11,820 $4,861 3.1% $208 0.4%


Colorado Economic Forecasts Point to Growth in 2015

It is the forecast season and three Colorado economic forecasts are on the streets.

First, the Governor’s Office of State Budgeting and Planning and the Colorado Legislative Council released their2015 Colorado economic forecasts.

Their forecasts are used for policy and budgetary purposes and at times tend to err on the conservative side. (That comment is intended to serve as a reference point, and is not meant as a criticism). The March forecast is often a more accurate reflection of what will happen during the year.

The good news is that both groups are realistically optimistic about the state’s outlook.

OSPB projects U.S. Real GDP growth of 2.7% with state job growth of 68,300. CLC is slightly more optimistic. They project U.S. Real GDP growth of 3.1% and state job growth of 73,600.

The quarterly reports produced by OSPB and CLC are recommended reading for anyone interested in the state economy. They discuss the economy for all regions of the state, key industries, and factors that impact the budget for the state government.

Finally, Richard Wobbekind recently unveiled the CU Leeds School Colorado economic forecast earlier in the month.  As usual it was a rewrite of the past four years. He expects the U.S. to see significantly stronger U.S. output growth. At the same time he focuses on Colorado being one of the leading states for job growth, yet he states that Colorado will add jobs at a decreasing rate in 2015 after modest growth in 2014. CU is projecting Real GDP growth of 3.1% and state job growth of 61,300 in 2015. Those numbers just don’t make sense.

Between now and next year, Wobbekind and the CU gang should read the paper “Macroeconomic forecasts and microeconomic forecasters”. Author Owen Lamont raises the question, “Does an experienced research team, with a wealth of knowledge, produce a more accurate forecast or does the added knowledge result in an “arrogance” which may reduce the accuracy of the forecast? The state would benefit from CU producing a Colorado economic forecast based on academic rigor rather than self-promotion.

The good news is that this part of the forecast season has passed and all projections point to continued modest growth in 2015. Bring on the new year!


Lower Gasoline Prices Have Minimal Impact

Since the second quarter of 2012, the price of gasoline has slowly declined in the U.S. and Colorado.

At this point, the impact in total gasoline prices for the year is primarily psychological even though prices have dropped below $3.00 per gallon in some locations. The difference in total prices paid for 2014 compared to last year are negligible.

The Good News – At some point lower gas prices may increase discretionary income for consumers. At the moment that is not likely because inflation has driven other costs higher, especially housing costs.

The Not So Good News – Typically, the impact of lower oil and gasoline prices on the state is negative. In other words, consumers will benefit; however, state coffers will not be as full because tax collections will be lower.
gasoline prices


Colorado’s Employment Situation After Ten Months

After ten months, enough of the year has passed that Colorado’s employment situation for 2014 is virtually set. This post looks at overall and regional job growth, drivers of the regional economies, and industries that dominate state job growth.

Job Growth (Overall)
After BLS makes their March 2015 revisions the wage and salary employment will show that Colorado added at least 70,000 jobs this year. That is job growth of at least 2.9%.

Job Growth (Regional)
About 81% of Colorado’s job growth occurs in Colorado’s seven metro areas (listed below). The industry composition and the economies in these seven metro areas are distinct. As a result they have grown at different rates.

The estimated rates of job growth through ten months are:
• Greeley 5.0%
• Boulder 3.1%
• Fort Collins 2.8%
• Denver 2.8%
• Pueblo 1.8%
• Grand Junction 0.9%
• Colorado Springs 0.8%

During this period the percentage of job growth in the MSAs was:
• Denver added 67.4% of the MSA jobs.
• Boulder added 10.0%.
• Combined, the Northern Colorado MSAs added 16.0% of all jobs (Greeley 8.5% and Fort Collins 7.5%).
• Colorado Springs added 3.6% of the MSA jobs.
• Pueblo added 2.1%.
• Grand Junction added almost 1%.

Drivers of Regional Economies
The economies of Colorado’s seven metro areas are very distinct as evidenced by the industries driving their economy.
• Greeley has been driven by the extractive industries and Vestas.
• Fort Collins has been driven by the high-tech industry, CSU, and spillover from the extractive industries.
• Boulder has posted gains as a result of the high-tech industry, and CU employment.
• Denver’s economy is more balanced than the smaller economies. Interestingly enough, it has grown at a slower rate in 2014 than 2013.
• Pueblo has benefitted from Vestas.
• Grand Junction has struggled to recover from the most recent “oil shale bust”.
• Colorado Springs is still feeling the pain from the exit of Intel. In addition, the wildfires during the summers of 2012 and 2013 played havoc with the economy. The local economy is very dependent on the military and defense funding for local businesses. These industries are typically more volatile than the overall economy.

Industries Dominating State Job Growth
• Throughout 2014, job growth across the state has been led by the following  sectors
o Accommodations and Food Services (AFS)
o Health Care
o Professional, Scientific, and Technical Services (PST)
o Construction
o Retail
These five sectors account for about 71% of total job growth in the state.

Colorado’s Diversity of Job Growth

cber.co tracks changes in employment for 23 sectors of the Colorado economy. Part of that tracking includes a two-step process for measuring Colorado’s diversity of job growth.

The first step is to identify the number of sectors that are adding jobs. For the last three years the data shows:
• In 2012 19 sectors added jobs
• In 2013 19 sectors added jobs
• In 2014 18 sectors will add jobs (estimate).

As a point of reference, a comparison can be made to the following years:
• In 1993 22 sectors added jobs
• In 1998 22 sectors added jobs
• In 2002 13 sectors added jobs
• in 2003 10 sectors added jobs
• in 2009 8 sectors added jobs
• In 2010 10 sectors added jobs.
This shows that during the best of times, some sectors lose jobs. As well, it illustrates that during the worst of times, there are sectors adding jobs.

Another way to look at the data is to calculate the percent of employment in sectors where jobs are being added. For the last three years the data shows:
• In 2012 the sectors that added jobs had 88.5% of total employment.
• In 2013 the sectors that added jobs had 89.2% of total employment.
• In 2014 the sectors that added jobs had 85.4% of total employment (estimate).
The 2014 percentage might increase when the BLS revises 2014 data in March 2015.

As a point of reference, a comparison can be made to the following years:
• In 1993 the sectors that added jobs had 99.1% of total employment.
• In 1998 the sectors that added jobs had 99.6% of total employment.
• In 2002 the sectors that added jobs had 49.4% of total employment.
• In 2003 the sectors that added jobs had 36.7% of total employment.
• In 2009 the sectors that added jobs had 27.3% of total employment.
• In 2010 the sectors that added jobs had 33.2% of total employment.

The data shows that since 2012 Colorado’s job growth has been diverse and solid.

diversity of job growth


Measures of the Colorado Unemployment Rate

The Bureau of Labor Statistics compiles several measures of the Colorado unemployment rate. Each measure and its descriptions are listed below.  In each case, the  percentage has declined over the past year. The U-3 number is the headline number; however, many people think U-6 is more representative of the state of the economy because its definition is more inclusive.

Measures  of the Colorado Unemployment Rate Sept. 2013 Sept. 2014
U-1 Persons unemployed 15 weeks or longer, as a percent of the civilian labor force. 3.80%  2.80%
U-2 Job losers and persons who completed temporary jobs, as a percent of the civilian labor force. 3.70% 2.90%
U-3 Total unemployed, as a percent of the civilian labor force (headline unemployment rate). 7.20% 5.90%
U-4 Total unemployed plus discouraged workers, as a percent of the civilian labor force plus discouraged workers. 7.70% 6.40%
U-5 Total unemployed, plus discouraged workers, plus all other persons marginally attached to the labor force, as a percent of the civilian labor force plus all persons marginally attached to the labor force. 8.60% 7.30%
U-6 Total unemployed, plus all persons marginally attached to the labor force, plus total employed part-time for economic reasons, as a percent of the civilian labor force plus all persons marginally attached to the labor force. 13.60% 11.80%


Establishment Growth Tops in Broomfield, Denver, and Douglas County

Since the end of the recession establishment growth occurred fastest in the following counties: Broomfield, Denver, and Douglas.

The Quarterly Census of Employment and Wages (QCEW) data provides trends for the creation of establishments by county. To be included in the QCEW database, establishments must have at least one employee.

Between 2002 and 2013 the number of Colorado establishments increased at an annualized rate of 1.0%. Between 2009 and 2013 the number of Colorado establishments changed at an annualized rate of -0.1%.

Year Establishments
2002 153,830
2003 156,986
2004 160,104
2005 166,540
2006 171,682
2007 175,442
2008 175,410
2009 171,729
2010 168,176
2011 166,537
2012 168,824
2013 171,249

For the period 2002 to 2013, the number of establishments in Broomfield, Douglas, and Weld County grew at the fastest rate, while the number of establishments in Arapahoe, Jefferson, and Pueblo changed at the lowest rates.

Year County
County/State 2002 vs. 2013
Broomfield 5.1%
Douglas 4.2%
Weld 2.0%
Larimer 1.4%
Boulder 1.2%
El Paso 1.1%
COLORADO 1.0%
Denver 1.0%
Adams 0.7%
Arapahoe 0.4%
Jefferson 0.2%
Pueblo -0.5%

For the period 2009 to 2013, the number of establishments in Broomfield, Denver, and Douglas County grew at the fastest rate, while the number of establishments in El Paso, Jefferson, and Pueblo changed at the lowest rates.

County/State 2009 vs. 2013
Broomfield 2.5%
Denver 1.5%
Douglas 1.4%
Boulder 0.9%
Larimer 0.3%
Arapahoe 0.1%
Weld 0.1%
COLORADO -0.1%
Adams -0.2%
El Paso -0.2%
Jefferson -0.5%
Pueblo -1.9%

It is interesting to note that Boulder County, often regarded as the hotbed of entrepreneurship, was not at the top of the list for the percentage of establishments added.