2021 Colorado Economic Forecast

The following forecast is from the 2021 cber.co Economic Forecast for the United States and Colorado.

Colorado’s real GDP growth rate for 2021 will be slightly higher than the U.S. rate It will return to its pre-pandemic value in late 2021.

Colorado employment posted declines in Q4 2020. The negative trend will continue in Q1 2021. Employment will return to its 2019 level in 2022.

Colorado’s unemployment rate will be greater than most states because unemployment claims will remain high.

Retail sales will rebound in 2021 as a result of pent-up demand. Sales will level off at pre-pandemic levels in 2022.

In 2021 and 2022, inflation will be slightly higher than the U.S. rate.

This image has an empty alt attribute; its file name is image-1.png

The number of passengers through DIA in 2020 was about half of the 2019 total. Domestic flights will return to their 2019 level in 2023. International flights will return to their pre-pandemic level in 2024.

There was an increase in the number of building permits issued in 2020. There will be more permits in 2021 as the population increases. Also, there is a need for affordable housing in the metro areas.

State regulations and reduced demand caused a decline in oil production in 2020. The production of oil will be flat in 2021 and 2022.

COVID-19 cases per 100,000 – U.S. vs Colorado

The Opportunity Insights project is tracking the recovery of the U.S. economy from COVID-19-19. The following data is through January 12, 2021.

There were 44.4 COVID-19 cases per 100,000 in Colorado and 75.9 cases per 100,000.

The Colorado rate is trending down while the U.S. rate is trending up. The light grey lines in the background represent other states. The rate for Colorado is appears to be lower than most states.

Colorado has paid a steep price economically for having lower COVID-19 rates per 100,000. The state was ranked 48th in December for the worst unemployment rate in the nation.

States with the lowest rates (per 100,000 people) include Hawaii, 13.8, and Vermont, 25.2 States with the highest rates include Arizona, 130.0, and California, 110.0.

COVID-19 Colorado vs. U.S.

The 2018 Colorado Economic Forecast – Call it Steady

The best description of the 2018 Colorado economic forecast is steady.

After adding jobs at a rate of 2.2% in both 2016 and 2017, Colorado will add jobs at a rate of 2.0% in 2018. Given all the moving pieces in an economy, that is steady!

Watch for the following on Colorado’s economic front in the coming months.

  • Colorado will benefit from stable global and U.S. real GDP growth.
    Net migration will be comparable to the last two years.
  • The Colorado inflation rate will increase; it will be about a point greater than the U.S. rate.
  • The Colorado economy is not operating efficiently because the unemployment rate is too low.
  • The Colorado real GDP growth rate will be greater than the U.S. rate and will be driven by health care, real estate, and the extractive industries.
  • The state’s economic growth would be slowed if the Fed Funds rate is increased 3 times in 2018.
  • Manufacturing growth will be driven by a handful of larger companies.
  • Retail trade is evolving. Retail sales will remain strong. 
  • The 2018 legislative session will be dicey as legislators struggle to address social issues, congestion, transportation issues, the state pension fund, and how much funding should be allocated to education.
  • The state’s information sector is quietly evolving; there will be minimal job growth, but high value added.
  • The growth of the state will be constrained by the lack of workers to complete construction projects.
  • There are three economies in Colorado – Front Range, micropolitan areas such as Durango, and rural Colorado. It is an understatement to say that many rural counties are significantly challenged.
  • Amazing things are happening at DIA and the area surrounding it – Welcome Gaylord!
  • The lack of snow in December and early January has left its mark on the state’s ski areas. It would be worse if they had not invested in snowmaking.

There will be ups and downs, but 2018 will be a good year! It will be steady!

For more details about the Colorado economy check out the  cber.co 2018 Colorado economic forecast on this website.

Colorado 2015 Job Growth – 9th Best Year In History of State

This past week, the Bureau of Labor Statistics (BLS) announced that Colorado job growth for 2014 was revised upwards to 83,000 and 2015 job growth was bumped up to 76,300. The respective rates of Colorado job growth were 3.5% in 2014 and 3.1% in 2015.

The upward benchmark revisions made 2014 the third strongest year of absolute job growth while 2015 was the ninth strongest year. This is the best news for the state since the Broncos won the Super Bowl on February 7th.

During 2014 the BLS monthly estimates reported the Colorado economy was adding jobs at a declining rate. This past year, BLS showed that Colorado was adding jobs at an even faster declining rate than in 2014. Thank goodness the BLS projection models were grossly flawed. the benchmark revisions match the activity that has taken place on the streets for the past two years.

In 2015 the five largest sectors/subsectors were:
• Health Care
• Retail
• Accommodations and Food Services
• Professional, Scientific and Technical Services
• Financial Activities
These five industries accounted for 45.8% of total employment. Total employment for 2015 was 2,541,200.

In 2015, the five largest sectors/subsectors for the number of jobs added were:
• Health Care
• Construction
• Accommodations and Food Services
• Professional, Scientific and Technical Services
• Retail
These five industries accounted for 60% of the jobs added. The job growth for these five industries combined was 4.1% in 2015.

Job growth in 2016 will be solid, but slightly off the pace of 2015. Growth will be slowed by low oil prices, the slow economy in China, and a strong dollar abroad.

For more details check out the review of Colorado 2015 job growth by clicking here. And there is much more. For more details check out the cber.co Colorado Economic 2016 Forecast.

2015 job growth

Colorado New Car Registrations Top Record in 2015

Colorado auto dealers had a banner year in 2015 reaching a record 203,471 new car registrations. This topped the previous high of 198,910 in 2002. Auto sales were driven by low gasoline prices, easy access to credit and low interest rates. In addition, Colorado experienced strong net migration and solid employment growth in 2015.

After peaking in 2002, the number of new registrations gradually tapered off until 2007. At that point they plummeted to 104,687 in 2009.

The number of new car registrations has almost doubled between 2009 and 2015.

Colorado New Car Registrations

About 35% of the 2015 new registrations were light trucks and 65% were autos. Light truck new registrations increased by 15.3% compared to only 3.5% for cars.

Category 2014 2015 % Change
Total 188,416 203,471 8.0%
Cars 73,112 70,561 3.5%
Light Trucks 115,304 "132 910" 15.3%

Almost 45% of the 2015 new registrations were for Japanese brands and 39% were for the top three Detriot brands. Slightly more than 10% were European brands and the remaining 6% were Korean brands.

The new registrations for Detroit and European brands increased by almost 10%, while the Japanese brands increased by slightly more than 7.4%. There was a decline in the number of new registrations for the Korean Brands.

Category 2014 2015 % Change
Detroit Three Brands 71,962 79,113 9.9%
European Brands 19,450 21,293 9.5%
Japanese Brands 84,896 91,154 7.4%
Korean Brands 12,108 11,911 -1.6%

The vehicle segments with the largest gains in market share, 2015 vs. 2014, were compact and compact luxury SUVs. The largest losers were standard mid-size cars and sub-compact cars.

Winners – 2015 vs. 2014

Category Change in Market Share (points)
Compact SUV 1.4
Compact luxury SUV 0.9
Compact pickup 0.8
Full size pickup 0.7
Full size crossover SUV 0.4
Full size van 0.2
Full size luxury SUV 0.1
Mid-size crossover SUV 0.1
Minivan 0.1

Losers – 2015 vs. 2014

Category Change in Market Share (points)
Sub-compact car -1.5%
Standard mid-sized care -1.5%
Entry car -0.7%
Large mid-size car -0.3%
Luxury car -0.3%
Mid-sized luxury SUV -0.2%
Sport-compact car -0.1%

The categories where there was no change in leadership were:
• Near luxury car
• Full-size SUV
• Mid-size SUV
• Sports car

If the economy stays healthy, car sales will likely show record growth in new car registrations again in 2016.

The source for the data in this post is the Colorado Auto Dealers Association.

December Nonfarm Jobs Data for Colorado – Lackluster Growth

Today, BLS released December unemployment and employment data for Colorado. The seasonally adjusted unemployment rate for the state dropped to 3.5%. This is significantly lower than the U.S. rate of 5.0%.

Workers will benefit from lower unemployment rates, but lower rates are generally bad for businesses. In many cases companies are not able to fill critical positions. In turn they are forced to hire unqualified workers, pay overtime, or leave money on the table.

Nationally, 25 states posted declines in their December unemployment rates compared to November. There were increases in 14 states and no change in the rates for 11 states and the District of Columbia.

BLS reported lackluster nonfarm job growth in Colorado in December. This level of growth is in line with the pattern for U.S. seasonally adjusted nonfarm job growth. On a seasonally adjusted basis there were 10,700 more workers in December than November.

To that point, there was strong growth across the country. Nonfarm payroll employment increased in 36 states and the District of Columbia and it decreased in 14 states.

Looking at U.S. job growth on a quarterly basis there was weak employment growth in Q3, but strong growth in Q4. Given this trend nationally, it stands to reason that Colorado is following that same pattern. The data is in line with the level of activity on the streets.

The data indicates that Colorado added about 20,000 jobs in Q4, after no job growth in Q3.

On March 14th BLS will release its employment benchmark data for 2015. That data will more accurately tell the story of 2015 nonfarm job growth in Colorado.

nonfarm job growth


cber.co Colorado Economic Forecast – Diverse Growth

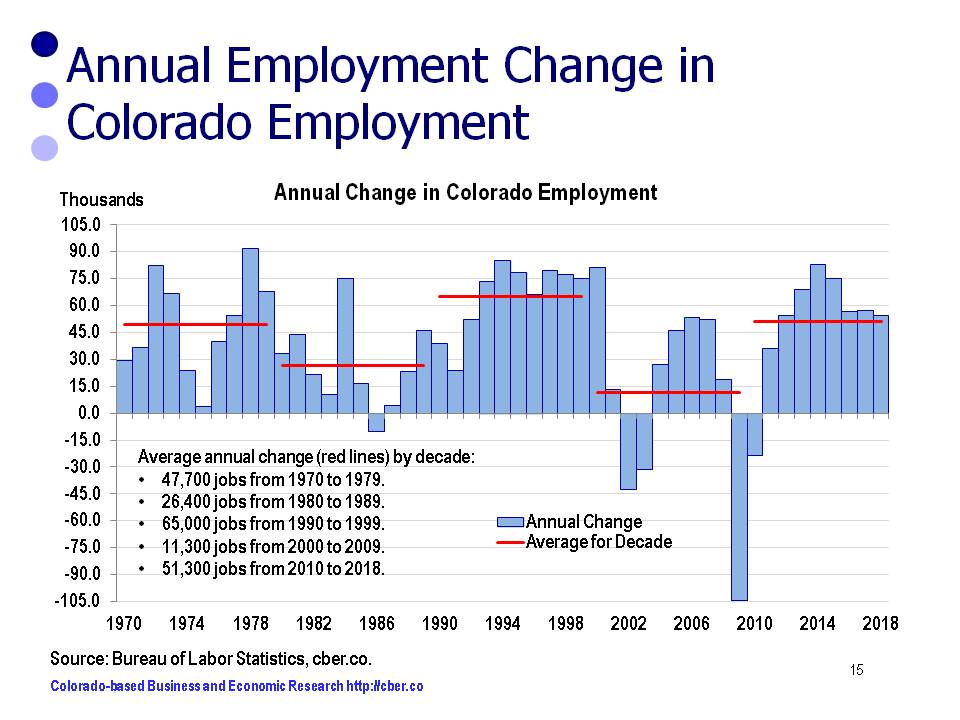
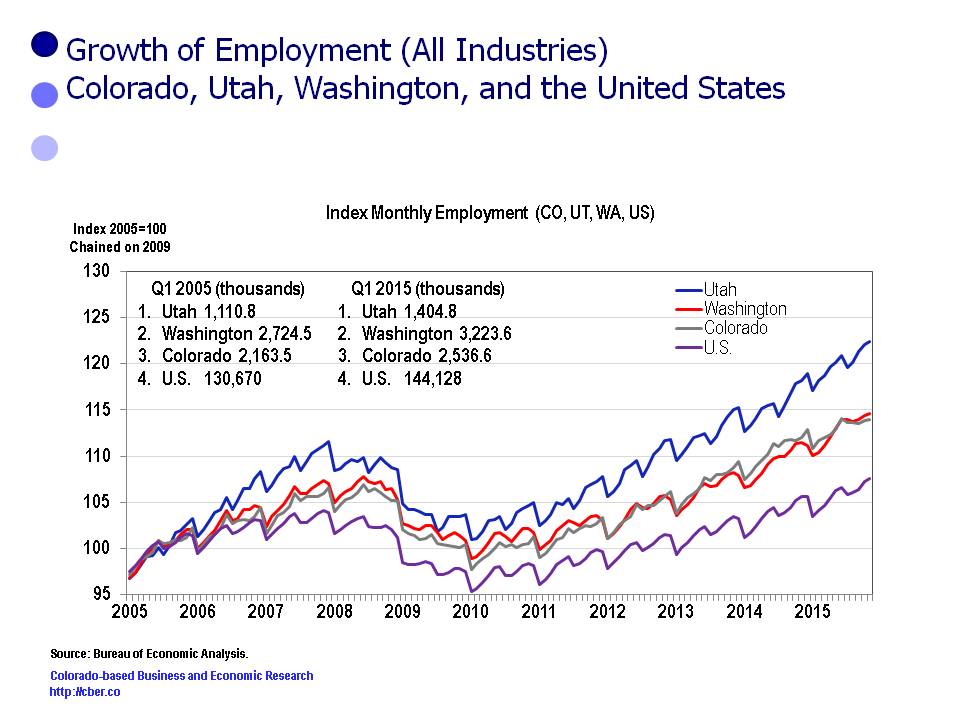
The primary focus of most state economic forecasts is to project total state employment.

Over the years cber.co has worked on various Colorado economic forecasts – some were multi-year projections, others were one-year annual totals, and some projected sector totals that were added to derive the state total. The latter approach introduced numerous variables for error.

cber.co feels the most accurate forecast is achieved by projecting total employment based on projections for three categories of sectors. Sectors are grouped into three categories based on their past performance.

Projections for the categories and overall employment are based on trends, feedback from business leaders, economic developers, and other economists. The sum of these categories is then used to estimate overall total employment.

Minor adjustments are made and final forecasts are produced for three scenarios. The most likely scenario is used as the final cber.co forecast. This final step helps create a better understanding of upside and downside risk associated with the forecast.

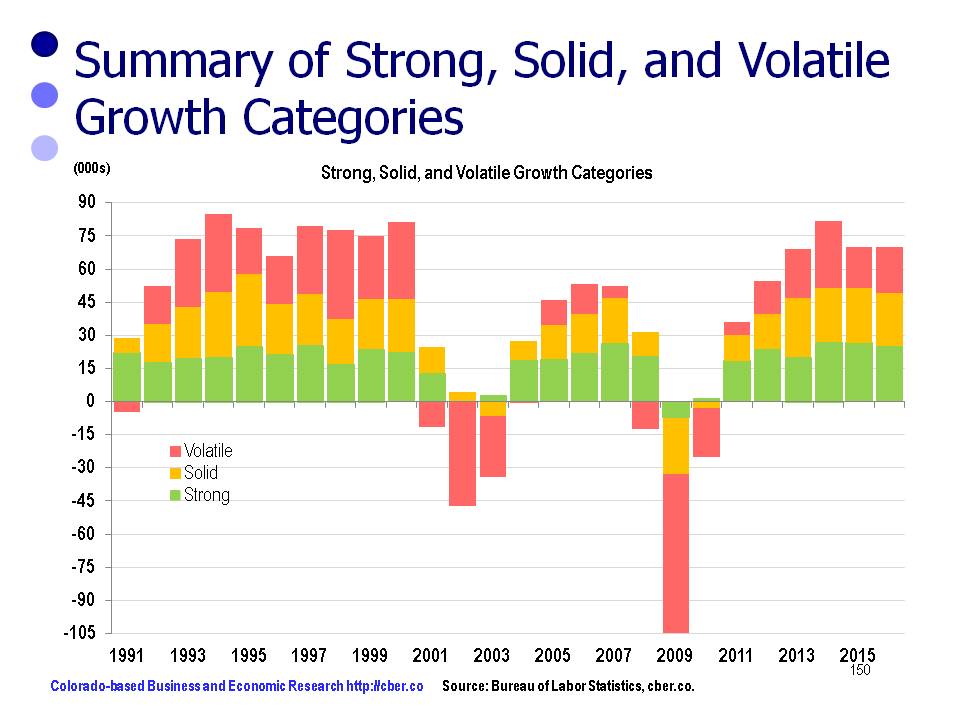
This portfolio approach has made it easy to see that some sectors consistently create jobs at a higher rate of growth, some show solid growth, and others are more volatile. Ultimately, the volatile category tends to have a greater influence on the change in total job growth than the sectors with steady growth.

The most difficult challenge in producing the 2016 forecast was to estimate the 2015 data. The methodology used by BLS to produce the preliminary nonfarm data was flawed. Having said that, the growth of the Strong, Solid, and Volatile Growth Categories will be similar to 2015; however, the total will be slightly less.

The Strong Growth Category of sectors (green) has performed consistently over time. The category added jobs as expected in 2015. Sectors in this category include:
• Professional, Scientific, and Technical Services
• Management of Companies and Enterprises
• Administrative – Business to Business (Not Employment Services)
• Private Education
• Health Care
• Arts, Entertainment, and Recreation
• Other Services.

Recent and projected employment changes for the Strong Growth Category follow:
• 2012 24,000
• 2013 20,100
• 2014 26,900
• 2015 26,700
• 2016 24,000 to 26,000
The 2016 projected rate of growth will be 2.9% to 3.2%, similar to the last two years.

Over time, the Solid Growth Category of sectors (yellow) has been more volatile than the Strong Growth Category and it has grown at a slower pace. In 2015, this category performed as expected. Sectors in this category include:
• Wholesale Trade
• Retail Trade
• State (Not Higher Education)
• Higher Education
• Local (Not K-12 Education)
• K-12 Education
• Accommodations and Food Services

Recent and projected employment changes for the Solid Growth Category follow:
• 2012 15,600
• 2013 26,600
• 2014 24,500
• 2015 24,700
• 2016 23,000 to 25,000
The 2016 projected rate of growth will be 2.3% to 2.5%, similar to the past two years.

Finally, the Volatile Category of sectors (red) was a significant source of growth in 2013 and 2014, but the number of jobs added in 2015 fell off significantly. Sectors in this category include:
• Natural Resources and Mining
• Construction
• Manufacturing
• Transportation, Warehousing, and Utilities
• Employment Services
• Financial Activities
• Information
• Federal Government

Recent and projected employment changes for the Volatile Category follow:
• 2012 15,100
• 2013 22,300
• 2014 30,400
• 2015 21,000
• 2016 20,000 to 22,000.
The 2016 projected rate of growth will be 2.7% to 3.0%, similar to 2015.

The 2016 cber.co Colorado economic forecast portends the state will add 67,000 to 73,000 workers and job growth will be 2.7% to 2.9%.

For additional information about the 2016 cber.co Colorado Economic Forecast click here.

Colorado Economic Forecast

cber.co 2016 Colorado Economic Forecast – Solid Growth

Last week, cber.co released its Colorado economic forecast for 2016. As is the case with most forecasts, the primary focus of the Colorado forecast is employment. As economic developers say, “it all starts with a job.”

Each year the forecast provides an optimistic, pessimistic, and most likely scenario.

The 2016 optimistic scenario calls for:
• U.S. Real GDP growth will be greater than 2.6%.
• Colorado will add more than 73,000 workers, the rate of job growth will be greater than 2.9%.

The projected likelihood of this scenario is 18%. The Colorado economy has experienced solid job growth since 2012; however, given the slowdown in the global economy and the lower price of oil, it is unlikely the state will experience accelerated growth.

The pessimistic scenario calls for:
• U.S. Real GDP growth will be less than 2.3%.
• Less that 67,000 Colorado workers. Job growth will be less than 2.7%.
The projected likelihood of this scenario is 22%. While the global and U.S. economies are expected to see slight growth in output, the Colorado economy could be derailed if the price of oil stays low and the global economy slows further.

The most likely scenario calls for:
• U.S. Real GDP will be 2.3% to 2.7%.
• The U.S. will add at least 2.7 million workers.
• Colorado will add 1.8% of total U.S. jobs added.
• Colorado will add 67,000 to 73,000 workers, job growth will be 2.7% to 2.9%.

Despite downside risks there is a 55% likelihood this forecast will occur. Since 2012 growth has been steady and broad-based. Much of the growth has been in sectors such as tourism, which have an indirect link to the extractive industries.

The bottom line – look for continued job growth in Colorado, but at a slower rate than 2015.

For additional information about the 2016 cber.co Colorado Economic Forecast click here.

colorado economic forecast

Which has the Top Economy – Colorado, Utah, Washington?

There are frequent references in the local media about how Colorado is one of the top state economies in the country. And it is!

There are many metrics that can be used to compare state economies. The two best metrics are the growth rates for Real GDP and employment. In this post we look at these metrics from 2005 to the present for Colorado, Utah, Washington and the U.S.

Employment
• Washington has the greatest number of employees, followed by Colorado.
• Utah had the highest rate of employment growth of the three states. Colorado and Washington have grown at similar rates; however, Washington’s rate of growth has been off a larger base of employment.
• Employment for all three states has grown at a faster rate than the U.S. That rate of growth has accelerated since 2010 for all three states.

Colorado Utah Washington

Real GDP
• Washington has the largest GDP, followed by Colorado.
• The Real GDP for all three states has grown at a higher rate than the U.S.
• Utah had the fastest rate of Real GDP growth from 2005 to present followed by Washington. Colorado is third.
• Since the end of the recession the GDP for all three states has grown at a faster rate than the United States. Colorado had the fastest rate of Real GDP growth from 2013 to present because of the rapid growth in the extractive industries. That rate of growth is likely to decrease in 2015 and beyond as a result of challenges facing the oil and gas industry caused by lower oil prices.

Colorado Utah Washington

Based on these metrics Washington has the largest economy and Utah is growing at a faster rate than the other two states. The strengths of the economies in Utah, Washington, and Colorado make them great places to live, work, and play. Here’s to a prosperous year for all three states in 2016.

State Agencies Release 2016 Economic Forecasts

On December 21st, the Colorado Legislative Council (CLC) and the Governor’s Office of State Planning and Budgeting (OSPB) released their quarterly 2016 economic forecast . (https://www.colorado.gov/cga-legislativecouncil and https://sites.google.com/a/state.co.us/ospb-live/). The two reports provide slightly different estimates for 2015 and forecasts for 2016, both of which are supported by rational explanations. A comparison of the 2015 estimates for key indicators follows.

2015 Estimates

At the national level, the major difference is that OSPB expects U.S. unemployment to be slightly higher.

At the state level there are several items to make note of:
• Both organizations have indicated stronger than anticipated population growth.
• CLC projected employment to be near the current levels published by the Bureau of Labor Statistics. OSPB projected employment to be near the estimated benchmark revisions that will be made in March.
• Inflations in Colorado is much higher than the U.S. OSPB’s projection for employment is slightly higher than the CLC projection.
• OSPB is more optimistic than CLC about the number of construction permits issued in 2015.

U.S. Economy December 2015 Estimate for 2015
Category CLC OSPB
Real GDP % Change 2.5% 2.4%
Employment   Change % 2.9 million

2.1%

2.8 million

2.0%

Unemployment Rate 5.0% 5.3%
Inflation (CPI) 0.1% 0.1%
Colorado Economy December 2015 Estimate for 2015
Category CLC OSPB
Population Change /% +101,200

1.9%

+98,000

1.8%

Employment Change/% +57,600

2.3%

+69,000

2.8%

Unemployment Rate 4.0% 4.1%
Retail Trade Sales (Millions)/% $93,191

2.8%

$94,200

4.3%

Home Permits (000s) 28.6 31.0
Denver-Boulder Inflation Rate 1.1% 1.5%

2016 Forecasts

At the national level, the two groups have similar forecasts. OSPB forecasted slightly higher U.S. inflation than CLC.

At the state level there are several items to make note of:
• Both groups are projecting population growth similar to 2015.
• Both groups are forecasting continued job growth; however, it will be at a slower level. There are drastic differences in the projected employment levels.
• OSPB is much more optimistic that CLC about construction growth.
• Inflation will be about one percentage point greater than the U.S. level.

December 2015 U.S. – 2016 Economic Forecast 
Category CLC OSPB
Real GDP % Change 2.3% 2.3%
Employment Change/% 2.6 million

1.8%

2.4 million

1.7%

Unemployment Rate 4.8% 4.8%
Inflation (CPI) 1.6% 1.8%
December 2015 Colorado – 2016 Economic Forecast
Category CLC OSPB
Population Change /% +95,200

1.7%

+97,300

1.8%

Employment Change/% +47,300

1.9%

+66,800

2.6%

Unemployment Rate 3.8% 3.8%
Retail Trade Sales (Millions)/% $98,037

5.2%

$99,400

5.5%

Home Permits (000s) 32.0 37.9
Denver-Boulder Inflation Rate 2.4% 2.5%

The bottom line is that the state is expected to show continued job growth. The question is whether or not it will be at a level that is weak to average or will be average to modest growth.