Healthcare, Extractive Industries, and Wages

Looking ahead to 2015 there are three issues that will impact the economy in 2015: healthcare, extractive industries, and wages.

Healthcare
The healthcare industry may play an important role in the economy in 2015.
• First, there are shortages of workers in many key positions. This may affect the care consumers receive from their service providers and it may increase the costs of doing business.
• Second, providers are being pushed by Obamacare and insurance companies to reduce the fees they charge. In turn, this may reduce their margins.
• Third, it was recently announced that Colorado employers will face an 8% increase in the cost of insurance. Likely, a portion of that increase will be passed on to workers. That could reduce that amount of discretionary income, which in turn could reduce retail consumption.
• In addition, it has been announced that Connect for Health Colorado, will reduce subsidies. In other words, many Coloradans will have to pay significantly more for coverage, go without healthcare, or pay a fine to the government. Coloradans will face sticker shock when they get their health insurance bills in 2015.

Extractive Industries and Prices of Oil and Gasoline
The extractive industries will continue to face challenges in 2015. Fracking is still an issue in Colorado that will not go away. Local governments are pushing to have greater control over the way the extractive industries operate in their jurisdiction.

In addition, the price of oil has trended downward for the past six months. If these trends continue, it may impact production in Colorado, which will hit the smaller companies first. It will also impact severance taxes paid to the state government.

At the same time consumers have enjoyed lower prices at the pump. Their gasoline bills for 2013 and 2014 will be similar. If lower prices continue into 2015, consumers may notice a reduction in their annual gasoline bill in the range of $400 to $800 for the year.

If prices at the pump continue to decline Colorado consumers will be the benefactors, but state coffers suffer. Typically the negative impact for the state outweighs the positive impact on the consumer.

Wages
Typically, when unemployment dips below the natural rate of employment, 4.5% to 5.0%, there is usually upward pressure on wages. Overall that has not been the case in Colorado.

Between 2007 and 2014
• The Denver Boulder Greeley CPI  (DBG) increased at an annualized rate of 2.4%
• The Private Sector Average Weekly Wages (AWW) increased by an annualized rate of 1.7%.
Inflation for this period grew at a faster rate than private wages for this period.

Between 2013 and 2014
•  The DBG CPI is projected to increase by 2.8%/
• The Private Sector AWW will increase by 2.0%.

The Construction and Financial Activities are isolated sectors that have seen strong wage growth in the last couple of years because the demand for qualified employees has exceeded the supply of workers.

Construction Wages
• Between 2008 and 2012 AWW declined. In 2013 it increased by 11.0% followed by an increase of 11% in 2014. Construction businesses have found that it has been necessary to raise wages this amount to attract workers. Ultimately these labor costs will be passed on to consumers.
Financial Activities
• The financial activities sector has also had strong wage growth, 5.0% annualized growth, from 2007 to 2014. Between 2007 and 2010 Average Weekly Wages decreased, but they have increased significantly since.  AWW will increase by 7.3% in 2014

On the other hand, 2014 inflation growth will exceed the change in wages for Manufacturing, Tourism, and Professional and Business Services. These three industries are critical to the state economy for different reasons.

Watch for healthcare, extractive industries, and wages to impact the Colorado Economy in 2015 – and the impact may not always be positive.

 

Colorado’s Employment Situation After Ten Months

After ten months, enough of the year has passed that Colorado’s employment situation for 2014 is virtually set. This post looks at overall and regional job growth, drivers of the regional economies, and industries that dominate state job growth.

Job Growth (Overall)
After BLS makes their March 2015 revisions the wage and salary employment will show that Colorado added at least 70,000 jobs this year. That is job growth of at least 2.9%.

Job Growth (Regional)
About 81% of Colorado’s job growth occurs in Colorado’s seven metro areas (listed below). The industry composition and the economies in these seven metro areas are distinct. As a result they have grown at different rates.

The estimated rates of job growth through ten months are:
• Greeley 5.0%
• Boulder 3.1%
• Fort Collins 2.8%
• Denver 2.8%
• Pueblo 1.8%
• Grand Junction 0.9%
• Colorado Springs 0.8%

During this period the percentage of job growth in the MSAs was:
• Denver added 67.4% of the MSA jobs.
• Boulder added 10.0%.
• Combined, the Northern Colorado MSAs added 16.0% of all jobs (Greeley 8.5% and Fort Collins 7.5%).
• Colorado Springs added 3.6% of the MSA jobs.
• Pueblo added 2.1%.
• Grand Junction added almost 1%.

Drivers of Regional Economies
The economies of Colorado’s seven metro areas are very distinct as evidenced by the industries driving their economy.
• Greeley has been driven by the extractive industries and Vestas.
• Fort Collins has been driven by the high-tech industry, CSU, and spillover from the extractive industries.
• Boulder has posted gains as a result of the high-tech industry, and CU employment.
• Denver’s economy is more balanced than the smaller economies. Interestingly enough, it has grown at a slower rate in 2014 than 2013.
• Pueblo has benefitted from Vestas.
• Grand Junction has struggled to recover from the most recent “oil shale bust”.
• Colorado Springs is still feeling the pain from the exit of Intel. In addition, the wildfires during the summers of 2012 and 2013 played havoc with the economy. The local economy is very dependent on the military and defense funding for local businesses. These industries are typically more volatile than the overall economy.

Industries Dominating State Job Growth
• Throughout 2014, job growth across the state has been led by the following  sectors
o Accommodations and Food Services (AFS)
o Health Care
o Professional, Scientific, and Technical Services (PST)
o Construction
o Retail
These five sectors account for about 71% of total job growth in the state.

Colorado’s Diversity of Job Growth

cber.co tracks changes in employment for 23 sectors of the Colorado economy. Part of that tracking includes a two-step process for measuring Colorado’s diversity of job growth.

The first step is to identify the number of sectors that are adding jobs. For the last three years the data shows:
• In 2012 19 sectors added jobs
• In 2013 19 sectors added jobs
• In 2014 18 sectors will add jobs (estimate).

As a point of reference, a comparison can be made to the following years:
• In 1993 22 sectors added jobs
• In 1998 22 sectors added jobs
• In 2002 13 sectors added jobs
• in 2003 10 sectors added jobs
• in 2009 8 sectors added jobs
• In 2010 10 sectors added jobs.
This shows that during the best of times, some sectors lose jobs. As well, it illustrates that during the worst of times, there are sectors adding jobs.

Another way to look at the data is to calculate the percent of employment in sectors where jobs are being added. For the last three years the data shows:
• In 2012 the sectors that added jobs had 88.5% of total employment.
• In 2013 the sectors that added jobs had 89.2% of total employment.
• In 2014 the sectors that added jobs had 85.4% of total employment (estimate).
The 2014 percentage might increase when the BLS revises 2014 data in March 2015.

As a point of reference, a comparison can be made to the following years:
• In 1993 the sectors that added jobs had 99.1% of total employment.
• In 1998 the sectors that added jobs had 99.6% of total employment.
• In 2002 the sectors that added jobs had 49.4% of total employment.
• In 2003 the sectors that added jobs had 36.7% of total employment.
• In 2009 the sectors that added jobs had 27.3% of total employment.
• In 2010 the sectors that added jobs had 33.2% of total employment.

The data shows that since 2012 Colorado’s job growth has been diverse and solid.

diversity of job growth


Measures of the Colorado Unemployment Rate

The Bureau of Labor Statistics compiles several measures of the Colorado unemployment rate. Each measure and its descriptions are listed below.  In each case, the  percentage has declined over the past year. The U-3 number is the headline number; however, many people think U-6 is more representative of the state of the economy because its definition is more inclusive.

Measures  of the Colorado Unemployment Rate Sept. 2013 Sept. 2014
U-1 Persons unemployed 15 weeks or longer, as a percent of the civilian labor force. 3.80%  2.80%
U-2 Job losers and persons who completed temporary jobs, as a percent of the civilian labor force. 3.70% 2.90%
U-3 Total unemployed, as a percent of the civilian labor force (headline unemployment rate). 7.20% 5.90%
U-4 Total unemployed plus discouraged workers, as a percent of the civilian labor force plus discouraged workers. 7.70% 6.40%
U-5 Total unemployed, plus discouraged workers, plus all other persons marginally attached to the labor force, as a percent of the civilian labor force plus all persons marginally attached to the labor force. 8.60% 7.30%
U-6 Total unemployed, plus all persons marginally attached to the labor force, plus total employed part-time for economic reasons, as a percent of the civilian labor force plus all persons marginally attached to the labor force. 13.60% 11.80%


Establishment Growth Tops in Broomfield, Denver, and Douglas County

Since the end of the recession establishment growth occurred fastest in the following counties: Broomfield, Denver, and Douglas.

The Quarterly Census of Employment and Wages (QCEW) data provides trends for the creation of establishments by county. To be included in the QCEW database, establishments must have at least one employee.

Between 2002 and 2013 the number of Colorado establishments increased at an annualized rate of 1.0%. Between 2009 and 2013 the number of Colorado establishments changed at an annualized rate of -0.1%.

Year Establishments
2002 153,830
2003 156,986
2004 160,104
2005 166,540
2006 171,682
2007 175,442
2008 175,410
2009 171,729
2010 168,176
2011 166,537
2012 168,824
2013 171,249

For the period 2002 to 2013, the number of establishments in Broomfield, Douglas, and Weld County grew at the fastest rate, while the number of establishments in Arapahoe, Jefferson, and Pueblo changed at the lowest rates.

Year County
County/State 2002 vs. 2013
Broomfield 5.1%
Douglas 4.2%
Weld 2.0%
Larimer 1.4%
Boulder 1.2%
El Paso 1.1%
COLORADO 1.0%
Denver 1.0%
Adams 0.7%
Arapahoe 0.4%
Jefferson 0.2%
Pueblo -0.5%

For the period 2009 to 2013, the number of establishments in Broomfield, Denver, and Douglas County grew at the fastest rate, while the number of establishments in El Paso, Jefferson, and Pueblo changed at the lowest rates.

County/State 2009 vs. 2013
Broomfield 2.5%
Denver 1.5%
Douglas 1.4%
Boulder 0.9%
Larimer 0.3%
Arapahoe 0.1%
Weld 0.1%
COLORADO -0.1%
Adams -0.2%
El Paso -0.2%
Jefferson -0.5%
Pueblo -1.9%

It is interesting to note that Boulder County, often regarded as the hotbed of entrepreneurship, was not at the top of the list for the percentage of establishments added.

U.S. and Colorado Unemployment Rates Continue to Decline

Nationally, the unemployment rate has dropped below 6.0%, to 5.9% and the number of unemployed is now below 9.3 million. While this decline is a positive sign, the number of unemployed remains about 2.5 million above the low point in the second half of 2006.

The BLS tracks the unemployment rate in 22 occupations. Ten of those occupations have unemployment rates below the natural rate of unemployment (5.0%).

Most likely there is upward pressure on wages in these occupations at a national level, as well as in Colorado.

Occupation Unemployment Rate
Legal occupations 2.2%
Management occupations 2.3%
Architecture and engineering occupations 2.4%
Healthcare practitioner and technical occupations 2.4%
Business and financial operations occupations 2.7%
Computer and mathematical occupations 2.8%
Life, physical, and social science occupations 2.8%
Community and social service occupations 3.3%
Education, training, and library occupations, 3.3%
Installation, maintenance, and repair occupations 3.4%
Healthcare support occupations 4.9%

Of the above occupations, the ones most critical to Colorado are:
• Architecture and engineering occupations
• Healthcare practitioner and technical occupations
• Computer and mathematical occupations
• Healthcare support occupations

Although the U.S. unemployment rate is approaching the natural rate of unemployment (5.0%), there is limited upward pressure on wages across the nation. This is reflected in the National Association of Business Economists October Survey, which indicated that in Q3 2014, 24% of the respondent firms raised their wages and salaries, about half the percentage that raised their wages in Q2. If there was a potential for upwards wage pressures earlier in the year, those pressures have eased significantly.

The Colorado unemployment rate, 4.7%, and the number of unemployed, 131,348, continues to decline.

Even though the unemployment rate is near the natural rate of unemployment there appears to be minimal upward pressure on wages, except in a few categories of occupations such as specialized high -tech jobs, computer related occupations, and healthcare. In addition, wage pressures may be felt in geographic areas, such as Weld County, where the extractive industries are booming.

In 2009 the average annual wages for all occupations in Colorado, as measure by the QCEW data, was $46,861. By 2013, average annual wages had increased to $50,873, an annualized rate of growth of 2.1%.

Unfortunately, during that same period, the Consumer Price Index for the Denver-Boulder-Greeley area increased at an annualized rate of 2.6%. In other words pay increases did not keep up with increases in the cost of living. This year inflation is projected to increase at a higher rate than the gain in total wages.

On average, Colorado employment is 65,200 greater for the first 9 months of 2014 than the same period in 2013. That total will likely be revised upwards when the BLS benchmarks the CES data series in March 2015.

Looking ahead for the remainder of the year, the tourism; construction; health care; and professional, scientific, and technical services sectors will continue to be the primary sources of growth. Although, the extractive industries are small they are the source of greater indirect job growth and significant output growth.

Utah Job Growth Outpacing Colorado

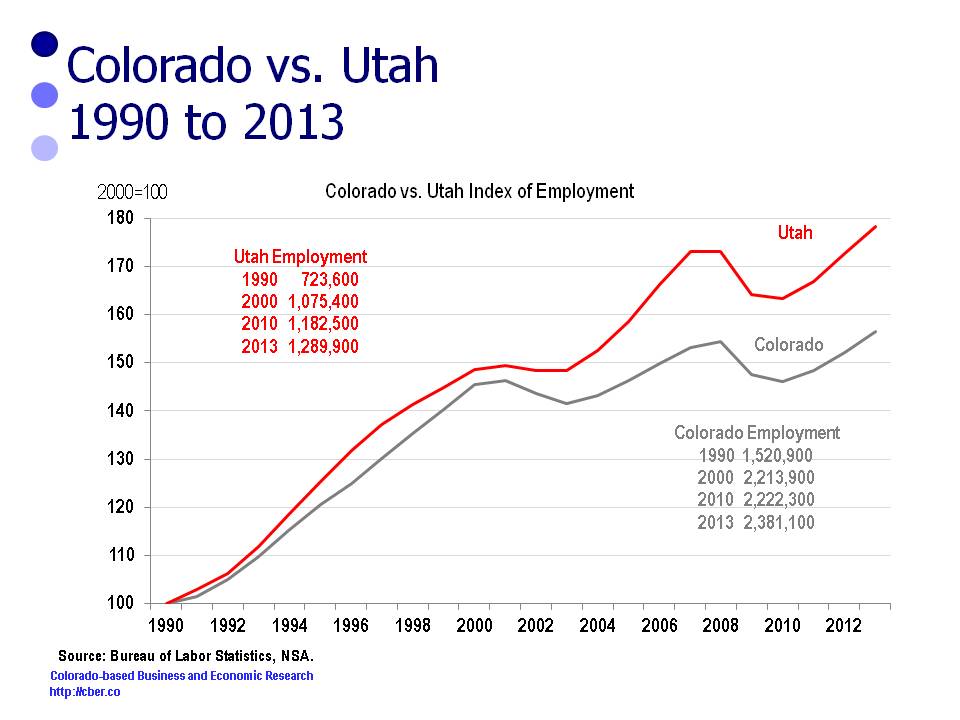
Colorado’s wage and salary employment is about twice the size of Utah’s wage and salary employment. In some state rankings, it has been reported that Utah is adding workers at a faster rate than Colorado.

Since 1990, Utah wage and salary employment has grown at a faster rate than Colorado, although the two states grew at a similar rate during the 1990s.

A review of the following six industries shows that Utah has increased at a faster relative rate than Colorado between 1990 and 2013:
• Construction
• Manufacturing
• Tourism
• Information
• Professional and Business Services
• Financial Activities

The following factors contribute to Utah’s faster rate of growth:
• Utah was showcased around the world for the 2002 Olympics.
• Utah has many of the same assets that Colorado has – quality of life, scenery, tourism, solid higher education.
• Because its rate of growth is calculated off a smaller base, Utah is likely to have a higher rate of growth. That statement is not intended to detract from Utah’s appeal as a place to live, work, and play.

It is common to rank and compare the performance of states. The most important take-away from this comparison is the fact that Colorado and Utah are both popular strong performing states.

Colorado vs. Utah Job Growth


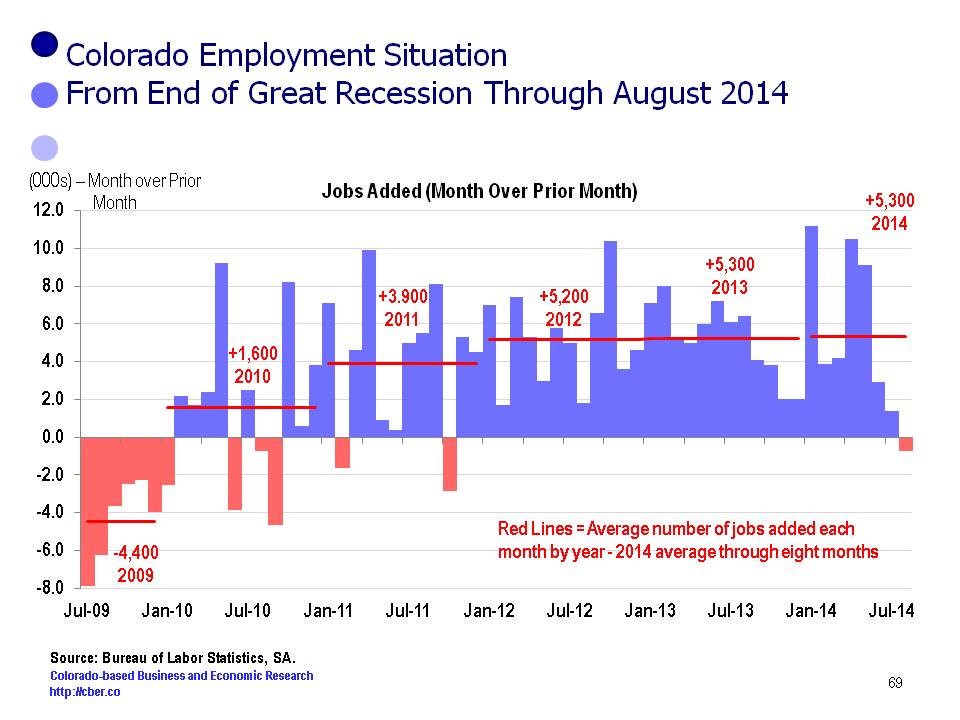
Colorado Lost 700 Jobs – Don’t Believe It

Earlier this morning, the Colorado Department of Labor and Employment issued a press release stating that Colorado lost 700 jobs in August compared to the previous month. The data series was adjusted.

The data does not reflect what is happening on the street. It fails to echo the confidence that consumers have in the national and state economy.

• The ISM indices for manufacturing and the services sector are positive.
• While some of the construction data is flat or down, NAHB data is up, suggesting better data in the months ahead.
• On 9/26, the Q2 GDP will be revised. The third estimate is expected to be revised upwards to 4.8ish.

Locally, there is even stronger reason to be optimistic.

• The state made it through the summer without any major fires, floods, or other natural disasters (knock on wood).
• The number of business establishments continues to increase. The leaders in relative growth are Broomfield, Denver, Douglas, and Boulder.
• Universities and K-12 are better funded than a year ago.
• Retail sales tax collections up, as evidenced by increased budgets for the state and many municipalities.
• The State General Fund has collected more revenue, a reflection of improved business and personal income taxes.
• The Colorado Tourism Office has reported a record level of tourism visitation and spending for the summer months.
• Developers are optimistic – believably optimistic.

From a methodological perspective, there are multiple reasons why the data will likely be revised upwards next month and later in March 2015. While it is possible the data turned down slightly in August, it is difficult to believe there were seasonally adjusted job losses in August.

Colorado Loses 700 Jobs


U.S. and Colorado Economy Remain Solid

National Economy
The U.S. economy remains strong, with solid employment and output growth.

• Nationally, employment remains strong, despite slower than expected job growth in August. The non-seasonally adjusted data shows that an average of 215,000 jobs has been added each month through eight months. This means the U.S. will add about 2.5 million jobs this year.
• Output remains solid. The first Q2 estimate showed real GDP growth of 4.0%. That was revised upwards to 4.2%. It is possible the third estimate, due later this month, could be revised even higher to 5.0%.
• At the most recent FOMC meeting the Federal Reserve provided no surprises. Their stance on the economy indicates:
o The rate of inflation remains below target.
o Quantitative easing will come to an end.
o There is slack in the labor market.
o Interest rates will remain low in the near term; however, once rate increases begin they will accelerate faster than previously anticipated. It is likely rates will begin increasing in mid-2015.
• The outlook for construction is positive.  Single family building permits have been flat; however the NAHB index shows that homebuilder sentiment is much stronger than the permits data. This suggests greater activity, and stronger data, will occur in the future.
• The unemployment rate, number of unemployed, and the number of Americans filing new claims for unemployment benefits continue on a downward trend. The economy should remain healthy as long as fewer people are unemployed and an increasing number of Americans are working.

Colorado Economy

The performance of the Colorado economy is closely tied to changes in U.S. job and output growth. Since the end of the recession Colorado job growth has outperformed the U.S. because of its mix of industries. The state is on track to add jobs at an accelerated rate for the fourth consecutive year.  Job growth this year will be about 3.0%.

• The extractive industries have been a major direct and indirect contributor to the job growth. As well, the extractive industries were responsible for about one-third of the state’s GDP growth in 2013. The extractive industries are important to the economies of about half the counties in the state. From a jobs perspective, the sector is small, but the number of workers will increase by at least 9% this year compared to 2013.
• So far this year, between 10% and 12% of the jobs added in Colorado are construction jobs. The number of jobs will increase by at least 6.5% compared to the same period last year. Growth in the sector might be constrained by a lack of trained workers in specialized construction occupations such as plumbers, HVAC workers, and electricians. The home and infrastructure subsectors also include distinct specialized occupations.
• Tourism has enjoyed a banner year in Colorado. It began with good snow and a strong ski season. The good snow season also meant plenty of water for mountain rafting and summer tourism activities. Special events, such as the USA Pro Challenge, and the lack of fires and flooding provided the foundation for a strong summer season. Leisure and hospitality job growth is poised to be at least 4.6% greater in 2014 than last year. The sector will be responsible for adding about 19% of the jobs in the state this year.  The sector plays a significant part of the economy in all 64 counties.
• The healthcare sector will add more than 10,000 workers in 2014 and expand at a rate of more than 4.3%. The sector continues to face challenges finding workers in many occupations and in rural areas.
• The growth of the professional, scientific, and technical sector is important to the state because a portion of these companies are directly or indirectly a part of the state’s advanced technology sector. The lifestyle of Downtown Denver and Colorado is attracting millennials to jobs in these sectors. The growth of in the sector will be at a rate of about 4.5% in 2014. It is important to note that many of these occupations pay higher than average wages and the sector is adding jobs at an increasing rate.


Colorado Job Growth Outpaces the U.S.

Colorado is outpacing the U.S. in the rate of job growth. The mix of jobs added by the top sectors is different for Colorado than the U.S. In addition, many of the jobs being added in the state pay lower than average wages.

Through seven months, the sectors that contributed the greatest number of jobs (top five) account for 70.4% of jobs created in Colorado.

  • Accommodations and Food Services 19.8%
  • Health Care 15.9%
  • Professional, Scientific, and Technical Services 12.0%
  • Construction 11.9%
  • Retail Trade 10.8%.

Through seven months, these same five sectors contributed only 56.4% of the jobs created in the U.S.

  • Accommodations and Food Services 14.1%
  • Health Care 12.6%
  • Professional, Scientific, and Technical Services 9.1%
  • Construction 7.7%
  • Retail Trade 12.8%.

Colorado’s rate of growth for these sectors during the first seven months is faster than the U.S.

  • Accommodations and Food Services, 5.5% vs. 2.8%.
  • Health Care, 4.3% vs. 1.7%.
  • Professional, Scientific, and Technical Services, 4.3% vs. 2.7%.
  • Construction 6.5% vs. 3.2%.
  • Retail Trade 3.0% vs. 2.0%.

For the first seven months, the cumulative total of the Colorado sectors where primary jobs were categorized (manufacturing, information, PST) expanded at a faster rate than the U.S, 2.7% vs. 1.3%.

The following are the average annual private sector wages for the sectors that are adding the most jobs.

  • Accommodations and Food Services $18,808.
  • Health Care, $45,905.
  • Professional, Scientific, and Technical Services, $84,842.
  • Construction, $51,064.
  • Retail Trade $28,159.

Many of the jobs being added in Colorado are low paying jobs.

It is great that the Colorado economy is adding jobs. Time will tell whether the mix of jobs being added will be to Colorado’s benefit or detriment.