Colorado Recovery Lagging Other States

Last summer, Colorado was one of the top states in the recovery from the C-19 pandemic. As time has passed, its economic performance has gotten worse.

The most recent release of data from the Bureau of Labor Statistics shows that Colorado lost 20,300 jobs in December, compared to November. December was the second consecutive month that the state lost jobs. 

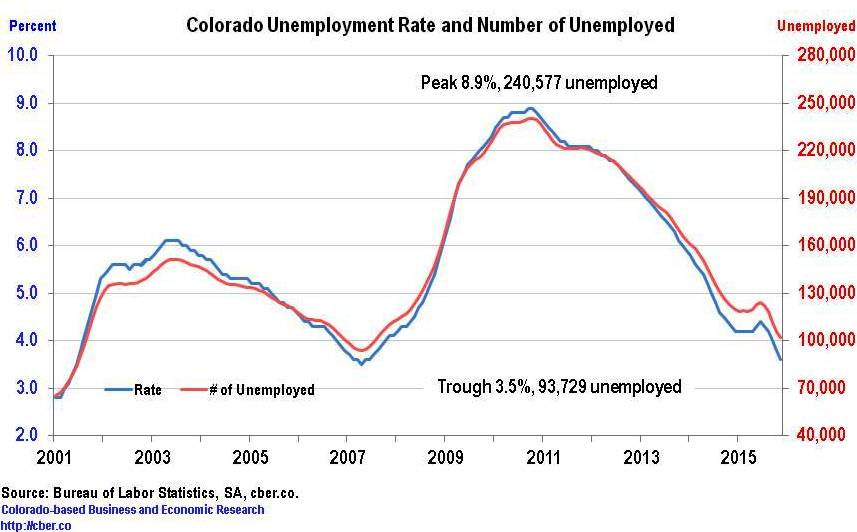
The unemployment rate jumped to 8.4%. That rate was the 48th highest rate in the country. It was slightly worse than New York but less than California, Nevada, and Hawaii.

Only 2 states in the top 25 lost jobs in December 2020.

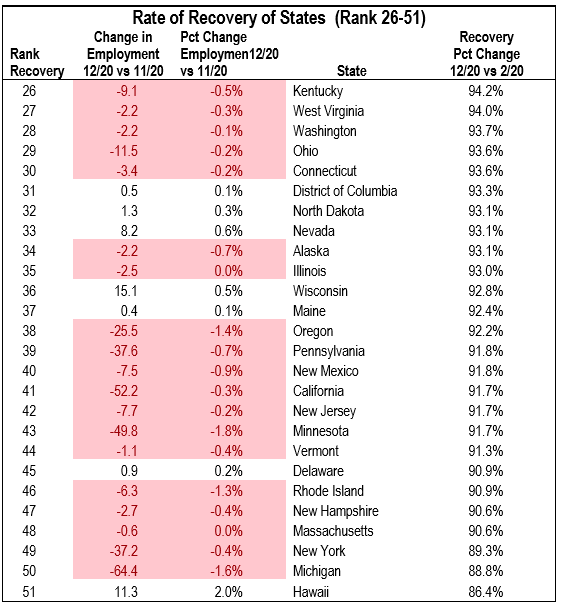
The two charts in this post show the following:

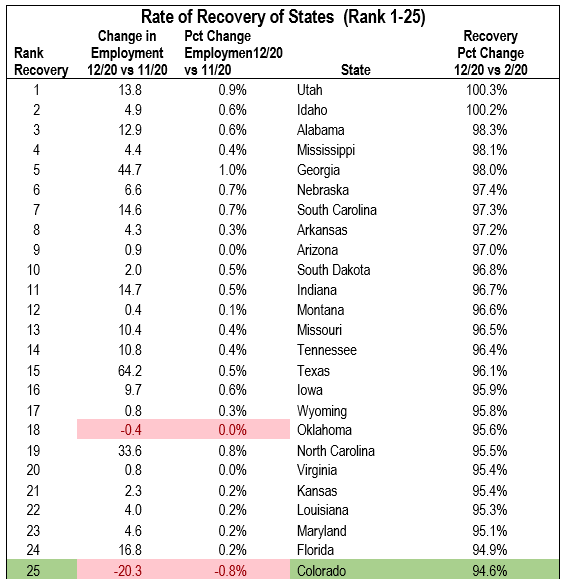
  • Column 1 is the rank of the recovery (column V).
  • Column II is the absolute change in employment from November 2020 to December 2020.
  • Column III is the percentage change in employment from November 2020 to December 2020.
  • Column V is the percentage recovery from February 2020 to December 2020.

Colorado (green) has the 25th lowest percentage of recovery, 94.6%. Two states, Utah and Idaho, have already returned to their employment pre-pandemic employment levels.

The chart above shows that 2 of the 25 states lost jobs between November and December.

The chart below shows that 19 of 26 states lost jobs between November and December.

State and local leaders have struggled to maintain a balance between the number of new C-19 cases and deaths and the health of the economy. Stay tuned.

19 of 26 states lost jobs in the 26 to 51 ranking.

COVID-19 cases per 100,000 – U.S. vs Colorado

The Opportunity Insights project is tracking the recovery of the U.S. economy from COVID-19-19. The following data is through January 12, 2021.

There were 44.4 COVID-19 cases per 100,000 in Colorado and 75.9 cases per 100,000.

The Colorado rate is trending down while the U.S. rate is trending up. The light grey lines in the background represent other states. The rate for Colorado is appears to be lower than most states.

Colorado has paid a steep price economically for having lower COVID-19 rates per 100,000. The state was ranked 48th in December for the worst unemployment rate in the nation.

States with the lowest rates (per 100,000 people) include Hawaii, 13.8, and Vermont, 25.2 States with the highest rates include Arizona, 130.0, and California, 110.0.

COVID-19 Colorado vs. U.S.

Colorado Job Growth Holds Steady

In early March the Bureau of Labor Statistics released revised employment data for Colorado showing that 2014 was the 3rd strongest year of job growth in the state’s history and 2015 was ranked 9th.

Data released near the end of March shows that average year-over-year Colorado job growth for the past seven months has been about 67,000 jobs greater than the previous 12-month period. The reduced rate of expansion has occurred for the following reasons:
• The slowdown in the Chinese economy has caused many countries to experience lower rates of GDP growth.
• Colorado’s extractive industries are continuing to contract.
• Just as the Broncos can’t win the Super Bowl every year, it is not possible to have “Super-Bowl-like” job growth all the time.

Although the rate of growth for employment and the GDP are less than last year, the economy will still experience solid growth for the following reasons:
• There is solid GDP growth across most Colorado sectors.
• Job growth is stable in most industries and occupations.
• Solid and diverse growth will continue in the state’s personal income, population, and per capita personal income.
• There is a strong outlook for the construction industry in Colorado and the U.S.
• Robust new car sales are a reflection of solid personal consumption.
• There is increased activity at DIA and the area surrounding the airport.
• While low unemployment can be problematic it will drive higher wages.
• Higher wages will cause increased consumption and offset higher living costs.

Despite the headwinds, Colorado is on track for continued solid growth in 2016. For more details check out the most recent updates by clicking here or check out cber.co Colorado Economic 2016 Forecast.

Colorado Job Growth

Colorado 2015 Job Growth – 9th Best Year In History of State

This past week, the Bureau of Labor Statistics (BLS) announced that Colorado job growth for 2014 was revised upwards to 83,000 and 2015 job growth was bumped up to 76,300. The respective rates of Colorado job growth were 3.5% in 2014 and 3.1% in 2015.

The upward benchmark revisions made 2014 the third strongest year of absolute job growth while 2015 was the ninth strongest year. This is the best news for the state since the Broncos won the Super Bowl on February 7th.

During 2014 the BLS monthly estimates reported the Colorado economy was adding jobs at a declining rate. This past year, BLS showed that Colorado was adding jobs at an even faster declining rate than in 2014. Thank goodness the BLS projection models were grossly flawed. the benchmark revisions match the activity that has taken place on the streets for the past two years.

In 2015 the five largest sectors/subsectors were:
• Health Care
• Retail
• Accommodations and Food Services
• Professional, Scientific and Technical Services
• Financial Activities
These five industries accounted for 45.8% of total employment. Total employment for 2015 was 2,541,200.

In 2015, the five largest sectors/subsectors for the number of jobs added were:
• Health Care
• Construction
• Accommodations and Food Services
• Professional, Scientific and Technical Services
• Retail
These five industries accounted for 60% of the jobs added. The job growth for these five industries combined was 4.1% in 2015.

Job growth in 2016 will be solid, but slightly off the pace of 2015. Growth will be slowed by low oil prices, the slow economy in China, and a strong dollar abroad.

For more details check out the review of Colorado 2015 job growth by clicking here. And there is much more. For more details check out the cber.co Colorado Economic 2016 Forecast.

2015 job growth

December Nonfarm Jobs Data for Colorado – Lackluster Growth

Today, BLS released December unemployment and employment data for Colorado. The seasonally adjusted unemployment rate for the state dropped to 3.5%. This is significantly lower than the U.S. rate of 5.0%.

Workers will benefit from lower unemployment rates, but lower rates are generally bad for businesses. In many cases companies are not able to fill critical positions. In turn they are forced to hire unqualified workers, pay overtime, or leave money on the table.

Nationally, 25 states posted declines in their December unemployment rates compared to November. There were increases in 14 states and no change in the rates for 11 states and the District of Columbia.

BLS reported lackluster nonfarm job growth in Colorado in December. This level of growth is in line with the pattern for U.S. seasonally adjusted nonfarm job growth. On a seasonally adjusted basis there were 10,700 more workers in December than November.

To that point, there was strong growth across the country. Nonfarm payroll employment increased in 36 states and the District of Columbia and it decreased in 14 states.

Looking at U.S. job growth on a quarterly basis there was weak employment growth in Q3, but strong growth in Q4. Given this trend nationally, it stands to reason that Colorado is following that same pattern. The data is in line with the level of activity on the streets.

The data indicates that Colorado added about 20,000 jobs in Q4, after no job growth in Q3.

On March 14th BLS will release its employment benchmark data for 2015. That data will more accurately tell the story of 2015 nonfarm job growth in Colorado.

nonfarm job growth


Which has the Top Economy – Colorado, Utah, Washington?

There are frequent references in the local media about how Colorado is one of the top state economies in the country. And it is!

There are many metrics that can be used to compare state economies. The two best metrics are the growth rates for Real GDP and employment. In this post we look at these metrics from 2005 to the present for Colorado, Utah, Washington and the U.S.

Employment
• Washington has the greatest number of employees, followed by Colorado.
• Utah had the highest rate of employment growth of the three states. Colorado and Washington have grown at similar rates; however, Washington’s rate of growth has been off a larger base of employment.
• Employment for all three states has grown at a faster rate than the U.S. That rate of growth has accelerated since 2010 for all three states.

Colorado Utah Washington

Real GDP
• Washington has the largest GDP, followed by Colorado.
• The Real GDP for all three states has grown at a higher rate than the U.S.
• Utah had the fastest rate of Real GDP growth from 2005 to present followed by Washington. Colorado is third.
• Since the end of the recession the GDP for all three states has grown at a faster rate than the United States. Colorado had the fastest rate of Real GDP growth from 2013 to present because of the rapid growth in the extractive industries. That rate of growth is likely to decrease in 2015 and beyond as a result of challenges facing the oil and gas industry caused by lower oil prices.

Colorado Utah Washington

Based on these metrics Washington has the largest economy and Utah is growing at a faster rate than the other two states. The strengths of the economies in Utah, Washington, and Colorado make them great places to live, work, and play. Here’s to a prosperous year for all three states in 2016.

Employment Data for November Shows Continued Deterioration in Colorado Job Growth

The Bureau of Labor Statistics released wage and salary employment data for November that shows the level of Colorado job growth continued to deteriorate. In October, the jobs data reported there were 49,000 more jobs than 2014 and the difference for November was 43,600 jobs.

On a quarterly basis employment gains for 2015 are as follows:
• Q1 75,000
• Q2 60,200
• Q3 46,400
• Q4 46,300 (estimated).

The current employment data shows the state is on track to add 57,000 jobs in 2015. Henry Sobanet, Director of the Governor’s Office of State Planning and Budgeting recently stated the slowdown in the rate of job growth could be attributed to two things – the lower price of oil and the slower growth in the Chinese economy. In other words, the slowdown is a “bump in the road” and not a major recession.

Through the first eleven months of the year:
• About 78.8% of the total jobs added were in the top five sectors: Health Care; Accommodations and Food Services; Construction; Professional, Scientific, and Technical Services; and Financial Activities.
• Approximately 24.8% of all jobs added were in Leisure and Hospitality (Accommodations and Food Services plus Arts, Entertainment, and Recreation).
• About 10.9% of total jobs added were in the PST, Manufacturing, and Information Sectors. These sectors are the source of primary and advanced technology jobs.

Projected revisions, which will be made in March 2016, are estimated to bring Colorado job growth closer to the lower limit of the 2015 cber.co forecast, a forecasted increase of 73,000 to 79,000 jobs.

The total number of unemployed workers at the end of November 2015 was 102,035.

The total number of unemployed is 8,306 greater than the trough in May 2007 and 138,542 less than the peak in October 2010.

Lower unemployment rates have brought about shortages of trained workers in key sectors and occupations. The November 2015 unemployment rate of 3.6% is down from 4.3% in November 2014. In addition there are 19,567 fewer unemployed workers compared to a year ago.

The lower unemployment rates across the state are a mixed blessing. On the positive side, workers who are on the sideline will have more and better opportunities to find a job if their skills match the current openings. It is also likely that upward wage pressures my make it possible for them to be paid higher wages. On the downside there will be greater turnover at companies as people jump to “better” jobs, which may reduce productivity and drive up operational costs.

Looking ahead, 2016 stands to be a solid year if the unemployment rate will stabilize and job increases will be stronger than they were in the second half of 2015.

colorado jobs data


Colorado Unemployment Rate Drops to 3.6%

Earlier today the Bureau of Labor Statistics released employment and unemployment data  Colorado. It was a mixed blessing.

Unemployment

The Colorado unemployment rate for November dropped to 3.6%, down from 3.8% in October and 4.3% a year ago.

Nationally, the unemployment rate declined in 45 states compared to a year ago. By contrast only 27 states have rates lower than October. Colorado’s seasonally adjusted unemployment rate has been at or below 4.2% since December 2014 and there is little room for it to drop much further.

For job hunters this is good news as long as their skills match the available jobs. In addition, there will be upward wage pressure for occupations facing a shortage of qualified workers, such a construction, machining, and technicians.

On the other hand, the lower rate may be bad news for some companies. They may have greater difficulty finding qualified and clean workers. As a result they may have to pay higher wages for skilled positions. In addition, there is greater employee turnover during times of lower unemployment. This may decrease productivity and increase recruitment, hiring, and training costs. These increased costs will lead to lower profit margins and increased prices.

At the end of November there were 102,035 unemployed workers in Colorado. This is only 8,306 greater than the trough in May 2007 and 138,542 less than the peak in October 2010.

unemployment rate

Employment

Despite the lower unemployment rate, November wage and salary job growth was lackluster, only 43,600 greater than a year ago. During the first half of 2015 Colorado employment increased at an average monthly rate of about 5,600 jobs. That average has dropped to 3,900 jobs during the second half of the year.

Even with the declining rate of job growth Colorado will add 55,000 to 60,000 jobs this year – prior to BLS benchmark revisions that will be released in March 2016. Those revisions may push 2015 average employment to 70,000+. The leading sectors for job growth are Health Care, Accommodations and Food Services, and Construction.

As the level of job growth has tapered off there has been an increase in the number of discussions about a recession; however; the Fed’s recent decision to hike interest rates suggests the economy is on solid footing and a recession will not occur in the short-term.

Colorado Real GDP Currently Stronger than U.S.

On December 10th, the Bureau of Economic Analysis (BEA) released quarterly GDP data for Colorado (2005 to Q2 2015). The Q2 year-over-year Real GDP for Colorado increased by 4.8% compared to 2.7% for the U.S.

The following trends are evident in the comparison of the year-over-year GDP data for Colorado and the U.S:
• The correlation coefficient between these two variables is .69
• The U.S. was stronger during the period Q1 2006 through Q1 2007.
• Colorado outperformed the U.S. significantly between Q2 2007 and Q4 2009 (This was during the recession).
• The U.S. was stronger coming out of the recession for most of 2010 – from Q1 2010 to Q3 2010.
• For the next two years, from Q4 2010 to Q3 2012 the rates of growth for Colorado and the U.S. were similar.
• From Q4 2012 to the present, the Colorado GDP expanded at a faster rate than the U.S. GDP. Beginning in Q1 2014 the gap between the two rates became greater as a result of the strength of the oil and gas industry in Colorado.
• That gap has since narrowed in 2015 as the price of oil has declined and oil and gas production has fallen off.

Colorado Real GDP


The following trends are evident in the comparison of the year-over-year GDP data for Colorado and the Colorado wage and salary employment:
• The correlation coefficient between these two variables is .72
• Employment grew at a higher rate from Q1 2006 to Q2 2007 than the Real GDP.
• Generally, the Real GDP grew at a greater rate from Q3 2007 to Q2 2011 than employment growth.
• From Q3 2011 to Q1 2014 the rate of growth for employment was generally greater than the Real GDP growth.
• From Q2 2014 to present the Real GDP grew at a greater rate than employment. This was in part largely because of the increase in oil and gas production in Colorado during this period.
• As the price for a barrel has dropped and oil and gas production has fallen off the gap between the two rates has declined. This caused a much greater decline in the growth rate for GDP than employment.

Colorado Real GDP

As can be seen the growth of the Colorado Real GDP and the U.S. Real GDP are closely related. As well, there is a strong relationship between the rate of growth for state Real GDP and employment.

Top Output Categories for Colorado

The following list identifies the top output categories for Colorado. The list has been extracted from an IMPLAN database, www.implan.com. This database divides output and employment  into  440 categories.

IMPLAN is an economic analysis tool that uses input-output analysis in combination with regional specific Social Accounting Matrices and Multiplier Models.

This list provides insight into the industries that drive the Colorado economy. As can be seen finance is a major contributor to the state’s output. Other key categories are food services, extractive industries, construction, government, health care, and advanced technology.

Top Output Categories for Colorado Based on IMPLAN Data

Rank Industry Code Description Output Percent Cumulative Percent
1 360 Real estate establishments $25,472,296,875 5.2% 5.2%
2 361 Imputed rental activity for owner-occupied dwellings $22,888,701,172 4.7% 9.9%
3 319 Wholesale trade businesses $22,869,310,547 4.7% 14.6%
4 351 Telecommunications $20,428,070,313 4.2% 18.8%
5 413 Food services and drinking places $12,926,014,648 2.6% 21.4%
6 438 * Employment and payroll only (state & local govt, education) $11,658,043,945 2.4% 23.8%
7 354 Monetary authorities and depository credit intermediation activities $11,587,137,695 2.4% 26.2%
8 20 Extraction of oil and natural gas $11,270,791,992 2.3% 28.5%
9 356 Securities, commodity contracts, investments, and related activities $10,981,884,766 2.2% 30.7%
10 394 Offices of physicians, dentists, and other health practitioners $9,923,915,039 2.0% 32.8%
11 440 * Employment and payroll only (federal govt, military) $9,475,095,703 1.9% 34.7%
12 381 Management of companies and enterprises $9,202,613,281 1.9% 36.6%
13 437 * Employment and payroll only (state & local govt, non-education) $9,006,702,148 1.8% 38.4%
14 357 Insurance carriers $8,479,899,414 1.7% 40.2%
15 36 Construction of other new nonresidential structures $8,137,076,660 1.7% 41.8%
16 397 Private hospitals $7,912,281,250 1.6% 43.5%
17 369 Architectural, engineering, and related services $7,906,128,906 1.6% 45.1%
18 345 Software publishers $7,026,037,598 1.4% 46.5%
19 31 Electric power generation, transmission, and distribution $5,340,330,078 1.1% 47.6%
20 366 Lessors of nonfinancial intangible assets $5,337,109,375 1.1% 48.7%
21 439 * Employment and payroll only (federal govt, non-military) $5,274,785,156 1.1% 49.8%
22 371 Custom computer programming services $5,234,539,063 1.1% 50.9%
23 359 Funds, trusts, and other financial vehicles $5,130,132,813 1.1% 51.9%
24 115 Petroleum refineries $4,738,690,430 1.0% 52.9%
25 367 Legal services $4,462,339,844 0.9% 53.8%
Other $225,686,144,106 46.2% 100.0%

Total output for the model was $488,356,072,817 and employment was 3,235,493. These 25 categories account for 46.4% of employment and 53.8% of output for the state.