Blog

2014 Colorado Real GDP Growth More than Twice the Rate for U.S.

In early June the Bureau of Economic Analysis released Gross Domestic Product at the state level for two-digit NAICS Codes.

Since 1997 Colorado Real GDP has grown at a faster rate than the Real GDP for the U.S. (Sum of States) in 11 of 17 years.

gdp index

Since 1997 Colorado Real GDP has grown at a faster rate than the U.S. (Sum of States), 2.8% vs. 2.1%. The 2014 U.S. rate of growth was 2.2% compared to 4.7% for Colorado.

gdp index

There were 8 sectors that gained share in 2014, i.e., their percent of contribution to GDP was greater than their percent of the 2014 total GDP. Collectively, they accounted for 27.1% of the 2014 GDP and 46.5% of the change in the GDP. These sectors were:
• Arts, entertainment, and recreation
• Utilities
• Management of companies and enterprises
• Transportation and warehousing
• Accommodation and food services
• Construction
• Wholesale trade
• Mining

There were 12 sectors that lost share in 2014, i.e. their percent of contribution for these sectors was less than their percent of the 2014 total. Collectively, they accounted for 72.9% of the 2014 GDP and 53.5% of the change in the GDP. These sectors were:
• Educational services
• Agriculture, forestry, fishing, and hunting
• Other services, except government
• Administrative and waste management services
• Retail trade
• Finance and insurance
• Health care and social assistance
• Manufacturing
• Information
• Professional, scientific, and technical services
• Government
• Real estate and rental and leasing

The level of Real GDP Growth in 2014 provided significant momentum for the Colorado economy moving into 2015.

Boulder County and Larimer County Business Development

Both Boulder County and Larimer County are the source of innovation and entrepreneurship that helps drive the Colorado economy.

This analysis compares changes in the unemployment rate, population growth, the number of private sector establishments, and employment. It shows how the growth patterns for the two counties are significantly different for these demographics.

In summary, this comparison shows that:
• Since 2001, Boulder County and Larimer County have usually had unemployment rates below the state – which is a mixed blessing.
• Since 2001, the population, employment, and number of private sector establishments for Boulder County have grown below the rates for Colorado and Larimer County.
Finally, this analysis poses questions that relate to the changes in these data sets.

Unemployment Rate

Typically, the unemployment rates for both Boulder and Larimer County are below the rate for the state.
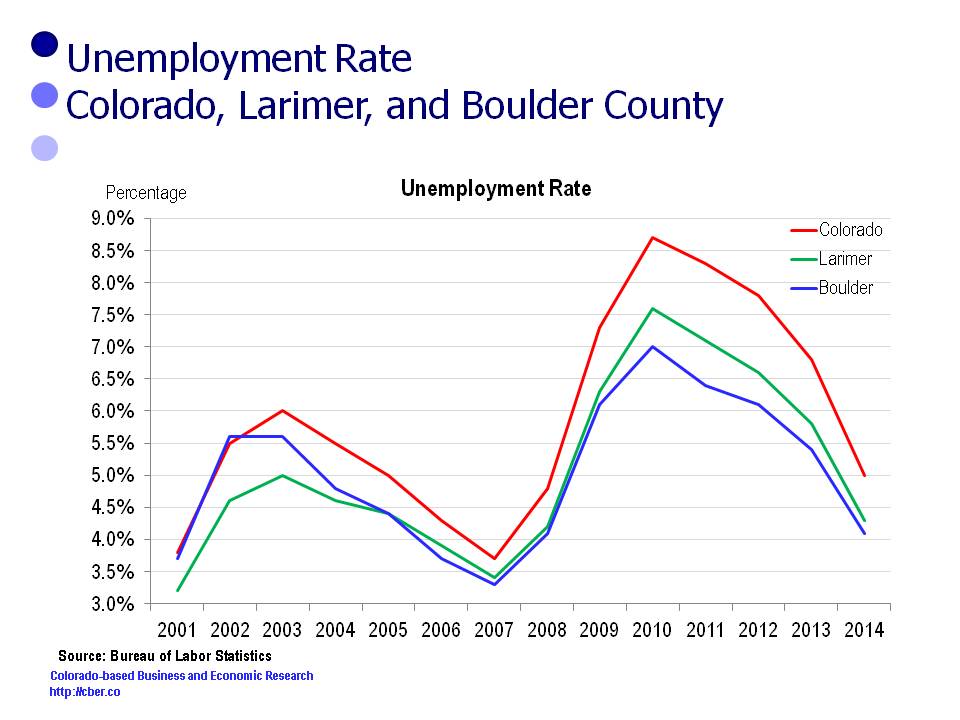
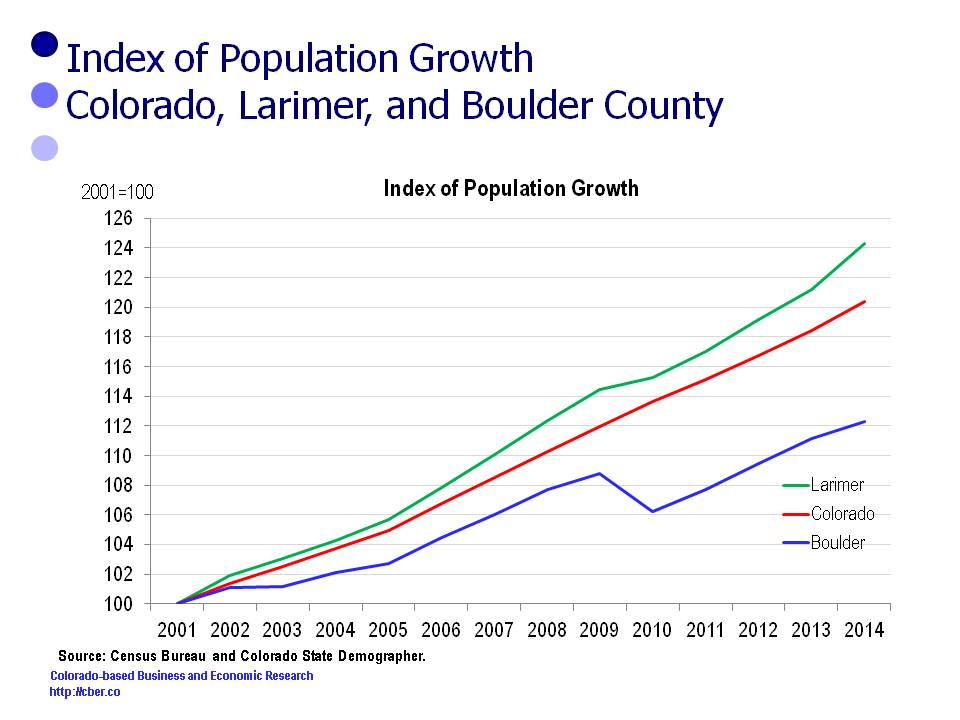
Boulder County and Larimer County

Population

In 2001 Larimer County population was 260,746. It increased by 63,376 and was 324,122 in 2014.
In 2001 the Colorado population was 4,444,513. It increased by 906,059 and was 5,350,572 in 2014.
In 2001 Boulder County population was 278,981. It increased by 34,352 and was 313,333 in 2014.

For this period the rates of change in the population follow:
• Larimer County 24.3%
• Colorado 20.4%
• Boulder County 12.3%.
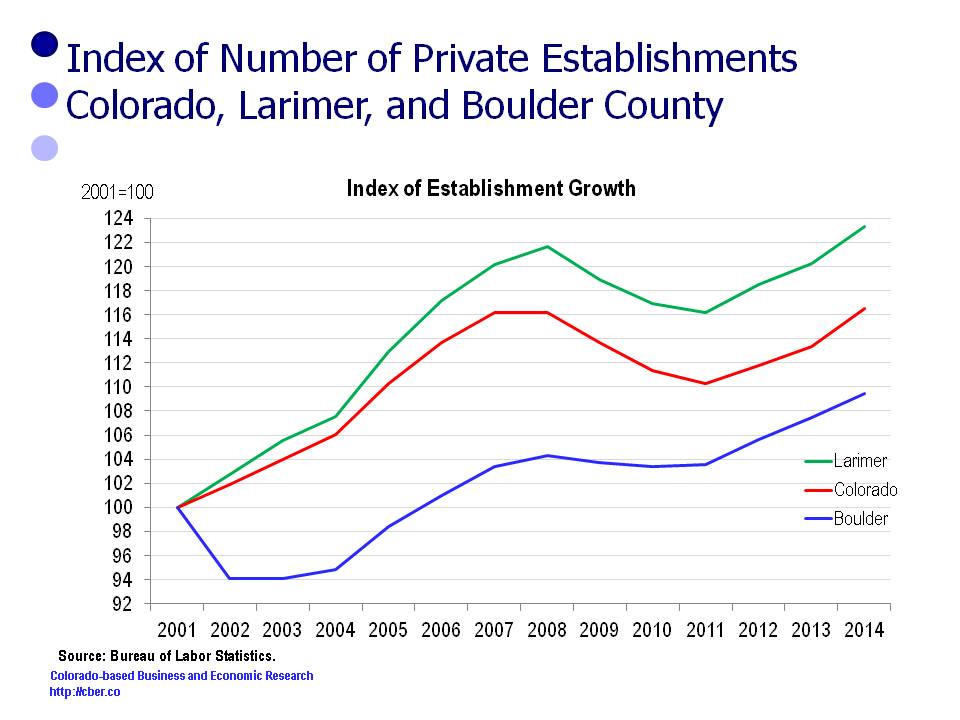
Boulder County and Larimer County

Establishments

In 2001 there were 8,479 Larimer County establishments. The number increased by 1,976 to 10,455 in 2014.
In 2001 there were 151,025 Colorado establishments. The number increased by 24,957 to 175,992 in 2014.
In 2001 there were 12,335 Boulder County establishments. The number increased by 1,165 to 13,500 in 2014.

For this period the rate of change in the number of establishments follows:
• Larimer County 23.0%
• Colorado 16.5%
• Boulder County 9.4%.
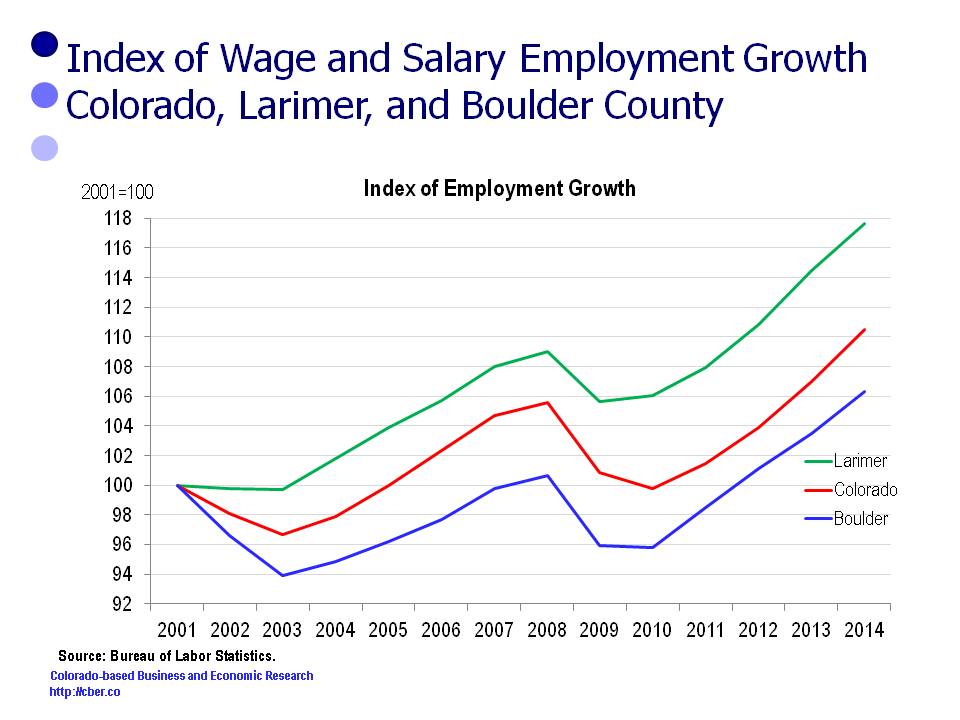
Boulder County and Larimer County

Employment

In 2001 Larimer County employment was 126,300. It increased by 22,300 and was 148,600 in 2014.
In 2001 Colorado employment was 2,226,800. It increased by 234,000 and was 2,460,800 in 2014.
In 2001 Boulder County employment was 166,200. It increased by 10,500 and was 176,700 in 2014.

For this period the rate of change in the employment follows:
• Larimer County 17.6%
• Colorado 10.5%
• Boulder County 6.3%.

Boulder County and Larimer County

Implications

The following questions arise when looking at the changes in the unemployment rate, population, the number of private sector establishments, and employment in Boulder County and Larimer County. (Boulder County is also the Boulder MSA and Larimer County is the Fort Collins MSA).

• How do organizations in Boulder and Fort Collins find qualified workers when the regional unemployment rate is lower than the state and other MSAs? Do they have established training programs? Do they recruit workers from other companies (in-state or out-of-state)? Do they provide their workers premium compensation packages?
• Why is the rate of growth for the Boulder population lower than Fort Collins and the state? Is this a result of a lack of affordable and attainable housing in Boulder? Will the completion of improvements to the 36 corridor make it easier for workers to commute to Boulder? Can commuters afford to use it?
• Why are the number of new business establishments in Boulder growing at a slower rate than Colorado and Fort Collins? Is there a lack of adequate commercial space? Is commercial real estate too expensive in Boulder? Why are other areas more attractive? Is it too expensive to operate a business in Boulder? Is it necessary to export innovative ideas out of Boulder so companies can be successful? Why do companies stay in Boulder
• Why is the employment growth rate for Boulder lower than the state and Fort Collins?

This analysis of data for Larimer, Boulder, and Colorado shows that communities have varied business development policies and priorities that have been successful in different ways.

The Impact of the Decline in the Price of Oil on Colorado

The recent release of BLS wage and salary employment data for Colorado showed that after four months the state is on track to add 71,400 workers. This is slightly below the cber.co forecast range of 73,000 to 79,000.

The softness in job growth may be attributed to the decrease in the price of oil, which bottomed out at $43 per barrel on March 17. A prominent Boulder economist has stated that average annual state employment for the year would fall to 40,000 because of the decline in oil prices. So far, the impact has been minimal.

In April there were 34,400 jobs (NSA) in the Mining and Logging Sector, which includes the mining and oil and gas industries. This is down about 1,300 jobs from December but about 1,800 jobs above the April 2014 total. The sector had record employment this past December.

Some of the factors that have affected demand are:
• Over time global demand for oil has declined, in part because of increased energy efficiency and an increase in the number of alternate sources. That decrease is expected to continue in the future.
• The number of Colorado rigs in operation has dropped sharply in the past six months.

price of oil
• Oil production in Colorado reached a record high in 2014. Despite the decline in oil prices, monthly production has remained near record levels; however, at some point reduced production is expected if prices remain suppressed for an extended period.

crude oil production
• Nationally, Colorado is a second-tier state for production; however, the oil and gas industry is a significant contributor to the state’s Gross Domestic Product. Today, the U.S. is producing about 80% of the oil used domestically, a significant change from five years ago. This means that Colorado producers will continue to drill, although production may be at lower levels.
• The price per barrel and the breakeven point are less critical than they were five years ago. Producers have become more efficient by reducing overhead and adopting improved technology such as super-fracking. In addition they have capped wells that are older or less efficient. Through increased efficiencies, companies have been able to lower the break-even point for many of their plays and adjust to lower prices per barrel.
• Since March 17th, the price per barrel has risen and reached $60 per barrel in early May. The consensus is that it will remain around that level for the remainder of the year.

These factors will have the following implications on the state:
• Colorado has a diverse energy industry. It is a strong second tier oil and gas state, it has companies that manufacturer solar and wind energy equipment, and significant energy research is conducted locally. Because energy is critical to the security of the U.S., the state will benefit from having a balanced energy portfolio.
• The reduction in the number of rigs will result in a fewer workers in the industry and its supply chain.
• Because production has remained at a high level, the industry’s contribution to the state GDP may not be as adversely impacted as originally thought.
• Oil and gas companies are evolving in a manner similar to manufacturing and other industries – they are becoming much more efficient. Increased efficiencies are expected to continue and many of the jobs that are being eliminated will not return.

Increased efficiencies will allow American companies to continue to be competitive, which in turn will help the U.S. be an “energy independent” nation. In a convoluted way, the Colorado oil and gas industry may actually benefit in the long run from the recent drop in the price of oil.

Colorado Job Growth Continues to be Solid in April

BLS recently released April wage and salary employment data for Colorado. The job growth is softer than expected given the strength of the U.S. jobs numbers, projected improvement in the growth of the economy (GDP), and the outlook of purchasing managers as measured by the ISM manufacturing and non-manufacturing indices. Given the strength of the U.S. employment data, it seems reasonable for the state to be ahead of last year by 70,000 to 75,000 jobs, even with the slight decreases in the state oil and gas industry.

job growth

In April there were 34,400 jobs (NSA) in the Mining and Logging Sector. This is down about 1,300 jobs from December, 2014 but about 1,800 jobs above the April 2014 total. The sector had record employment this past December.

Looking beyond the oil and gas industries we see that about two-thirds of the job growth this year has been in Health Care; Accommodations and Food Services; Construction; Professional, Scientific, and Technical Services (PST); and Manufacturing.

Approximately 21% of all jobs added were in Leisure and Hospitality. The tourism industry is important to all 64 counties in the state. Colorado had a strong ski season and is poised to have a strong summer season.

About 10% of total jobs added were in the PST, Manufacturing, and Information sectors. These sectors are the source of primary and advanced technology jobs. Primary jobs attract wealth from outside the state that is spent locally, they export a significant portion of their goods and services, and they often pay wages that are much greater than the state average.

Probably the hottest topic on the economic front has been the price of housing and rentals. The Case Shiller Home Price Index for Denver indicates that home prices increased by 10.0% over the past year and 1.4% on a month-over-month basis. Rentals have risen at slightly lower rates.

The comparative strength of the Colorado economy over the past five years has caused labor shortages in key occupations, i.e. it is necessary to attract talent from outside Colorado. Out-of -state workers from some parts of the country will experience sticker shock when they look at home prices in the metro area.

On a positive note, increased appreciation in home prices increases the “paper wealth” of individuals. This will cause home owners and landlords to remain confident in the economy and willing to spend money. The increase in prices, and ultimately property taxes, is a two-edged sword. Property owners don’t like the increase, but schools and local governments will see an increase in funding.

At the moment the increase in housing prices does not appear to have deterred job growth. Stay tuned – that may change! It will continue to be an interesting year for the Colorado economy.

Industry Codes with Leading Output per Employee for Colorado

The following list identifies the leading output per employee categories for Colorado. The list has been extracted from an IMPLAN database, www.implan.com. This database divides output and employment into 440 categories.

IMPLAN is an economic analysis tool that uses input-output analysis in combination with regional specific Social Accounting Matrices and Multiplier Models.

Total output for the model is $488,356,072,817 and employment is 3,235,493. Overall output per employee is $150,937.

There were at least 1,000 workers for each of the top 35 categories. A minimum of 1,000 workers was set because many small categories have a high output per employee that may not be sustainable if they were larger. Characteristics of this group of companies are:
• The range of output per worker is $322,539 to $3,206,588.
• Average output per employee is $562,606.
• Total employment is 190,042. This is 5.9% of the state total.
• Total output was $106,918,935,715. This is 21.9% of the state total.
Most of these categories include companies that provide primary jobs. They are mostly manufacturing or advance technology companies.

There were 132 categories with average output per employee greater than $322,539. Each of these categories had fewer than 1,000 workers.
• Total employment is 34,786. This is 1.1% of the state total.
• Total output was $47,425,590,085. This is 9.7% of the state total.
• Average output per employee is $1,363,337.20.
As was the case with the above category, most of these categories include companies that provide primary jobs.

Finally, there were 238 categories with average output per employee less than $322,539.
• Total employment is 3,010,664. This is 93.0% of the state total.
• Total output is $334,011,547,017. This is 68.4% of the state total.
• Average output per employee is $110,943.
This group provides a wide variety of companies and industries. Many of the categories with lower output per employee are retail operations or personal or business services. They are important to society for a variety of reasons, but they are drivers of the economy.

There were 35 categories with no employment or output.

Industry Codes with Leading Output per Employee for Colorado

Rank IndustryCode Description Employment Output/Employee % of State Average
1 366 Lessors of nonfinancial intangible assets 1,664 $3,206,588 2,124%
2 234 Electronic computer manufacturing 1,189 $1,485,686 984%
3 55 Fluid milk and butter manufacturing 1,157 $1,430,300 948%
4 32 Natural gas distribution 1,099 $1,363,518 903%
5 133 Pharmaceutical preparation manufacturing 2,156 $1,347,071 892%
6 235 Computer storage device manufacturing 2,049 $1,174,215 778%
7 170 Iron and steel mills and ferroalloy manufacturing 1,518 $1,144,157 758%
8 243 Semiconductor and related device manufacturing 3,176 $1,078,421 714%
9 71 Breweries 3,651 $1,048,101 694%
10 225 Other engine equipment manufacturing 1,673 $920,406 610%
11 31 Electric power generation, transmission, and distribution 6,651 $802,901 532%
12 349 Cable and other subscription programming 3,596 $791,950 525%
13 28 Drilling oil and gas wells 2,823 $768,501 509%
14 70 Soft drink and ice manufacturing 1,956 $736,120 488%
15 190 Metal can, box, and other metal container (light gauge) manufacturing 1,052 $680,582 451%
16 351 Telecommunications 30,489 $670,023 444%
17 24 Mining gold, silver, and other metal ore 2,377 $585,851 388%
18 236 Computer terminals and other computer peripheral equipment manufacturing 1,769 $541,175 359%
19 345 Software publishers 14,165 $496,019 329%
20 283 Motor vehicle parts manufacturing 1,098 $483,561 320%
21 249 Search, detection, and navigation instruments manufacturing 2,520 $481,246 319%
22 248 Electromedical and electrotherapeutic apparatus manufacturing 3,307 $460,979 305%
23 222 Turbine and turbine generator set units manufacturing 1,214 $437,374 290%
24 333 Transport by rail 2,877 $432,021 286%
25 253 Electricity and signal testing instruments manufacturing 1,364 $429,077 284%
26 287 Guided missile and space vehicle manufacturing 6,128 $426,830 283%
27 158 Glass container manufacturing 465 $405,217 268%
28 254 Analytical laboratory instrument manufacturing 1,109 $388,003 257%
29 354 Monetary authorities and depository credit intermediation activities 31,465 $368,257 244%
30 10 All other crop farming 4,425 $361,804 240%
31 251 Industrial process variable instruments manufacturing 1,094 $347,713 230%
32 20 Extraction of oil and natural gas 34,047 $331,039 219%
33 352 Data processing, hosting, ISP, web search portals and related services 8,766 $328,557 218%
34 343 Book publishers 1,133 $325,470 216%
35 305 Surgical and medical instrument, laboratory and medical instrument manufacturing 4,819 $322,539 214%
Other 3,045,450 $125,248 83%
Total 3,235,493 $150,397

The Economic Impact of the Colorado Retail Trade Industry

This post highlights the economic impact of the Colorado retail trade industry on the economies of Colorado and its twelve major metro counties: Adams, Arapahoe, Boulder, Broomfield, Denver, Douglas, El Paso, Jefferson, Larimer, Mesa, Pueblo, and Weld. It was prepared for the Economic Development Council of Colorado in the Spring of 2015.

Retail Trade is classified in the NAICS 44-45 category. The Retail Trade categories used in this report and their IMPLAN sector numbers are listed below. As can be seen Retail Trade includes everybody from American Furniture Warehouse to Burritos to Go in Broomfield.

320 Retail Stores – Motor vehicle and parts
321 Retail Stores – Furniture and home furnishings
322 Retail Stores – Electronics and appliances
323 Retail Stores – Building material and garden supply
324 Retail Stores – Food and beverage
325 Retail Stores – Health and personal care
326 Retail Stores – Gasoline stations
327 Retail Stores – Clothing and clothing accessories
328 Retail Stores – Sporting goods, hobby, book and music
329 Retail Stores – General merchandise
330 Retail Stores – Miscellaneous
331 Retail Nonstores – Direct and electronic sales

economic impact of the colorado retail trade industry

The key employment findings of the report are:
• There are 309,924 direct employees in the industry, including sole proprietors. This is 9.6% of total state employment.
• Overall, there are 439,315 total (direct, indirect, and induced) employees supported by the Colorado Retail Trade Industry.
• The counties with the greatest number of Direct Retail Trade employees are El Paso, Arapahoe, Denver, and Jefferson.

The key output findings of the report are:
• Average GRP per employee for Colorado is $90,658. Average Retail Direct GRP per employee is $68,404.
• The Retail Trade Sector contributes about $21.2 billion, or 7.2%, to the Direct Colorado GRP, $293 billion.
• Overall, the Retail Trade Sector supports $38.3 billion in GRP, or economic activity.
• The counties with the greatest Direct Retail Output are Arapahoe, El Paso, and Denver.
• The counties with the greatest Direct GRP per Direct Employee are Denver, Arapahoe, Boulder.

The key wage findings of the report are:
• The total direct wages are $10.1 billion, or 5.6% of total wages. Average Direct Retail Wages are lower than the average for all industries.
• Overall, the retail trade industry supports total wages of $16.6 billion.
• The counties with the highest average annual wages for Direct Retail are Denver, Arapahoe, and Jefferson.

Other key points follow:
• The Retail Trade Sector is a major employer in Colorado.
• The Bureau of Labor Statistics reports that Colorado has 175,355 establishments. There are 17,035 establishments in the Retail Trade Sector. This is 9.7% of total employment.
• Average wages and output are below the average for other industries.
• It is difficult for states to develop a competency in the Retail Trade sector even though many states and municipalities rely on retail sales taxes to fund their operations. The Colorado Retail Trade Sector has a location quotient slightly less than 1.0.

For a copy of the report click here.

All Jobs are Important to the Economy

All jobs are important to the economy for different reasons.

For example, health care jobs make it possible for us to maintain a high quality of life. Construction jobs allow us to build new homes, commercial space, and maintain and improve the quality of our roads. Tourism jobs make it possible for us to enjoy the mountains, the waterways, and the natural beauty of Colorado.

Primary jobs are particularly important because they bring in wealth from outside the state to produce products that are then exported. Manufacturing jobs, such as those at Vestas or Ball Aerospace, are examples of primary jobs. Quite often primary jobs have higher than average wages.

On the topic of wages…

In 2014, average Colorado private sector wages for all industries were $53,068.

Although 2015 has been a solid year for job growth, there have been concerns the state has been adding too many low-paying jobs and that wage increases have not kept up with inflation.

Through the first six months of 2015 average wage and salary employment for the private sector is 63,500 greater than the same period in 2014.

For the first half of 2014 the leading sectors for job growth were:
• Private Education and Health Care added 15,400 jobs. The sector accounted for 24.3% of total jobs added. Average annual wages for 2014 were $45,879.
• Accommodations and Food Services added 12,900 jobs. The sector accounted for 20.3% of total jobs added. Average annual wages for 2014 were $19,445.
• Construction added 12,700 jobs. The sector accounted for 20.0% of total jobs added. Average annual wages for 2014 were $53,664.
Only the wages for the Construction sector were slightly greater than the state average.

These three sectors accounted for about two-thirds of the jobs added in the first half of 2015. Estimated average annual wages for these sectors was $39,973, based on 2014 average wages.

Average annual wages for the following sectors were below the state average.
• Administrative and Wage Management.
• Arts, Entertainment, and Recreation
• Other Services
• Retail Trade
In the first half of 2015 they accounted for slightly more than 9% of jobs added. Estimated average annual wages for these sectors was $31,677, based on 2014 average wages.

The seven sectors mentioned above accounted for about three-fourths of the job growth in the first half of 2015, yet the average wages for these jobs were about $38,945. This is well below the state average.

The following sectors were responsible for slightly more than one-fourth of the state’s job growth in the first half of the year. All sectors have average annual wages above the state average.
• Corporate Headquarters (MCE)
• Financial Activities
• Information
• Manufacturing
• Natural Resources and Mining
• Professional and Scientific
• Transportation, Warehousing, and Utilities
• Wholesale Trade
Estimated average annual wages for these sectors was $78,685, based on 2014 average wages.

There are several takeaways from Colorado’s wage and job growth in the first half of 2015:
• Jobs and wages don’t expand at an even pace across all industries.
• Strong job growth is not always accompanied by strong wage growth.
• Strong growth in low paying sectors has been accompanied by declines or minimal growth in some higher paying sectors.
• The wage and salary employment data may not be accurately representing actual job growth in the state.

Strong job growth may not translate into increased consumption because average annual wages for many of the additional workers are well below the state average. In turn, the addition of a disproportionate number of lower wage jobs may result in lower than expected tax collections for state and local governments.

All jobs are important, but sometimes higher paying jobs have a greater importance than lower paying jobs.

Economic Impact of the Coal Mining Industry on Yampa-White River Region

This post summarizes the economic  impact of the coal mining industry in the Yampa-White River Region (Moffat County, Rio Blanco County, and Routt County) of Northwest Colorado and the state. It will focus on the two North American Industrial Classification System (NAICS) Sectors 211111 – Bituminous Coal Surface Mining and 212112 – Bituminous Coal Underground Mining, which are included in IMPLAN category 21.

Economic Impact of the Coal Mining Industry

The key employment findings of the report are:
• There are 1,545 direct employees in the Yampa-White River Region working in the coal mining industry. Overall there are 3,149 employees in the Yampa-White River Region working in the coal mining industry (direct, indirect, and induced).
• There are 3,469 direct employees in the state coal mining industry. Overall there are 8,467 employees working in the state coal mining industry (direct, indirect, and induced).

The key output findings of the report are:
• Direct output within the Yampa-White River Region associated with the coal industry is slightly less than $478 million. Direct output within the region associated with the coal industry is slightly less than $701 million (direct, indirect, and induced).
• Direct statewide output for the coal industry is slightly less than $1,052.1million. Direct statewide output for the coal industry is $1,838.0 million (direct, indirect, and induced).

To gain an appreciation for what these numbers mean and the impact of the coal mining industry, it is important to put them in perspective.
• At the state level, the coal mining industry is small. It is one of 405 industries, it accounts for .11% of total direct employment and .37% of total direct output. The industry has a higher than average output for employee level than other industries.
• At the industry level, the Yampa-White River Region employs 44.5% of the direct employees in the state’s coal mining industry. In addition, it accounts for 45.5% of the state’s direct coal mining output.
• At the regional level, the coal mining industry accounts for 4.6% of the region’s total direct employees, but it is responsible for 17.4% of the region’s total direct output. Clearly, output per worker for the sector is greater than the average.
• There are 188 industries in the Yampa-White River Region compared to 405 for the state. The region is less diversified than the state, which accentuates the importance of dominant role the coal mining industry plays in the Yampa-White River economy.
• Average wages, without supplements, for the region are $84,544 for surface mining and $90,132 for underground mining. Average wages are well above the state average for all industries. About 73% of the direct workers in the region are wage and salary employees.

The report was funded by the Economic Development Council of Colorado and local economic development organizations. For a full copy of the report, please click here.

Where is the Colorado Oil and Gas Industry Headed?

There has been concern by some that the freefall in the price of a barrel of oil last year would cause a sharp downturn in the Colorado economy.

In fact, the University of Colorado Leeds School of Business has projected that the loss of oil and gas jobs will cause total employment to grow at a rate less than 2.0% this year. That means that average employment for the year would be less than 50,000. It would also mean that average job growth for the last three quarters of the year would be at most 41,000 jobs.

The 2015 cber.co forecast projected a slight decline in the rate of growth (+73,000 to 79,000 jobs), in part because of uncertainty in the oil and gas industry. It seems unlikely the decline will be as severe as projected by the Leeds School.

A frequently quoted data set is rig count. The data shows a sharp drop-off in the number of rigs. The immediate reaction is that “the sky is falling.”

Industry experts state this decline in the number of rigs has occurred, in part, because companies have taken their older and poorer performing rigs off-line to increase their efficiency. This is no different than the Denver Broncos cutting Champ Bailey. A decrease in the number of rigs will eventually point to a decline in the number of employees.

In addition, some companies are adopting improved technology, which has the potential to make the drilling process much more efficient and environmentally friendly. Increased efficiency means that when some of these jobs go away they won’t ever come back. In that sense, the oil and gas industry is moving down the same path as manufacturing and other industries.

Colorado Oil and Gas Industry

Another interesting data set is oil production.

Colorado oil production reached records levels in 2014 and is expected to remain strong through Q1 2015. Levels of production may drop off in Q2 as storage becomes an issue.

Colorado Oil and Gas Industry

Another issue affecting production levels is demand. Global demand for oil has been declining as alternate sources of energy have become more available. In addition, more efficient automobiles and other devices have reduced consumption. Despite the decline in demand, the U.S. has become less dependent on foreign countries for our oil supplies. In turn that will drive demand for U.S. oil.

Looking ahead – employment in the Colorado oil and gas industry will either grow at a slower rate or decline slightly in 2015. The state economy is on solid enough footing that many of those lost jobs will be offset by increases in other industries such as construction, finance, and manufacturing.

In short, the Colorado Oil and Gas Industry is in a state of flux, but it is unlikely that volatility will cause a noticeable downturn in state employment.

Q1 2015 Colorado Employment Posts Solid Growth

On April 21, the Bureau of Labor Statistics released its monthly wage and salary employment data for Colorado. Job growth for Q1 2015 was 3.1%, or 74,800 jobs, greater than Q1 2014. The Q1 2015 growth is down slightly from the 2014 annual average of 78,900 jobs; however it is in line with the 2015 cber. co forecast that calls for an increase of 73,000 to 79,000 jobs, or job growth at a rate of 3.0% to 3.2%.

The preliminary March 2015 Colorado employment was 68,900 jobs greater than the March 2014 value. The year-over-previous-year increase for February was 80,800 jobs. It was 74,600 jobs for January.

The lower level of growth in March does not necessarily signify a downward trend. Most likely it is a reflection of volatility related to changes in the extractive industries.

About 67.0% of total jobs added were in the Health Care; Accommodations and Food Services; Construction; Profesional, Scientific, and Technical Services (PST); and Manufacturing sectors.

Approximately 21.3% of all jobs added were in Leisure and Hospitality; however, the BLS estimate model has most likely overstated this YTD contribution.

About 9.9% of total jobs added were in the PST, Manufacturing, and Information sectors. These sectors are the source of primary and advanced technology jobs.

Colorado Employment vs. U.S. Employment

Nationally, average employment for Q1 2015 is about 2,265,133 jobs greater than Q1 2014 employment. While this rate of growth is solid, the Q1 value is less than the average number of jobs added during 2014 (2,313,033). A brutal winter in parts of the country prevented employment and output during the first quarter from being stronger.

The cber.co forecast for U.S. job growth in 2015 is 2,600,000 workers. Stronger job growth is expected in the second half of the year.

us employment Q1 2015