Blog

Stock Market Cycles and Elections

James Carville coined the phrase, “It’s the Economy, stupid” to remind voters in the 1992 presidential campaign about the importance of the economy when casting their ballot.

For many years prior to 1992, members of the executive and legislative branches realized they had a better chance of getting re-elected if they influenced fiscal policy (taxes, incentives, wage and job increases, etc.) to create the perception their leadership was responsible for a healthy economy.

As a result of their manipulation, four-year stock market cycles evolved. The cycle assumes companies, and thus investments, have a stronger performance in the second half of a president’s term and a weaker performance in the first half.

This short analysis looks at the performance of the Standard & Poor’s 500 Index (S&P 500) for the presidential terms from 1952 to 2016. Obviously the period 2013 to 2016 is still in progress; however, a case can be made that the current bull market will not follow the above mentioned trends.

Fifteen stock market cycles were evaluated. The average time from peak to peak was 1,534 days or 4.2 years and the average time from trough to trough was 1,509 days or 4.1 years.

The two tables that follow look at the peaks and troughs and the year they occurred for each of the presidential terms.

The first table looks at the peaks.
• Year 1 – 3 peaks.
• Year 2 – 3 peaks.
• Year 3 – 2 peaks.
• Year 4 – 7 peaks.
Sixty percent of the peaks occurred during the second half of the presidential term.

Presidential Term Date S&P Change Up Annualized % Change Up # of Days Up Year Up
1953-1956 9/14/1953 22.71
8/3/1956 49.64 26.93 31.10% 1,054 Year 4
1957-1960 10/22/1957 38.98
1961-1964 12/12/1961 72.64 33.66 16.20% 1,512 Year 1
6/26/1962 52.32
1965-1968 2/9/1966 94.06 41.74 17.60% 1,324 Year 1
10/7/1966 73.2
11/29/1968 108.37 35.17 20.00% 784 Year 4
1969-1972 5/26/1970 69.29
1973-1976 1/11/1973 120.24 50.95 23.30% 961 Year 2
10/3/1974 62.28
9/21/1976 107.83 45.55 32.10% 719 Year 4
1977-1980 3/6/1978 86.9
11/28/1980 140.52 53.62 19.20% 998 Year 4
1981-1984 8/12/1982 102.42
1985-1988 8/25/1987 336.77 234.35 26.60% 1,839 Year 3
12/4/1987 223.92
1989-1992 7/16/1990 368.95 145.03 21.00% 955 Year 1
10/11/1990 295.46
1993-1996 2/2/1994 482 186.54 15.90% 1,210 Year 2
4/4/1994 438.92
1997-2000 7/17/1998 1,186.75 747.83 26.10% 1,565 Year 4
8/31/1998 957.28
3/24/2000 1,527.45 570.17 34.80% 571 Year 4
2001-2004 10/9/2002 776.76
2005-2008 5/19/2008 1,426.63 649.87 11.40% 2,049 Year 4
2009-2012 3/9/2009 676.53
11/3/2010 1,363.61 687.08 52.70% 604 Year 2
8/2/2011 1,099.23
2013-2016 5/21/2015 2,130.82 1,031.59 19.00% 1,388 Year 3

The second table looks at the troughs..
• Year 1 – 3 troughs.
• Year 2 – 10 troughs.
• Year 3 – 2 troughs.
• Year 4 – 0 troughs.
About 87% of the troughs occurred during the first half of the presidential term. This suggests that fiscal policy in the third or fourth year of a presidential term may have prevented or postponed economic weakness for that year, but it mostly likely have kicked the can forward to the first half of the subsequent presidential term. In some cases pushing the weakness forward had a detrimental impact on the economy.

Presidential Term Date S&P Change Down Annualized % Change Up # of Days Down Year Down
1953-1956 9/14/1953 22.71 Year 1
8/3/1956 49.64
1957-1960 10/22/1957 38.98 -10.66 -18.00% 445 Year 1
1961-1964 12/12/1961 72.64
6/26/1962 52.32 -20.32 -45.70% 196 Year 2
1965-1968 2/9/1966 94.06
10/7/1966 73.2 -20.86 -31.70% 240 Year 2
11/29/1968 108.37
1969-1972 5/26/1970 69.29 -39.08 -26.00% 543 Year 2
1973-1976 1/11/1973 120.24
10/3/1974 62.28 -57.96 -31.70% 630 Year 2
9/21/1976 107.83
1977-1980 3/6/1978 86.9 -20.93 -13.80% 531 Year 2
11/28/1980 140.52
1981-1984 8/12/1982 102.42 -38.1 -16.90% 622 Year 2
1985-1988 8/25/1987 336.77
12/4/1987 223.92 -112.85 -77.10% 101 Year 3
1989-1992 7/16/1990 368.95
10/11/1990 295.46 -73.49 -60.60% 87 Year 2
1993-1996 2/2/1994 482
4/4/1994 438.92 -43.08 -42.90% 61 Year 2
1997-2000 7/17/1998 1,186.75
8/31/1998 957.28 -229.47 -82.50% 45 Year 2
3/24/2000 1,527.45
2001-2004 10/9/2002 776.76 -750.69 -23.30% 929 Year 2
2005-2008 5/19/2008 1,426.63
2009-2012 3/9/2009 676.53 -750.1 -60.40% 294 Year 1
11/3/2010 1,363.61
8/2/2011 1,099.23 -264.38 -25.10% 272 Year 3
2013-2016 5/21/2015 2,130.82

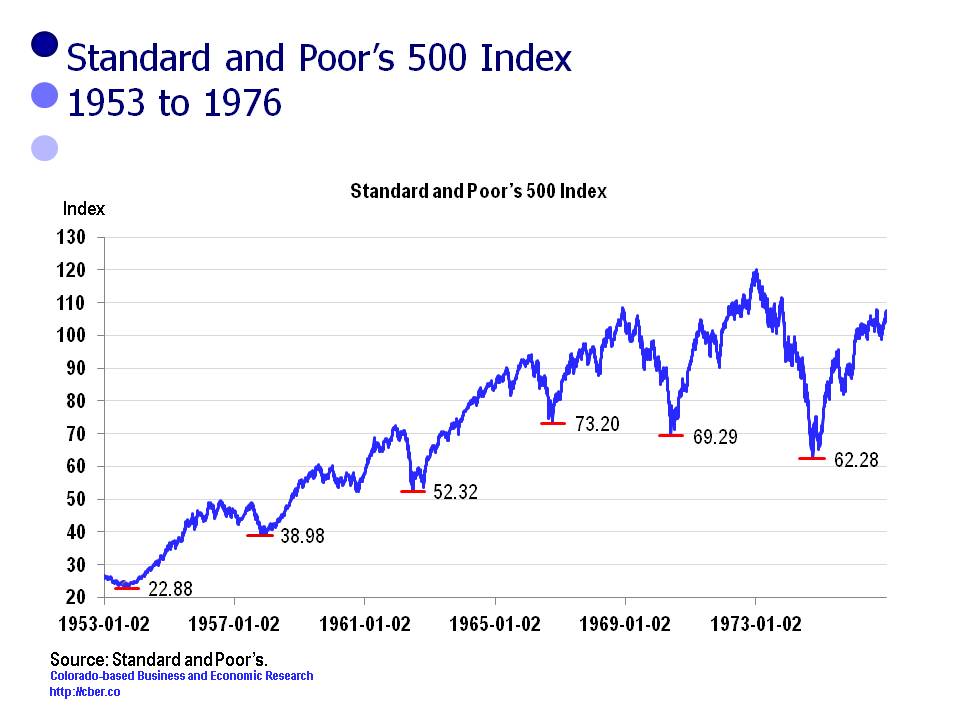
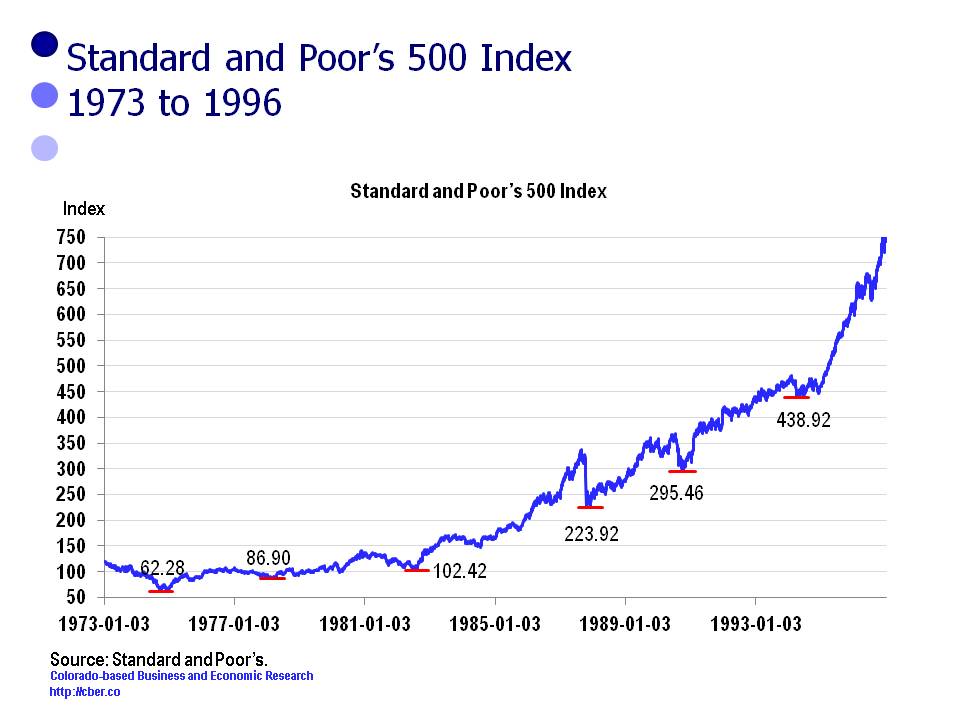
The following three charts show the daily performance of the S&P 500 for 1953 to 1976, 1973 to 1996, and 1993 to 2016.

The average number of days for periods of growth were longer than the downturns, 1,169 days compared to 357 days. The moral of the story is that growth occurs steadily over time, but losses are usually quick and painful.

stock market cycles and elections

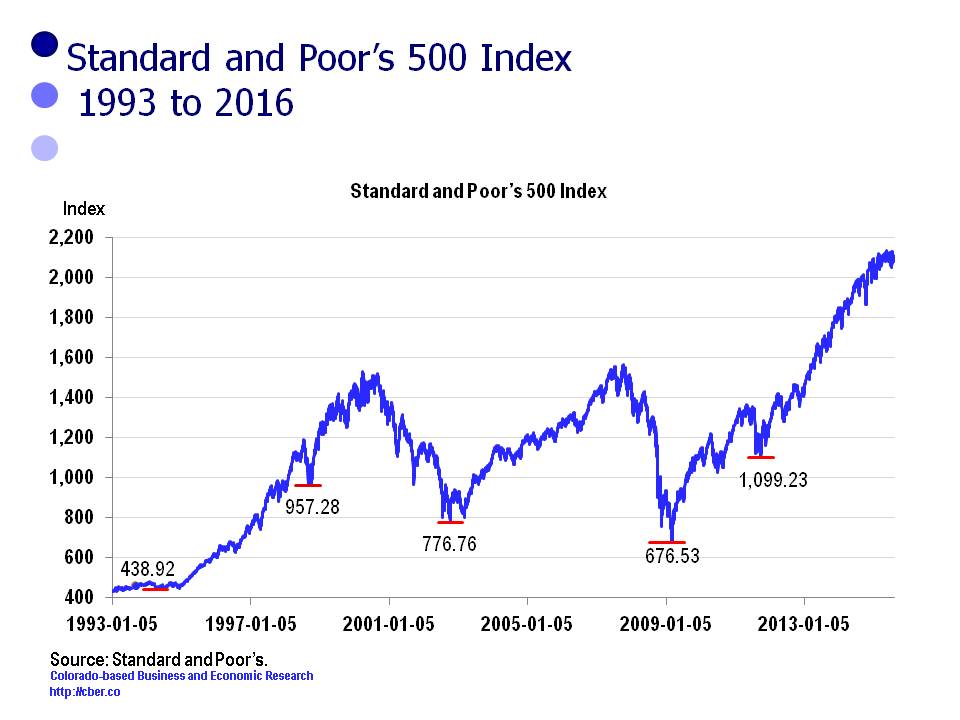
In addition, the average increase in the S&P 500 was 300 points during positive cycles, compared to 173 points for the down cycles.

stock market cycles and elections

The most severe absolute decline in the S&P 500 ended on March 9, 2009 when the index closed at 676.53. Over the previous 294 days the index plummeted 750.10 points, an annualized change of -60.4%.

The current bull market will most likely be the strongest for the period 1952-2016. The bull market that started on March 9, 2009 was also notable. It ended on November 3, 2010 when the S&P 500 closed at 1,363.61. Over 604 days the index recaptured 687.08 points that it had lost, an annualized gain of 52.7%.

stock market cycles and elections

What Are the Real Challenges Facing the Extractive Industries?

The extractive industries have been a critical part of the Colorado economy for more than 150 years. The sector has been responsible for high-paying jobs in rural areas that have in turn stimulated growth in other sectors. In addition, the fuel, minerals, and metals have been utilized in ways that have improved our quality of life and made the United States a leader in innovation.

In 2014, the estimated value of the state’s extractive industries was projected to be $17.2 billion, broken down as follows:
• $7.0 billion – natural gas
• $6.7 billion – crude oil
• $2.2 billion – minerals
• $0.9 billion – coal
• $0.4 billion – carbon dioxide.

Despite its importance, the extractive industries have faced significant challenges.

“The Event”

For many years, the extractive industries were allowed to focus almost exclusively on extraction. Without regulation, pressure from industry members, or outside groups, insufficient attention has been paid to the impact of the extraction process.

This was evident when waste from Gold King Mine, near Silverton, recently spilled into Cement Creek. The plume of dirty, yellow water slowly made its way into the Animas River, which flows through Durango, Colorado and Farmington, New Mexico on its way to Lake Powell.

“The event” included a spill that contained a variety of pollutants and it was reported to be similar in volume to six Olympic- sized swimming pools. Within a week, the plume had passed through New Mexico. In Durango the pollutants either settled to the bottom of the river or the volume in the Animas River was great enough to dilute them or push them downstream. As a result, water tests indicated the concentration of pollutants had returned to acceptable pre-event levels – whatever that means.

The reaction to “the event” has been varied:
• Some think it is a disaster, catastrophe, and travesty.
• Initially, some were concerned because of the damage to the environment. As soon as the governor drank from the river, they rearranged their priorities and became concerned about the damage to local rafting companies and tourism businesses.
• Others have taken a wait and see attitude. They have asked, “What is the long-term damage?”
• There are a group of people who are focused on they blame game. They want to blame the mining industry, political parties, special interest groups, and government for “the event”. Others have gone so far as to speculate that “the event” was planned as a part of a conspiracy between the government and mining companies.
• From a historical perspective, “the event” is old news. For decades there have been pollutants in the Animas River as a result of runoff (Mother Nature) and leakage from mines. It wasn’t that long ago that the Smelter Mountain Mill, located in the south end of Durango, produced uranium for the Manhattan project.

Colorado Geological Survey

The website of the Colorado Geological Survey addresses the challenges they face in overseeing the industry.

“Prior to 1977 there were virtually no laws in the United States requiring that mines be reclaimed when mining was completed. Today the Colorado Division of Reclamation Mining and Safety is responsible for assuring that mined lands are restored under the Colorado Mined Land Reclamation Act and the Colorado Land Reclamation Act for the Extraction of Construction Materials. However, prior to those laws, when mining was completed, the companies just walked away leaving piles of waste and dug out holes. Thus, Colorado was left with an estimated 23,000 abandoned mine lands (AML).

Abandoned mines present very dangerous physical hazards to the public. High priority physical hazards identified by the Colorado Geological Survey for the USFS AML inventory are being jointly mitigated by the USFS and the Colorado Division of Reclamation, Mining, and Safety (DRMS). Mine workings are notorious for containing “bad air” including carbon monoxide, carbon dioxide, and hydrogen sulfide. These gases can kill unwary explorers of these old mines by asphyxiation. The old workings and structures can be very unstable and collapse without warning. Dangerous sites close to public access are being safeguarded through filling, capping, or gating the abandoned mine openings with engineered structures.”

Addressing the Challenges

Many in the state and the Four Corners areas will focus on the perspectives mentioned above.  The verbiage from  the Colorado Geological Survey shows this is not a simple problem, with a simple solution.

Colorado’s extractive industries are critical to the state’s economy and to the security and innovative leadership of the United States. Oil and coal are the backbone of the country’s transportation and utilities system. Rare and heavy metals are essential for the aerospace, biosciences, renewable energy, health care, transportation, defense, and environmental industries.

It is necessary for the country, including Colorado, to continue to drill for oil and gas and extract minerals and metals from the earth. Since 1977, government agencies and companies have been held to stricter standards for monitoring the impact of the extraction process. As has been recently demonstrated in Silverton, the efforts to monitor and manage pollutants are not perfect. The important point is that efforts are being made and they will be improved after “the event.”

With good fortune and sufficient funding, the state will remain diligent in its efforts to deal with the 23,000 abandoned mines.

Good luck to the local, state, and federal officials, agencies, companies, and special interest groups who will address the challenges facing the extractive industries in the years ahead.

Challenges Facing the Extractive Industries
The Animas River in Farmington, New Mexico as the plume of water from the Gold King Mine passed through town.

U.S. Job Growth Remains Strong

On August 7th, the Bureau of Labor Statistics released its monthly update for U.S. nonfarm payroll employment. The number of jobs increased by 215,000 in July and U.S. job growth falls in the solid-to-strong category.

The areas with the largest increases were retail trade, health care, professional and technical services, and financial activities.

Average U.S. employment for the first seven months of 2015 is 3.1 million greater than the same period in 2014. That is about 256,000 net new jobs per month.

If job gains continue at the current pace, average annual wage and salary employment for 2015 will be about 142 million. As a point of reference, the 2015 population will be about 322 million.

Throughout 2015, U.S. employment has continued to post steady gains (month-over-month prior year) although there has been a slight downward trend since the change in employment peaked in February.

This downward trend is thought to be normal volatility and not a cause for concern. Even with the decrease, the number of jobs added this year will be well above the 2014 total.

All eyes are on the Fed and how they will interpret the latest news from BLS. They would like to see strong job and wage growth before they start raising interest rates; however it is most essential for them to see sustained, solid U.S. job growth. Unfortunately, for workers wage growth is less critical.

The consensus among most economists is that gradual rate hikes will begin in September.

The bottom line – the Fed will raise interest rates and U.S. employment will increase by 3.1 million this year. At this point, both are positive signs for the U.S. economy.

U.S. Job Growth


Economic Risks at the National Level That Might Affect Colorado

The U.S. economy is currently stronger than it was in 2014. The good news is the Colorado is outperforming the U.S. in three key areas:
• The Colorado rate of population growth in 2015 is projected to be 1.6% vs. 0.7% for the U.S.
• The Colorado rate of job growth in 2015 is currently projected to be 3.0% vs. 2.2% for the U.S.
• The recently released GDP data shows that Colorado outperformed the U.S. in the rate of growth, 4.7% vs. 2.2% in 2014.

Currently, the strengths of the national economy outnumber the economic risks. With that in mind this post reviews the manner in which the risks might impact the Colorado economy. For each risk the impact on Colorado is highlighted in italics.

The Economic Risks

The Fed – Janet Yellen indicated there are still issues with the labor market. These concerns include finding trained workers and weak wage growth.

Colorado’s low unemployment rate has caused companies to have difficulty finding trained workers in such industries as construction and the high tech sector. Areas of strong wage growth have occurred in occupations where there is high demand for workers.

Real GDP – The rate of growth in business investments is lackluster. Increased demand for goods and services will drive companies to invest in new equipment, software and buildings.

The decrease in the price of oil has caused Colorado companies in the Oil and Gas industry to curtail investments in their business.

The Dollar – The strong dollar has made U.S. goods/exports less competitive in foreign markets.

The strong dollar is one of many factors that could challenge Colorado exporters in 2015.economic risks

Industry Sentiment – Manufacturing may remain sluggish through the end of the year.

The growth of Colorado manufacturing output was disappointing in 2014. That is unlikely to change in 2015.

Housing – In some parts of the country the rate of housing price appreciation may be problematic.

It will be more difficult to find attainable and affordable housing as a result of the sharp increases in housing prices. These rising prices will cause the state’s rate of inflation to increase.

Price of Oil – Low oil prices have benefited consumers (lower prices at the pump) and some industries, but they have hurt the extractive industries.

Through the first half of the year, consumers have saved about $480 with lower gasoline prices. Currently, it is not possible to measure the impact of cheaper oil on the Oil and Gas industry.

International Situations – The current global situational and foreign policy challenges to the U.S. economy currently include Iran, Syria, China, Russia, Greece, Israel, Cuba, the EU, and Ukraine.

At the moment Colorado shares a level of risk similar to the U.S. as a result of situational and foreign policy challenges.

The strengths of the national economy have created momentum that will further strengthen the U.S. and Colorado moving into 2016; however, if several of these economic risks materialize at the same time, then the health of the U.S. and Colorado economies might be jeopardized.

Colorado Economy On Track to Add At Least 68,600 Jobs in 2015

At the midpoint of the year the U.S. economy is on solid footing and the second half of the year will be much stronger than the first half. The Colorado economy continues to outperform the U.S. in its rate of growth for population, employment, and GDP.

Key Data Points for the U.S.
Real GDP – Q2 will be stronger. Annual growth will be 2.5% to 2.9% in 2015.
Retail Sales – Up 1.3% for 6 months, projected to be up 3.0% for 2015.
U.S. Employment – The U.S. is on track to add 3.1 million jobs this year.
Unemployment Rate – 5.3%, down from 6.1% a year ago, 8.3 million unemployed, trending down.
ISM Indices –Manufacturing is sluggish and expected to remain that way; Non-Manufacturing is steady and well above 50.
Price of a Barrel of Oil (WTI) – Since mid-March it has varied from $43 to $61. Currently in the low 50s, but trending down.
Construction – For 6 months, employment up 4.2%, weekly earnings up 3.0%.
Case Shiller Housing Prices – U.S. prices up 4.2% from a year ago.
Dow Jones Industrial Average – On July 17rd the DJIA was 18,086, up 1.5% from 17,823 at the end of the year.

Average Colorado employment is 68,600 greater than the same period last year, with the potential of being revised upward at a later date.

Colorado Economy

As has been the case in the past, the sectors with the top job growth are: Health Care; Accommodations and Food Services (part of the Tourism Industry); Construction; Professional, Scientific, and Technical Services; and Manufacturing. These sectors accounted for about 72% of total job growth in the first half of 2015.

The Bureau of Economic Analysis has released the 2014 Gross Domestic Product for Colorado. The state’s Real GDP expanded at a rate of 4.7% compared to 2.2% for the U.S.

Key Data Points for Colorado
QCEW Revisions – Recent revisions to Q4 2014 could cause 2014 employment to be revised upward in the March 2016 benchmark revisions. There was stronger momentum coming into 2015 than originally anticipated.
Population – Colorado’s population will increase by 88,800 people this year.
Unemployment Rate – 4.4%, down from 5.0% a year ago.
MSA Unemployment Rate – Boulder and Ft. Collins have the lowest rates at 3.5% and 3.6% respectively.
2014 Colorado GDP – The state Real GDP grew by 4.7% in 2014 compared to 2.2% for the U.S.
2014 Contribution to GDP Growth – The Mining sector accounted for 6.2% of GDP and 18.2% of GDP growth in 2014.
Wage and Salary Employment – On average Colorado has added 68,600 jobs this year based on current data. This is not adjusted for the projected revisions.
Leading Sectors for Growth – About 72.2% of the jobs have been added in the Health Care; Construction; Accommodations and Food Services; Professional, Scientific, and Technical Services; and Manufacturing.

For details or more information about the Colorado economy, check out the 2015 cber.co forecast and economic updates on this website, https://cber.co.

The Strengths of the National Economy will Impact Colorado

The U.S. economy is currently stronger than it was in 2014. The good news is the Colorado economy is outperforming the U.S. economy in three key areas:
• The Colorado rate of population growth in 2015 is projected to be 1.6% vs. 0.7% for the U.S.
• The Colorado rate of job growth in 2015 is currently projected to be 3.0% vs. 2.2% for the U.S.
• The recently released GDP data shows that Colorado outperformed the U.S. in the rate of growth, 4.7% vs. 2.2% in 2014.

Currently, the strengths of the national economy outnumber the risks. With that in mind this post reviews the manner in which these strengths will impact the Colorado economy.  For each strength the impact on Colorado is highlighted in italics.

The Fed – Janet Yellen has indicated the Federal Reserve is confident the U.S. economy is performing well enough that interest rates can be raised.

Colorado has experienced stronger economic growth than the nation throughout the first half of the year. The state will continue to experience solid growth in the second half of the year.

Real GDP – After a weak start in Q1, Real GDP growth for the year is projected to be in the 2.5% to 2.9% range – better than last year.

In 2014, Colorado’s rate of Real GDP growth was more than twice that of the U.S. Solid growth is expected to continue in 2015.  strengths of the national economy - retail

Retail – The woes of Q1 seem to be behind us. Consumer spending is expected to be stronger in the second half. This may lead to strong back-to- school sales – a significant source of sales for retailers.

The Colorado economy had strong momentum coming into 2015. It did not experience problems felt elsewhere in Q1. Population and job growth will drive continued solid retail growth in 2015.

Jobs – The U.S. is on track to add more than 3.0 million jobs this year. The unemployment rate and the long-term unemployment rate have continued to decline.

As the year has progressed, U.S. job growth has increased at a solid, but decreasing rate. A similar trend may be happening in Colorado.

Consumer Sentiment – According to the Consumer Sentiment Survey, consumers are upbeat.

The mood of shoppers in the malls and the waiting times at local restaurants suggests that Coloradans are upbeat about the economy.

Industry Sentiment – Purchasing managers have a positive outlook for both goods and services. Manufacturing is more sluggish and may remain that way through the end of the year.

Continued optimism in the non-manufacturing sectors points to ongoing solid growth for these sectors and the Colorado economy.

Inflation – Inflation is below the Fed’s target rate of 2.0%. As interest rates increase, inflation will approach the target rate.

The increase in Colorado housing prices will cause the state’s rate of inflation to further exceed that of the nation.

Construction – There is strong activity in both the residential and non-residential markets. Construction job growth will be constrained by the lack of trained workers.

Despite the lack of trained construction workers, Colorado’s construction industry is responsible for about 18% of the jobs added in 2015.

Housing Prices – The housing market remains strong – too strong in some areas.

Home owners like having greater equity and local governments benefit from higher property taxes.

These strengths of the national economy have created momentum that will strengthen the U.S. and Colorado into 2016.

Gas Prices – Lower Costs at the Pump

About a year ago, the price for a barrel of oil dropped like a rock. Consumers salivated because they knew lower gas prices were on the horizon. In the 2015 cber.co Colorado Economic Forecast it was projected that consumers would save an average of one dollar a gallon from lower prices at the pump, or a total of $780.

The following calculations were made to determine the difference in cost to purchase gasoline for the periods July to June (2013-14 and 2014-15). The annual cost assumes that a person fills a car with 15 gallons of gas per week, or 780 gallons per year.

The costs and the savings for the United States are listed below.
2013-14
• 780 gallons, average price per gallon $3.51
• Total cost = $2,774.69
2014-15
• 780 gallons, average price per gallon $2.88
• Total cost = $2,281.63
• The 2014-15 costs were $493.05 less than 2013-14.

gas prices

The costs and the savings for Colorado are listed below.
2013-14
• 780 gallons, average price per gallon $3.41
• Total cost = $2,692.02
• The costs in Colorado were $82.67 less than the U.S.
2014-15
• 780 gallons, average price per gallon $2.80
• Total cost = $2,213.51
• The costs in Colorado were $68.12 less than the U.S.
• The 2014-15 costs were $478.51 less than 2013-14.

Check back in six months to see if gas prices remained low and how much lower they were than last year.

Source: EIA.gov – All Formulations and All Grades.

Advanced Technology Cluster Contributes 17.8% to GDP Growth

In early June the Bureau of Economic Analysis released Gross Domestic Product at the state level for two-digit NAICS Codes.

Since 1997 Colorado Real GDP has grown at a faster rate than the Real GDP for the U.S. (Sum of States) in 11 of 17 years. The 2014 U.S. rate of growth was 2.2% compared to 4.7% for Colorado.

Since 1997 Colorado Real GDP has grown at a faster rate than the U.S. (Sum of States), 2.8% vs. 2.1%.

There were 12 sectors that lost share in 2014, i.e. their percent of contribution for these sectors was less than their percent of the 2014 total. Collectively, they accounted for 72.9% of the 2014 GDP and 53.5% of the change in the GDP. It was disappointing that the proxy for Colorado’s advanced technology cluster only contributed 17.8% to state’s GDP.

The following table shows the sectors, their percentage of the 2014 GDP and their contribution to the GDP.

Sector % of 2014 Total % of 2014 Contribution
Educational services 0.7% 0.6%
Agriculture, forestry, fishing, and hunting 1.1% 0.3%
Other services, except government 2.3% 1.8%
Administrative and waste management services 3.0% 2.9%
Retail trade 5.4% 3.9%
Finance and insurance 5.6% 3.1%
Health care and social assistance 6.0% 5.8%
Manufacturing 7.1% 6.8%
Information 7.2% 2.9%
Professional, scientific, and technical services 8.9% 8.1%
Government 12.1% 4.8%
Real estate and rental and leasing 13.5% 12.4%

There are concerns regarding the level of contribution for the five sectors that have the greatest share of the state’s GDP. The top sectors are:
• Real Estate 13.5%
• Government 12.1%
• Professional, scientific, and technical services, 8.9%
• Information 7.2%
• Manufacturing 7.1%
These five sectors accounted for 48.8% of the 2014 GDP; however they only contributed 35.0% of the 2014 GDP growth.

Of specific concern is the fact that PST, Information, and Manufacturing accounted for 23.2% of the state’s 2014 GDP, yet these 3 sectors only contributed 17.8% of the growth of the GDP. These three sectors are a proxy for the state’s advanced technology cluster, a cluster that is supposed to provide the state with a competitive advantage.

Despite these concerns, the level of Real GDP Growth in 2014 provided significant momentum for the Colorado economy moving into 2015.

GDP losing share - Advanced Technology Cluster

Mining Sector Largest Contributor to State’s GDP in 2014

In early June the Bureau of Economic Analysis released Gross Domestic Product at the state level for two-digit NAICS Codes.

Since 1997 Colorado Real GDP has grown at a faster rate than the Real GDP for the U.S. (Sum of States) in 11 of 17 years. The 2014 U.S. rate of growth was 2.2% compared to 4.7% for Colorado. The Mining Sector played a major role in Colorado’s higher rate of growth this past year.

Since 1997 Colorado Real GDP has grown at a faster rate than the U.S. (Sum of States), 2.8% vs. 2.1%.

There were 8 sectors that gained share in 2014, i.e., their percent of contribution to GDP was greater than their percent of the 2014 total GDP. Collectively, they accounted for 27.1% of the 2014 GDP and 46.5% of the change in the GDP.

The following table shows the sectors, their percentage of the 2014 GDP, and their contribution to the GDP.

Sector % of 2014 Total % of 2014 Contribution
Arts, entertainment, and recreation 1.3% 1.8%
Utilities 1.5% 3.0%
Management of companies and enterprises (MCE) 2.1% 2.9%
Transportation and warehousing 2.8% 2.9%
Accommodation and food services 3.2% 3.4%
Construction 4.4% 8.6%
Wholesale trade 5.5% 5.7%
Mining 6.2% 18.2%

Key points about the contribution of these sectors to GDP growth are listed below.
• The Mining Sector was the major driver in the growth of the state’s GDP, accounting for 18.2% of the change. Volatility in the price of a barrel of oil could potentially have a major impact on this sector’s level of contribution to the 2015 GDP.
• The contribution of the Construction Sector has been driven by a mix of sustained residential and nonresidential growth.
• The combination of the Arts, Entertainment, and Recreation and the Accommodation and Food Services sectors are commonly referred to as Tourism or Leisure and Hospitality. In 2014 the Tourism sector accounted for 4.5% of the GDP% and 5.2% of its growth. Tourism is an important part of the economy for each of the state’s 64 counties.
• The Utilities sector is small, but it experienced growth in 2014 because of strong overall employment and population growth. In addition, GDP growth increased because there was a significant gain in the number of business establishments in 2014.
• The increase in the MCE sector is a result of a 4.5% increase in the number of MCE establishments. In other words more businesses translated into greater GDP growth.
• Both the Wholesale Trade and the Transportation and Warehousing Sectors are small industries. In 2015 they experienced greater than usual gains in employment, which in turn meant stronger GDP growth.

With 4.7% Real GDP growth in 2014, the state economy had significant momentum moving into 2015. Through the first six months of the year, the state has capitalized on that momentum.

gdp gaining share - mining sector

National Park System Crucial to Colorado Tourism

The National Park Service website indicates the Colorado tourism industry benefits from 13 national parks. These sites attract more than 6 million visitors annually with an economic benefit of about $375 million to Colorado.

Park Service Type Name Location State(s)
National Historic Site Bent's Old Fort LaJunta CO
National Park Black Canyon Of The Gunnison Montrose CO
River Corridor Cache La Poudre Colorado CO
National Historic Trail California Trail CO
National Monument Colorado Fruita CO
National Recreation Area Curecanti Gunnison CO
National Monument Dinosaur Vernal, UT & Dinosaur, CO CO and UT
National Monument Florissant Fossil Beds Florissant CO
National Park & Preserve Great Sand Dunes Mosca CO
National Monument Hovenweep Blanding, UT & Cortez, CO CO and UT
National Park MesaVerde Cortez and Mancos CO
National Historic Trail Old Spanish Trail AZ,CA,CO,NV,NM,UT
National Historic Trail Pony Express Trail CA,KS,MO,NE,NV,UT,WY
National Park Rocky Mountain Estes Park and Grand Lake CO
National Historic Site Sand Creek Massacre Kiowa County CO
National Historic Trail Santa Fe Trail CO,KS,MO,NM,OK
National Monument Yucca House Cortez CO

Colorado tourism

Headwaters Economics recently released their 2014 interactive economic impact report for the entire NPS system. In 2014 the 11 Colorado sites, that data is tracked for, had 6.1 million visitors with spending of $379 million.

Site Visitations Spending Jobs Income from Spending
Bent's Old Fort 24,555 $1,377 21 $546
Black Canyon Of The Gunnison 183,046 $10,948 148 $5,093
Colorado 416,862 $25,301 386 $9,972
Curecanti 931,368 $38,729 522 $16,391
Dinosaur 250,624 $14,298 194 $5,736
Florissant Fossil Beds 63,298 $3,550 55 $1,946
Great Sand Dunes 271,774 $15,755 234 $6,104
Hovenweep 26,808 $1,620 23 $622
Mesa Verde 501,563 $49,982 742 $19,580
Rocky Mountain 3,434,750 $217,020 3,282 $123,180
Sand Creek Massacre 7,402 $415 7 $113
Total 6,112,050 $378,995 5,614 $189,283

Locals are an important part of the Colorado tourism sector; however, they benefit from the industry much more than they contribute to it. In 2014 the Headwaters data showed:
• Colorado locals accounted for 11.1% of NPS tourism visitors.
• NPS Tourism spending by locals was 3.3% of the total for Colorado.
• About 1.2% of NPS tourism jobs were supported by local tourism spending.
• Locals accounted for 2.7% of the NPS income generated from tourism spending.

The contribution of NPS visitors to the Colorado economy is impressive; however, a recent report by Dean Runyon showed it is a small part of the total Colorado tourism industry. The report stated that a record 71.3 million visitors spent $18.6 billion in Colorado in 2014.yall

The next time you hear a Texas accent that sounds out of place, have an out-of-state driver cut you off because they are lost, or have to follow a Winnebago up a mountain pass at 25 mph – be glad they are here. Their spending in our state helps support our infrastructure and make our lifestyle even better.