Blog

Expect Solid Growth in Colorado Wage and Salary Employment

The U.S. economy remains on solid footing  in anticipation of the upcoming release of BLS Colorado wage and salary employment data.

U.S. Employment and GDP

Earlier this month BLS reported the U.S. added 126,000 jobs in March compared to February. This was the weakest level of month-over-previous-month job growth for the seasonally adjusted data since 2013. Despite the slower rate of growth for March 2015, U.S. employment for March is about 2.29 million jobs greater than March 2014..

Currently, Colorado wage and salary employment is about 1.8% of the U.S. total. About 2.8% of U.S. job growth can be attributed to Colorado.

Most economists think U.S. Real GDP growth will be in the neighborhood of 2.5% to 3.0% this year. This past week The Conference Board bumped its 2015 projection for the U.S. output growth up to 2.9% based on projections for stronger personal consumption. This is notable given their conservative estimates over the past ten years. Meanwhile, other economists have bumped their forecasts down to the range of 2.5% to 3.0%

Stronger output growth should translate into a greater number of wage and salary workers. In other words, the slower rate of U.S. job growth in March appears to be a glitch rather than the start of a downward trend. The strong rate of U.S. job and output growth will ensure that in the short term Colorado with continue to add jobs at a rate similar to the past twelve months.

U.S. and Colorado Unemployment Rates

In March the U.S. unemployment rate remained steady at 5.5%, but down from 6.6% a year ago.

The U.S. Congressional Budget Office has indicated the natural rate of unemployment is currently 5.2%. The natural rate is the point of equilibrium or the rate at which an economy will operate most efficiently.

When the unemployment rate drops below the natural rate there will be upward wage pressures and companies will be challenged to find qualified workers. The economy will operate inefficiently for different reasons than when the rate of unemployment is above the natural rate.

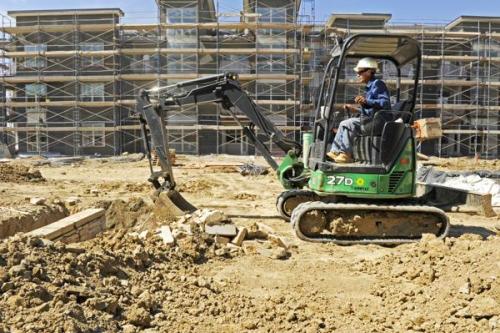
In Colorado, the February unemployment rate of 4.2% was well below the U.S. rate. Some Colorado industries are currently experiencing symptoms of an economy that is operating below the natural rate of unemployment. They are experiencing difficulty finding qualified workers in select occupations. In addition, there are upward wage pressures in industries such as construction and agriculture. Anecdotal evidence suggests some companies are not able to find workers even when they pay higher wages.

The state’s rate of unemployment is expected to remain below 4.5% in the near-term, although there are concerns the layoffs caused by lower oil prices will cause an increase in the unemployment rate. At the state level the direct impact of oil and gas layoffs may not have a major impact on total state employment and unemployment data, but it will definitely affect regions where the oil and gas industry has played a significant role in the economy, such as Weld and Garfield counties.

Expect continued solid growth in Colorado wage and salary employment in the short-term.

2015 cber.co Forecast – Fine Tuning the Volatile Category

In preparing its annual forecast, cber.co divides the NAICS sectors into three categories. This portfolio approach makes it easy to see that some sectors consistently create jobs at a higher rate of growth, some show solid growth, and others are more volatile. Ultimately, the volatile category tends to have a greater influence on the magnitude of change in total job growth than the sectors with steady growth. In March 2015 BLS released its benchmark revision of the 2014 data. The changes were more significant than usual.

As a result  the 2015 cber.co forecast was fine-tuned to have a better understanding of categories and sectors that were driving the economy. This brief discussion highlights the revisions to the 2015 cber.co forecast. This post will evaluate the Volatile Category.

The Volatile Category

Over the past two decades the sectors listed below were the primary source of volatility in total employment.

The sectors are:

  • Natural Resources and Mining
  • Construction
  • Manufacturing
  • Transportation, Warehousing, and Utilities
  • Employment Services
  • Financial Activities
  • Information
  • Federal Government

Total employment for this category was:

  • 1994  625,400 workers, 35.6% of total employment
  • 2004  716,000 workers, 32.8% of total employment
  • 2014  713,000 workers, 29.0% of total employment

2015 cber.co forecast

Estimated Job Growth

As can be seen below there is a significant difference between the original estimates for 2014 (January 11) and Benchmark revisions for 2014 (March 27). BLS significantly underestimated growth in this category in 2014.

The original Volatile Category estimates/forecast (January 11 Forecast) was + 23,000 to 27,000 Employees.

  • 19,800 jobs added in 2013
  • 25,600 jobs added in 2014
  • 706,100 employees in 2014

In 2015 between 23,000 and 27,000 jobs will be added, at a rate of 3.3% to 3.7%. This rate of growth is slightly slower than 2014.

The updated Volatile Category estimates/ forecasts, after benchmark revisions (March 27 Forecast) was + 23,000 to 27,000 Employees.

  • 22,200 jobs added in 2013
  • 30,000 jobs added in 2014
  • 713,000 employees in 2014

In 2015, between 23,000 and 27,000 workers will be added at a rate of 3.2% to 3.8%. Despite the significant underestimate in 2014, the forecast for 2015 was unchanged.

The recalibration of the 2015 forecast resulted in the following changes:
• The Strong Growth Category was revised upward by 4,500.
• The Solid Growth Category was revised downward by 1,500.
• The Volatile Category remained unchanged.
• The net change to the 2015 forecast was an upward revision of 3,000; however, the 2015 forecast is for total growth slightly below the 2014 total.

The change in the mix of jobs being added is equally as important as the change in the number of jobs being added. For further information on the cber.co forecasts click here.

2015 cber.co forecast


2015 cber.co Forecast – Fine Tuning Solid Growth Category

In preparing its annual forecast, cber.co divides the NAICS sectors into three categories. This portfolio approach makes it easy to see that some sectors consistently create jobs at a higher rate of growth, some show solid growth, and others are more volatile. Ultimately, the volatile category tends to have a greater influence on the magnitude of change in total job growth than the sectors with steady growth.
In March 2015 BLS released its benchmark revision of the 2014 data. The changes were more significant than usual.

As a result cber.co fine-tuned the 2015 employment forecast to have a better understanding of categories and sectors that were driving the economy. This brief discussion highlights the revisions to the 2015 cber.co forecast. This post will evaluate the Solid Growth Category.

The Solid Growth Category

Over the past two decades the following sectors generally posted gains. The category posted stronger jobs gains during the 1990s than the 2000s.
• Wholesale Trade
• Retail Trade
• State (Not Higher Education)
• Higher Education
• Local (Not K-12 Education)
• K-12 Education
• Accommodations and Food Services

Total employment for this category was:
1994  685,400 workers, 39.0% of total employment
2004  848,000 workers, 38.9% of total employment
2014  961,100 workers, 39.0% of total employment.

2015 cber.co forecast

Estimated Job Growth

As can be seen below there is a significant difference between the original estimates for 2014 (January 11) and Benchmark revisions for 2014 (March 27).

The original Solid Growth Category estimates/forecast (January 11 Forecast) was + 20,000 to 24,000 Employees.

• 27,600 jobs added in 2013
• 25,200 jobs added in 2014
• 964,000 employees in 2014
• In 2015, between 22,000 and 28,000 workers will be added at a rate of 2.6% to 2.8%. The rate of growth is similar to 2014.

The updated Solid Growth Category estimates/ forecasts, after benchmark revisions (March 27 Forecast) was+ 22,500 to 26,500 Employees.

• 26,700 jobs added in 2013
• 23,300 jobs added in 2014
• 961,100 employees in 2014
• In 2015, between 22,500 and 26,500 workers will be added at a rate of 2.3% to 2.8%

BLS overestimated the growth of jobs in the Solid Growth Category.
As a result changes were made to the 2015 category and total employment projections.

In 2015, the rate of growth will be 2.3% to 2.8%. This rate of growth is similar to 2014 and most years during the 1990s.

The recalibration of the 2015 forecast resulted in the following changes:
• The Strong Growth Category was revised upward by 4,500.
• The Solid Growth Category was revised downward by 1,500.
• The Volatile Category remained unchanged.
• The net change to the 2015 forecast was an upward revision of 3,000; however, the 2015 forecast is for total growth slightly below the 2014 total.

The change in the mix of jobs being added is equally as important as the change in the number of jobs being added.

For further information on the cber.co forecasts click here.

2015 cber.co forecast

Rate of CU-Boulder In-State Tuition Increase is Lower than Usual

The University of Colorado Board of Regents recently approved an increase of 2.9% for the 2015-2016 school year. Parents who are footing the bill of their students breathed a sigh of relief while the general reaction among the general public was, “It’s about time?”

The rate of in-state tuition increases at CU-Boulder since 2004 are listed below (source: Boulder Daily Camera):
2015-16: 2.9%
2014-15: 3.3%
2013-14: 8.7%
2012-13: 5.0%
2011-12: 9.3%
2010-11: 8.9%
2009-10: 8.8%
2008-09: 9.3%
2007-08: 19.0%
2006-07: 2.4%
2005-06: 27.8%
2004-05: 9.0%
These increases are mild compared to out-of-state increases, but in most cases are significantly higher than the rate of inflation.

Funding for higher education comes from a variety of sources. Those sources include tuition, state funding, donations, student fees, federal grants – just to mention a few. CU has reported that:
• Donations are up.
• Over the long-term, state funding is also up. In 2004-2005 CU Boulder received $56.5 million in funding from the state of Colorado. In 2015-2016 the University is expected to receive $66.6 million from state funding. During this period funding was volatile. As a result, recent short-term funding is trending downwards.
• Enrollment has increased.
• In some schools within the CU-Boulder, federal funding is up; however, overall U.S. federal funding for all universities has dropped to 2002 levels, not adjusted for inflation.
Students have been left holding the bill and the problem has been exacerbated by CU Boulder leaders spending as if there is no tomorrow.

Higher education is critical to the future of Colorado. It is imperative for the leadership of CU-Boulder to focus its efforts on making the state’s flagship university more relevant, fiscally responsible, and affordable to in-state students.

In-State Tuition Increases vs. CPI
Comparison of rate of increase for CU-Boulder in-state tuition versus the CPI.

2015 cber.co Forecast – Fine Tuning Strong Growth Category

In preparing its annual forecast, cber.co divides the NAICS sectors into three categories. This portfolio approach makes it easy to see that some sectors consistently create jobs at a higher rate of growth, some show solid growth, and others are more volatile. Ultimately, the volatile category tends to have a greater influence on the magnitude of change in total job growth than the sectors with steady growth.

In March 2015 BLS released its benchmark revision of the 2014 data. The changes were more significant than usual.

As a result cber.co fine-tuned the 2015 employment forecast to have a better understanding of categories and sectors that were driving the economy.  This brief discussion highlights the revisions to the 2015 cber.co forecast. This post will evaluate the Strong Growth Category.

solid growth

The Solid Growth Category

Over the past two decades the following NAICS sectors have been the foundation for consistent growth in Colorado employment.
• Professional, Scientific, and Technical Services
• Management of Companies and Enterprises
• Administrative – Business to Business (Not Employment Services)
• Private Education
• Health Care
• Arts, Entertainment, and Recreation
• Other Services.

Total employment for this category was:
1994 445,200 workers, 25.4% of total employment
2004 615,900 workers, 28.3% of total employment
2014 786,700 workers, 32.0% of total employment

Estimated Job Growth

As can be seen below there is a significant difference between the original estimates for 2014 (January 11)  and Benchmark revisions for 2014 (March 27).

The original Strong Growth Category estimates/forecast  (January 11 Forecast) was  + 20,000 to 24,000 Employees.
• 20,300 jobs added in 2013
• 20,900 jobs added in 2014
• 782,500 employees in 2014
• In 2015, between 20,000 and 24,000 workers will be added at a rate of 2.8% to 3.0%.

The updated Strong Growth Category estimates/ forecasts, after benchmark revisions (March 27 Forecast) was + 24,500 to 28,500 Employees.
• 20,000 jobs added in 2013
• 25,600 jobs added in 2014
• 786,700 employees in 2014
• In 2015, between 24,500 and 28,500 workers will be added at a rate of 3.1% to 3.6%.

BLS significantly underestimated the magnitude of growth in total employment as well as the increase in the number of jobs in the Strong Growth Category. As a result changes were made to the 2015 category and total employment.

In 2015, between 24,500 and 28,500 workers will be added. The rate of growth will be 3.1% to 3.6%. This rate of growth is slightly greater than 2014. Absolute job growth of this category will be similar to job growth in 2007 and 2014.

Total employment for the state will increase by 73,000 to 79,000.

The recalibration of the 2015 forecast resulted in the following changes:

• The Strong Growth Category was revised upward by 4,500.
• The Solid Growth Category was revised downward by 1,500.
• The Volatile Category remained unchanged.
• The net change to the 2015 forecast was an upward revision of 3,000; however, the 2015 forecast is for total growth slightly below the 2014 total.

The change in the mix of jobs being added is equally as important as the change in the number of jobs being added. For further information on the cber.co forecasts click here.

summary of employment growth by category

BLS Benchmark Revisions Push 2014 Colorado Employment Higher

The Bureau of Labor Statistics released their benchmark revisions for 2014 Colorado employment in March. The upward revisions were significant and showed that Colorado added 78,900 wage and salary jobs. The final revisions for 2013 were minimal.

The data provided no surprise for those who gauge economic growth by the activity on the streets. The magnitude of the upward revision was disappointing for those who rely heavily on accurate jobs data to make critical business decisions.

In fairness to BLS, it is a challenge to report employment data in periods of strong growth and decline. As has been the case with many public and private organizations, BLS has been expected to provide more accurate estimates in shorter time frame at a lower cost. That is not always an equation for high accuracy.

The “preliminary” data showed that Colorado employment was increasing at a decreasing rate in the second half of 2014. The “benchmark” data shows there was actually strong growth. In addition, their estimate methodologies caused noticeable errors in key industries. In other words, industries that were thought to be having a really strong impact on the growth of the state were only having a strong impact on it.

It is important to understand the significance of the difference between the preliminary and the benchmark data.

Most economic forecasts for 2015 were based on the preliminary 2014 data – the data with the errors. Most likely these forecasts will not accurately account for the actual magnitude of job growth in 2014 which may cause errors in their estimation of growth in 2015.

Use caution when reviewing any Colorado jobs forecasts for 2015. Most are likely to contain biases resulting incorrect assumptions derived from the 2014 data.

The good news is the state added jobs at a faster rate than anticipated. Most likely Colorado will enjoy a similar rate of growth in 2015.

benchmark vs preliminary data

Colorado Job Growth – 2014 and 2015

On March 20th, the Bureau of Labor Statistics will release its benchmark revisions for 2014 Colorado employment. Most likely the number of jobs added will be at least 73,000. The revisions will provide insight about how the following issues will be addressed as the state moves forward in 2015.

Unemployment – The state’s unemployment rate is well below that of the U.S. Will Colorado companies begin to encounter job shortages in key occupations? Will companies face pressure to raise wages because of these shortages? Will companies be able to hire workers even if they raise wages?

Housing – How much will demand for new homes drive growth of the construction industry? How will the rapid increase in prices shape the demand for the type of housing that will be built (single-family or multi-family)? Will the price of existing housing make it too expensive for outsiders to move to Colorado, i.e., will it stymie growth?

housing construction - job growth

Price of oil – 2014 was a record year for oil production in Colorado. There will likely be a significant decline in 2015. How much will it affect the overall economy? How will this impact the unemployment rate and job growth in Weld, Garfield, La Plata and smaller counties that produce oil and gas? Will the layoffs allow the oil and gas companies to get rid of “dead wood” and become less “top heavy”? Is there new technology that will allow the oil and gas companies to operate more efficiently and in a more environmentally friendly manner? Will hiring at Vestas help offset the decline in the extractive industries and provide a workplace for some of the displaced oil and workers?

– The U.S. has enjoyed strong job growth over the past couple of years. How will Colorado companies be able to participate in that growth? To what extent will the rural counties support Colorado job growth in 2015?

Stay tuned for the release of the data and another exciting year ahead for the Colorado economy.

2014 Unemployment Rate – Challenges and Positives for 2015

On March 4, the Bureau of Labor Statistics released its annual unemployment data for Colorado. The 2014 unemployment rate for Colorado was 5.0%, down from 6.8% in 2013. The average number of unemployed decreased from 189,023 in 2013 to 141,387 in 2014.

With that as a background, some of the challenges and positives facing the economy are listed below.

Employment in Colorado has increased at a modest and manageable rate for the last two years. A similar level of growth is expected in 2015, but there will be some challenges.
• The decline in the price of oil has begun to hit Colorado producers. The breakeven point for the Niobrara is in the $65 to $70 range. Several companies have announced significant layoffs.
• In addition to the drop in the price of oil, demand for Colorado coal declined in 2014. Coal is a major driver of several rural economies throughout the state. With the decline in demand, many communities are fine tuning their economic development strategies to diversify their economies.
• Colorado’s rate of inflation is more than a point higher than the rate for the U.S. (The Denver-Boulder-Greeley index is used as a proxy for the state). Last year it was 1.6% for the U.S., while it was 2.8% for Colorado. The rapidly appreciating prices of housing in Denver and many parts of the state are largely responsible for the gap in inflation between the state and the nation.
• Rising home prices are a two-edged sword. They benefit the home owners but may be detrimental to prospective buyers. In parts of the Front Range, there is solid demand and low inventories for certain types of housing, particularly at the lower end. Affordable and attainable housing are in high demand.

On the other hand the state has many positives:
• Nationally, jobs are being added at rate that is accelerating slightly. That bodes well for Colorado.
• The decline in oil and gas prices has increased disposable income slightly, about $50 for 2014 and $500 to $700 for 2015.
• Rising home prices will be beneficial to Colorado. Homeowners are more confident if they feel the value of their home is increasing. As a result they may spend more. Rising property values directly benefit the coffers of local governments and school districts.
• After a slowdown in 2014, Wall Street is enjoying a bull market. This in turn creates wealth and increases greater consumer and business confidence.
• Unemployment is expected to remain below 5.0% throughout 2015. As a result wage pressures will become a bigger issue in more occupations and industries. This is great for workers, particularly if their increases exceed Colorado’s rate of inflation (2.8% in 2014). Wage increases that exceed the rate of inflation will serve as a form of stimulus to the economy because workers will have greater confidence and more to spend. In turn, education and state and local government will be able to more fully fund programs that have been underfunded in the past.
• Because the decline in the price of oil is a global issue, oil and gas employees may not be able to move to other states or countries to find work. With the Colorado unemployment in the range of 4.0% some of these workers may be able to stay in-state and work in construction, manufacturing or other positions.
• Colorado has experienced another first-rate ski season, with an added benefit of hosting the 2015 FIS Alpine World Ski Championships in Vail. The event showcased the state to 700 athletes from more than 70 nations.
• The spring snow storms significantly increased snowpack levels in many parts of the state; however, additional snow is needed. Water in critical for all aspects of Colorado’s economy. While the snow is often viewed as an inconvenience to those along the Front Range, it is essential to have good snow pack in our mountains and counties where agriculture dominates the local economy.
• The sectors that have driven the economy over the past two years are construction; healthcare; accommodations and food services; retail trade; and professional, scientific, and technical services (PST). These sectors are expected to account for about 60% of the job growth in the state in 2015. There will admittedly be challenges in the extractive industries; however, they will have a minor impact on the growth of the state’s top five sectors for job growth.

As Colorado addresses these challenges and positives, job growth in 2015 is expected to be at or slightly less than the rate for 2014.

Colorado Manufacturing Could be Stronger

The Manufacturing Sector is critical to the Colorado economy because it is a source of primary jobs that pay higher than average wages. In addition, manufacturers bring in revenue from outside the state that is spent in Colorado and they export goods to domestic and international destinations.

In 1990, manufacturers accounted for 11.3% of total state employment. In 2014, only 5.6% of Colorado’s employees were in the manufacturing sector. Around 2000 the number of manufacturing workers in Colorado and across the U.S. declined as companies outsourced and off shored. As well, the back-to-back recessions in the 2000s forced manufacturers to become more efficient. They accomplished this by investing in capital expenditures rather than labor.

Compared to most other parts of the country, Colorado has never been a strong manufacturing state. It is the proud home to world-class manufacturers such as Ball Aerospace, Miller Coors, and Leprino Foods. Most manufacturers are small businesses that produce everything from tacos to optical mirrors.

The state’s manufacturing sector is concentrated in pockets along the Front Range:
• Boulder County is at the forefront for its high tech manufacturers.
• Weld and Pueblo Counties are strong in renewable energy. Vestas has been a significant source of manufacturing job growth over the past decade. In addition, Weld County is home to various ag-based manufacturers.
• A majority of the state’s manufacturers are located in Denver.

The location quotient for all wage and salary manufacturing workers, or the concentration relative to other industries, is well below 1.0. It trended downward from 1990 to 2001, but has been relatively flat since then.

Here’s to growth for the Colorado manufacturing sector in years to come.

colorado manufacturing

General Fund Projections Provide Positive Outlook for Colorado

The projections of the Colorado Legislative Council and the Governor’s Office of State Planning and Budgeting show continued solid economic growth for the next three years, 2015 through 2017. From the perspective of the state government, the most important part of those projections is the budget for the General Fund.

General Fund Revenue for FYE June 2015 will increase to $9.6 billion, an increase of about 7.0% over FYE 2014. By 2017 the General Fund is expected to exceed $11.1 billion.

Sales Tax Revenue accounts for about one-fourth of the Gross General Fund. The Sales Tax Revenue for FYE 2015 is projected to be approximately $2.6 billion.

Net Individual Income Tax accounts for about two-thirds of the Gross General Fund Revenue. The Individual Income Tax Revenue for FYE 2015 is projected to be about $6.1 billion.

It is important to put these projections in perspective because times weren’t always as good as they are today. In 2008 the Gross General Fund was $7.7 billion. It fell to $6.5 billion in 2010 and has climbed upwards since.

The following economic projections will have an impact on the economy and revenue collections by the state through FYE 2017:
• Sustained job growth.
• Solid consumer confidence.
• Continued net migration.
• Strong equity markets, even though they may be volatile.
• If sales tax projections are correct, FYE 2014 to FYE 2017 would be the best four-year period for tax growth since FYE 1997 to FYE 2000.
• Lower gas prices may increase retail sales which could increase tax revenues in the short-run.
• Improved labor markets will create upward pressure on wages. This will potentially increase individual income taxes, but possibly decrease corporate income taxes.
• There is an expected TABOR surplus that will reduce individual income taxes beginning in FYE 2016.
• Corporate profits may be lower because of increased labor and capital costs and a reduction in tax incentives.

It will be interesting to look back in 2018 and see which of these economic projections have transpired.

general fund