Blog

Colorado Unemployment Rate Drops to 3.6%

Earlier today the Bureau of Labor Statistics released employment and unemployment data  Colorado. It was a mixed blessing.

Unemployment

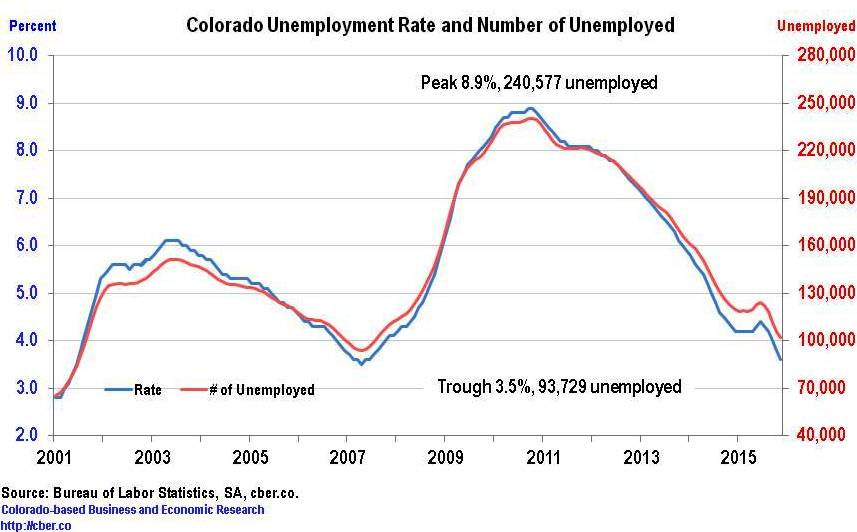
The Colorado unemployment rate for November dropped to 3.6%, down from 3.8% in October and 4.3% a year ago.

Nationally, the unemployment rate declined in 45 states compared to a year ago. By contrast only 27 states have rates lower than October. Colorado’s seasonally adjusted unemployment rate has been at or below 4.2% since December 2014 and there is little room for it to drop much further.

For job hunters this is good news as long as their skills match the available jobs. In addition, there will be upward wage pressure for occupations facing a shortage of qualified workers, such a construction, machining, and technicians.

On the other hand, the lower rate may be bad news for some companies. They may have greater difficulty finding qualified and clean workers. As a result they may have to pay higher wages for skilled positions. In addition, there is greater employee turnover during times of lower unemployment. This may decrease productivity and increase recruitment, hiring, and training costs. These increased costs will lead to lower profit margins and increased prices.

At the end of November there were 102,035 unemployed workers in Colorado. This is only 8,306 greater than the trough in May 2007 and 138,542 less than the peak in October 2010.

unemployment rate

Employment

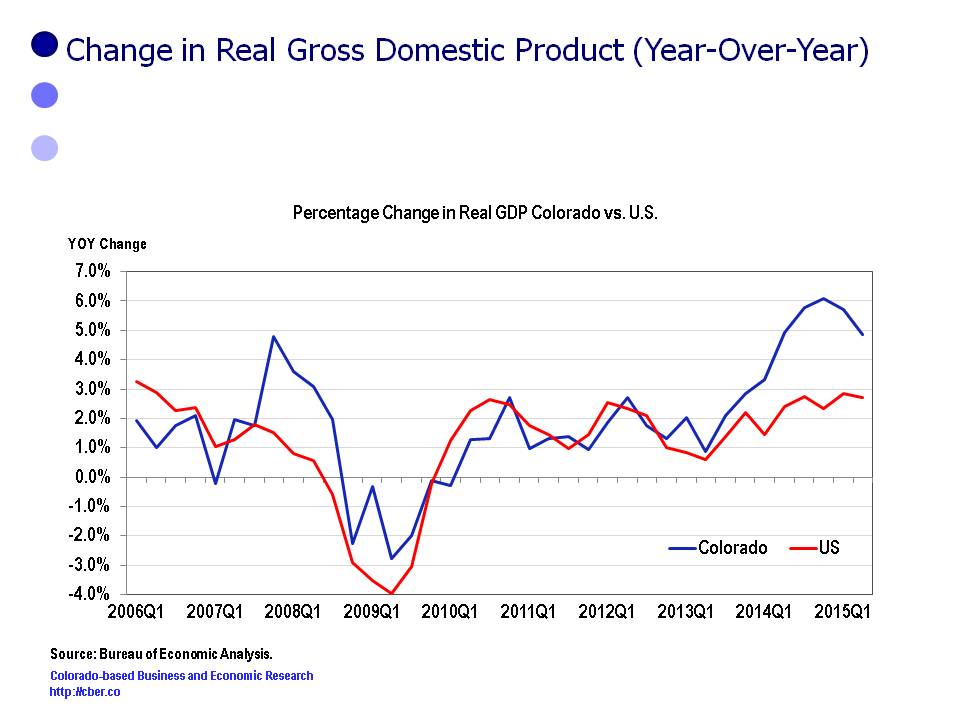
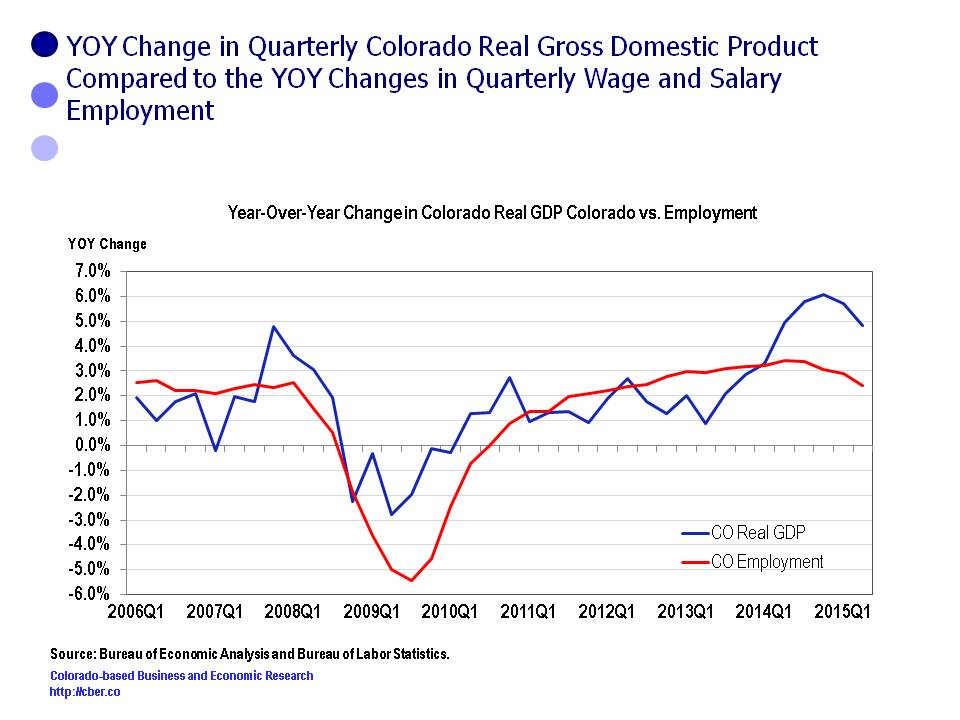
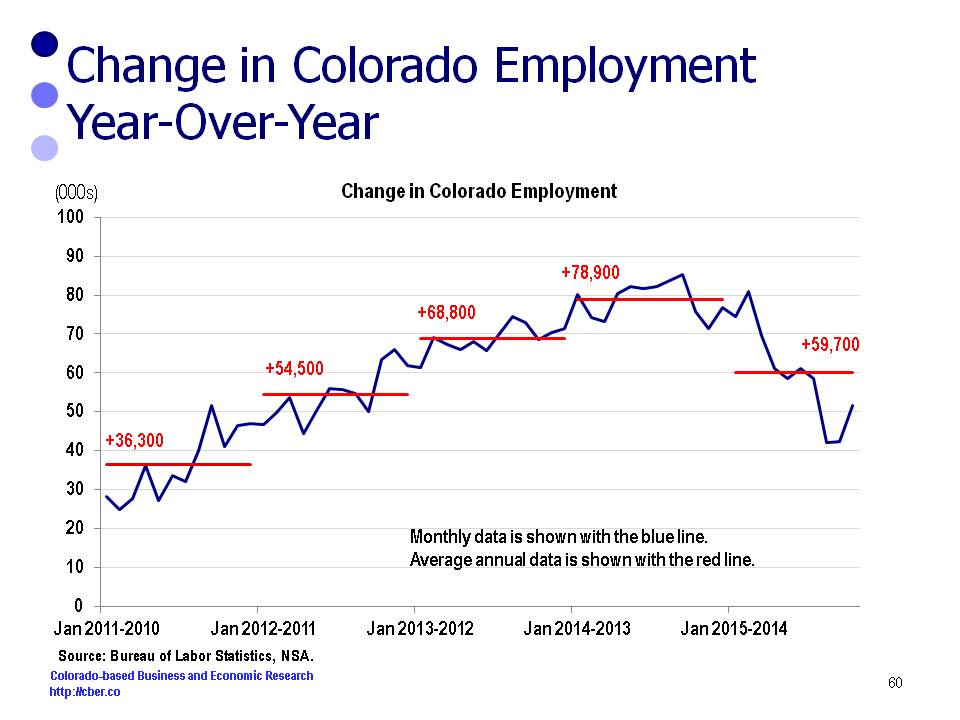
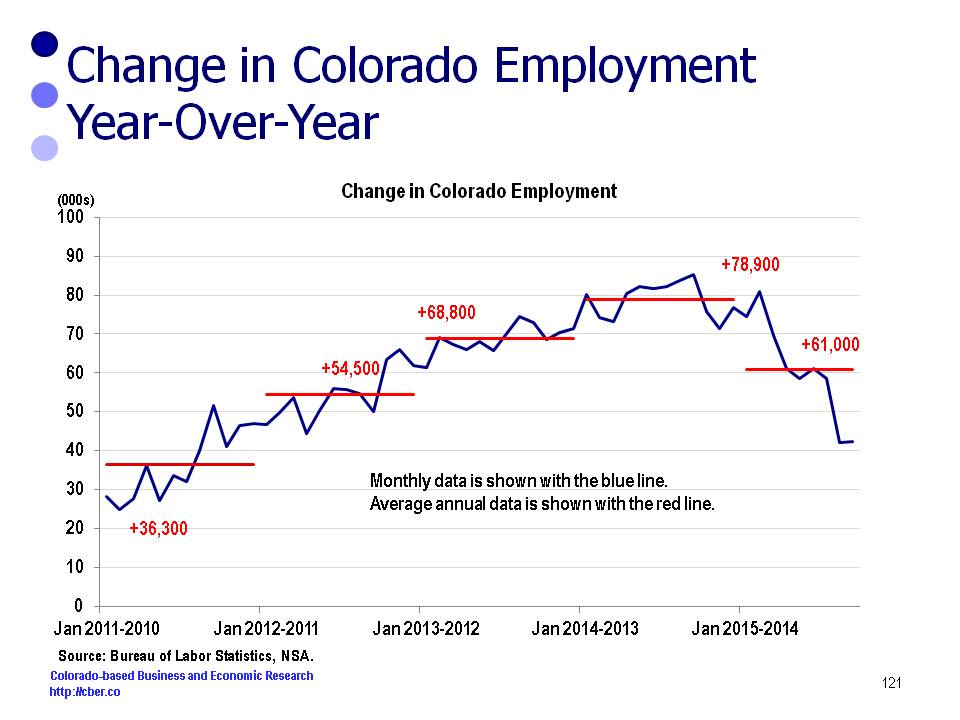
Despite the lower unemployment rate, November wage and salary job growth was lackluster, only 43,600 greater than a year ago. During the first half of 2015 Colorado employment increased at an average monthly rate of about 5,600 jobs. That average has dropped to 3,900 jobs during the second half of the year.

Even with the declining rate of job growth Colorado will add 55,000 to 60,000 jobs this year – prior to BLS benchmark revisions that will be released in March 2016. Those revisions may push 2015 average employment to 70,000+. The leading sectors for job growth are Health Care, Accommodations and Food Services, and Construction.

As the level of job growth has tapered off there has been an increase in the number of discussions about a recession; however; the Fed’s recent decision to hike interest rates suggests the economy is on solid footing and a recession will not occur in the short-term.

Colorado Real GDP Currently Stronger than U.S.

On December 10th, the Bureau of Economic Analysis (BEA) released quarterly GDP data for Colorado (2005 to Q2 2015). The Q2 year-over-year Real GDP for Colorado increased by 4.8% compared to 2.7% for the U.S.

The following trends are evident in the comparison of the year-over-year GDP data for Colorado and the U.S:
• The correlation coefficient between these two variables is .69
• The U.S. was stronger during the period Q1 2006 through Q1 2007.
• Colorado outperformed the U.S. significantly between Q2 2007 and Q4 2009 (This was during the recession).
• The U.S. was stronger coming out of the recession for most of 2010 – from Q1 2010 to Q3 2010.
• For the next two years, from Q4 2010 to Q3 2012 the rates of growth for Colorado and the U.S. were similar.
• From Q4 2012 to the present, the Colorado GDP expanded at a faster rate than the U.S. GDP. Beginning in Q1 2014 the gap between the two rates became greater as a result of the strength of the oil and gas industry in Colorado.
• That gap has since narrowed in 2015 as the price of oil has declined and oil and gas production has fallen off.

Colorado Real GDP


The following trends are evident in the comparison of the year-over-year GDP data for Colorado and the Colorado wage and salary employment:
• The correlation coefficient between these two variables is .72
• Employment grew at a higher rate from Q1 2006 to Q2 2007 than the Real GDP.
• Generally, the Real GDP grew at a greater rate from Q3 2007 to Q2 2011 than employment growth.
• From Q3 2011 to Q1 2014 the rate of growth for employment was generally greater than the Real GDP growth.
• From Q2 2014 to present the Real GDP grew at a greater rate than employment. This was in part largely because of the increase in oil and gas production in Colorado during this period.
• As the price for a barrel has dropped and oil and gas production has fallen off the gap between the two rates has declined. This caused a much greater decline in the growth rate for GDP than employment.

Colorado Real GDP

As can be seen the growth of the Colorado Real GDP and the U.S. Real GDP are closely related. As well, there is a strong relationship between the rate of growth for state Real GDP and employment.

U.S. Employment Continues Growth at a Slower Rate

On December 4th, the Bureau of Labor Statistics released its monthly update for U.S. nonfarm payroll employment for November. The number of non-seasonally adjusted jobs increased by 2,650,000 in November compared to a year ago.

Based on current trends, the U.S. is on track to add 2,959,455 jobs in 2015.That equates to about 269,000 workers per month.

The November unemployment rate remained at 5.0% down from 5.8% a year ago. There were 7.9 million unemployed compared to 9.0 million last November.

A look at the seasonally adjusted data shows that job growth occurred in construction, professional and technical services, and health care. Losses occurred only in the mining and information sectors.

• Construction employment posted a gain of 46,000 in November. About 26,000 of those jobs were in the residential specialty trade contracting subsector. Year-over year construction employment is about 259,000 workers greater than last November.

• Professional and technical services added 28,000 jobs in November. About 11,000 jobs were in accounting and bookkeeping services and 5,000 were in computer systems design services. Compared to a year ago, the PST sector is about 298,000 jobs greater than the same period in 2015.

• Health care employment for November was 24,000 greater than October. About 13,000 workers were added in the hospital subsector. On a YOY basis health care employment is about 470,000 greater in 2015.

• Employment in food services and drinking places increase by about 32,000 jobs in November and it is up by 374,000 greater than a year ago.

• Combined, the four sectors mentioned above show job gains of about 1.4 million compared to a year ago.

• Compared to the prior month there was little change in the following sectors: manufacturing, wholesale trade, transportation and warehousing, financial activities, and government.

All eyes will continue to be on the Fed and their meeting later this month. Although U.S. employment has increased at a decreasing rate through 2015, the latest BLS report is probably strong enough for them to finally announce a hike in short term interest rates.

Moving forward the $64 question is, “Will job growth continue at the rate experienced in the second half of the year or will we move forward at the more robust rate shown in the first half of the year?”

U.S. Employment

Top Output Categories for Colorado

The following list identifies the top output categories for Colorado. The list has been extracted from an IMPLAN database, www.implan.com. This database divides output and employment  into  440 categories.

IMPLAN is an economic analysis tool that uses input-output analysis in combination with regional specific Social Accounting Matrices and Multiplier Models.

This list provides insight into the industries that drive the Colorado economy. As can be seen finance is a major contributor to the state’s output. Other key categories are food services, extractive industries, construction, government, health care, and advanced technology.

Top Output Categories for Colorado Based on IMPLAN Data

Rank Industry Code Description Output Percent Cumulative Percent
1 360 Real estate establishments $25,472,296,875 5.2% 5.2%
2 361 Imputed rental activity for owner-occupied dwellings $22,888,701,172 4.7% 9.9%
3 319 Wholesale trade businesses $22,869,310,547 4.7% 14.6%
4 351 Telecommunications $20,428,070,313 4.2% 18.8%
5 413 Food services and drinking places $12,926,014,648 2.6% 21.4%
6 438 * Employment and payroll only (state & local govt, education) $11,658,043,945 2.4% 23.8%
7 354 Monetary authorities and depository credit intermediation activities $11,587,137,695 2.4% 26.2%
8 20 Extraction of oil and natural gas $11,270,791,992 2.3% 28.5%
9 356 Securities, commodity contracts, investments, and related activities $10,981,884,766 2.2% 30.7%
10 394 Offices of physicians, dentists, and other health practitioners $9,923,915,039 2.0% 32.8%
11 440 * Employment and payroll only (federal govt, military) $9,475,095,703 1.9% 34.7%
12 381 Management of companies and enterprises $9,202,613,281 1.9% 36.6%
13 437 * Employment and payroll only (state & local govt, non-education) $9,006,702,148 1.8% 38.4%
14 357 Insurance carriers $8,479,899,414 1.7% 40.2%
15 36 Construction of other new nonresidential structures $8,137,076,660 1.7% 41.8%
16 397 Private hospitals $7,912,281,250 1.6% 43.5%
17 369 Architectural, engineering, and related services $7,906,128,906 1.6% 45.1%
18 345 Software publishers $7,026,037,598 1.4% 46.5%
19 31 Electric power generation, transmission, and distribution $5,340,330,078 1.1% 47.6%
20 366 Lessors of nonfinancial intangible assets $5,337,109,375 1.1% 48.7%
21 439 * Employment and payroll only (federal govt, non-military) $5,274,785,156 1.1% 49.8%
22 371 Custom computer programming services $5,234,539,063 1.1% 50.9%
23 359 Funds, trusts, and other financial vehicles $5,130,132,813 1.1% 51.9%
24 115 Petroleum refineries $4,738,690,430 1.0% 52.9%
25 367 Legal services $4,462,339,844 0.9% 53.8%
Other $225,686,144,106 46.2% 100.0%

Total output for the model was $488,356,072,817 and employment was 3,235,493. These 25 categories account for 46.4% of employment and 53.8% of output for the state.

Colorado Employment Increases by 13,000 jobs in October – Really?

On Friday November 20th, the BLS released wage and salary employment data for the states. The seasonally adjusted data indicated that Colorado employment increased by 13,000 jobs last month.

This is in sharp contrast to the previous three months. The data for July showed a gain of 600 jobs; an increase of 1,600 workers was posted in August, and a decline of 1,600 jobs showed up in September.

If these numbers prove to be accurate, it is reasonable to raise the question: Which is the anomaly – the posted employment for July through September or the employment for October?

The non-seasonally adjusted data shows the Colorado employment continues to post solid job growth. Approximately 59,700 jobs will be added this year.

Colorado employment

The state’s job growth is led by the health care, construction, and accommodations and food services industries. There are fears that construction growth will be constrained by the lack of trained workers.

In addition, all of the state’s MSAs have shown solid to strong job growth. Local governments are continuing to spend and the state government is offering more tax incentives to out-of-state companies to move to Colorado.

A review of the top news stories for the past month echoes the sentiment of state leaders (Office of state Planning and Budgeting and Colorado Legislative Council) who say that the economy is on solid footing.

A majority of the coverage about the economy is very positive, however, there is one story that is unsettling. Union Pacific is laying off workers in Denver and BNSF is following suit in other states. While there is reason to be concerned about the individuals who are furloughed or laid off, there is greater concern because the railroads are facing decreased demand for shipments (coal, oil, agriculture products, and industrial products). This suggests there may be something fundamentally wrong with the overall economy, i.e. manufacturing may be woefully weak.

Another note of concern, the state of Colorado is expected to take in record levels of revenue, yet it will experience a budget shortfall for a variety of reasons beyond the control of state legislators. Special interest groups are addressing this issue, but there is limited interest in their efforts.

The bottom line is the Colorado economy is on solid footing, at least for the moment.


Expect Solid Job Growth in Upcoming BLS State Release

On Friday November 20th, the BLS will release the state wage and salary employment data through October. In light of the release of U.S. employment earlier this month, the state data is likely to show solid job growth in most cases. This brief overview of the national economy sets the tone for the upcoming release of the Colorado data.

The U.S. Economy
In a nutshell, some of the top reasons to feel upbeat about the U.S. economy are:
• U.S. Consumer Sentiment is up as measured by the University of Michigan Consumer Sentiment Survey.
• There was strong U.S. job growth for October – 271,000 jobs were added.
• The U.S. unemployment rate continues to decline. Theoretically, the U.S. is at or near full employment and the economy is operating efficiently.
• The ISM Non-Manufacturing Purchasing Managers Index is strong.
• Construction spending continues to be strong.
• Many companies are cash rich and they are strategically expanding through mergers and acquisitions.
• Inflation remains low.

Turbulence – Concerns That we Have Come to Grips With
There are always reasons for people to feel jittery about the economy.
• Since 2010 there have been concerns that the Greek debt crisis would unravel the EU. Those concerns reappeared earlier this year, but have subsided.
• There are worries that the slowdown in the growth rate for the Chinese economy and the impact it will have on their immediate trading partners will cause a downturn in the global economy. This is less of an issue than it was several months ago
• The summer volatility in the equity markets has subsided. The VIX has dropped from almost 41 in late August to about 17 on November 19th. Much of the lost ground has been regained. For example, the S&P 500 closed at 2,081 on November 19th, up from 1,868 in late August.
• The inaction of the Fed to raise interest rates is reminiscent of a shy high school boy who is smitten with his first girl friend. He keeps thinking, “Is now the right time for me to kiss her.” And she is thinking, “He must not like me because he won’t kiss me.” While many agree that a rate increase is long overdue, the issue is the timing of that increase – just like that first kiss. Now is the time.

Turbulence – Areas that Continue to Make us Uneasy
Terrorism and the price of oil are areas that cause everyone to toss and turn at night.
• It is unlikely we will ever get used to the “sick-in-your-stomach feeling” caused by ISIS and other terrorist groups. Their direct impact is psychological. Indirectly, consumers will be more cautious and businesses will be obligated to spend more on security.
• For over a year now, the price of oil has disrupted the economies in Tier I oil producing states. In some states such as Colorado, production has remained strong; however, it will likely drop off as there is a glut of oil and a lack of storage facilities. Problems in the industry could be exacerbated by further declines in the price for a barrel of oil caused by the glut. Some industry experts project oil could drop to $20 per barrel.

Other National Concerns
Holiday retail sales are projected to increase by 3.5% to 4.0% compared to last year and online sales will be double that amount. This is solid growth, but is an issue only in the sense that it is not stronger.

The major concern about the U.S. economy is the manufacturing sector. The ISM manufacturing index has trended downward since August 2014 and has been near 50 for the past two months. Purchasing managers are ambivalent about the level of growth in their companies. At the moment the industry appears to be on the verge of a downturn.

Concluding Thought
With this as a background, Coloradans should expect the upcoming BLS report to say that job growth will be much stronger than recent months.

Economic Impact of Colorado Mining Employment is Significant

In October, the Bureau of Labor Statistics reported the Colorado Mining Sector employed about 35,000 workers, or about 1.4% of the state’s 2,534,600 wage and salary employees.

In 2014 the GDP for the Colorado Mining Sector was $19 billion, or 6.2% of the 2014 Colorado GDP. More importantly, the Mining Sector accounted for about 18.2% of the growth in the state’s GDP.

In a nutshell, mining employment is a small portion of total employment in Colorado. On the other hand, the industry makes a major contribution to the GDP.

The Oil and Gas Industry accounts for about 75% of the employment and GDP total.

With that as a background, it is easy to see why state leaders were concerned when the price for a barrel of oil plummeted to below $40 per barrel in a matter of months.

To make matters worse, the Bureau of Labor Statistics may have overstated employment in the Oil and Gas industry by as much as 4,000 workers. In other words, the data for the state does not appear to have measured the direct, indirect, and induced impact of lower employment caused by lower prices for a barrel of oil.

A quick analysis using IMPLAN shows the loss of 3,200 oil and gas workers and 800 support workers would result in a loss of $4.2 billion in economic activity and a total loss of 12,486 jobs. The direct average annual wages for the oil and gas industry are $96,425 and the direct average annual output per worker is $701,480.

The Bureau of Labor Statistics will update wage and salary data for 2015 in its benchmark revisions next March. At that point we will have a better look at the magnitude of the layoffs in the Mining Sector in 2015.

While we are anxiously awaiting the update, the reduction in mining employment is not a number we really want to see – it will be ugly!

mining impact

U.S. Employment Shows Strong Gain in October

On November 6th, the Bureau of Labor Statistics released its monthly update for U.S. nonfarm payroll employment. The number of seasonally adjusted jobs increased by 271,000 in October. Over the previous 12 months, employment has increased by an average of 230,000 workers per month. That equates to 2.8 million per year.

The unemployment rate was down from 5.7% to 5.0% a year ago and 5.1% in the previous month. The number of unemployed persons was down from million a year ago to 7.9 million in October.

The areas with the largest increases were professional and business services (PBS), health care, retail trade, food services and drinking places, and construction.
• Employment in the PBS Sector increased by 78,000 in October, compared with an average gain of 52,000 per month over the prior 12 months.
• Health care employment increased by 45,000 jobs in October. Over the past year, health care has added about 41,200 jobs per month, or slightly less than a half million jobs for the year. About 27,000 jobs were added in ambulatory health care services and 18,000 in hospitals.
• The number of retail trade jobs increased by 44,000 in October. This is well above the average monthly gain of 25,000 jobs for the past 12 months. In October about 20,000 were added in clothing and accessories stores, 11,000 were added in general merchandise stores and 6,000 were added in automobile dealerships.
• About 42,000 workers were added in food services and drinking places in October. For the past year the monthly average has been about 31,000.
• Finally, construction employment rose by 31,000 in October. This is slightly higher than previous months. About two-thirds of the October growth was in nonresidential specialty trade contractors.

On the down side, mining employment fell by 5000 workers. The sector peaked in December 2014 and has since shed 109,000 jobs.

Employment in other major industries was similar to the prior month.
It was encouraging to see this level of job gains. Next month, we will learn whether the level of October employment was a “one hit wonder” or a reversal of the downward trend that has been taking place since the second quarter.

Rocky Mountain National Park Will Top 4 Million Visitors in 2015

For many years Rocky Mountain National Park has been one of the state’s top tourist attractions. This year it is on track to surpass four million visitors.  Lower gas prices have played a role in increasing the number of visitations at Rocky Mountain as well as other western national parks.

In addition, the higher number of visitors is a result of the celebration of the park’s 100th birthday and the publicity surrounding that landmark. Throughout the year there have been numerous events celebrating the event that culminated with a re-dedication of the park on September 4th. National Park officials have indicated that visitations are frequently 10% to 15% higher during their centennial years.

The park opened in 1915 and 31,000 people visited the park. By 1948, the number of visitations topped 1 million for the first time (1,023,262). More recently the number of visitors has shown steady growth:
• 2010   2,955,821
• 2011   3,176,941
• 2012   3,229,617
• 2013   2,991,141
• 2014   3,443,501
• 2015   4,100,000 estimated.

Note: the decline in 2013 is a result of a federal government shutdown and severe flooding.

Here are some fascinating facts about Rocky Mountain National Park from the park’s website:
•Rocky Mountain National Park was established in 1915.
•The Continental Divide (a demarcation of the flow of water between the Pacific Ocean and Atlantic Ocean) runs through the park.
•Grand Lake Cemetery (which was founded in 1892) is the only active community cemetery operating inside a national park.
•Elevations inside Rocky Mountain National Park range from 8,000 feet in the valleys to 14,259 feet at the top of Longs Peak (the highest point in the park).

In Rocky Mountain National Park, there are:
•35 trailheads, with 359 miles of established trails
•585 drive-in campsites (situated in 5 campgrounds) and 200 backcountry campsites
•60 types of mammals (including moose, elk, bighorn sheep, black bears, coyotes, and mule deer)
•280 species of birds
•900 different plants
•150 lakes
•476 miles of streams and creeks, including, most notably, the headwaters of the Colorado River
•260 miles of horse trails
•5 visitor centers.

Whether it is the year ’round spectacular views, the spring-time flowers, or the bugling elk in October – its worth the trip.Rocky Mountain National Park

Colorado’s October Job Growth Reverses Downward Trend

Recent data from the Bureau of Labor Statistics shows that 2015 wage and salary job growth continues to be positive, but it is increasing at a decreasing rate. Through the first nine months Colorado employment is 61,000 jobs greater than the same period last year.

During Q1 job growth was 75,000 greater than the same period a year ago. It dropped significantly during Q2 – 60,100 greater than Q2 2014. Q3 2015 job growth was only 47,700 greater than Q3 2014.

After declining for six months (March through August), employment increased from 42,100 in August to 42,400 in September.

About 76.2% of total jobs added were in the top five sectors:
Health Care 13,800
Accommodations and Food Services 12,300
Construction 11,500
Professional and Scientific 5,200
Manufacturing 3,600

Approximately 23.8% of all jobs added were in Leisure and Hospitality (AFS + AER). This sector touches all Colorado counties.

About 10.8% of total jobs added were in the PST, Manufacturing, and Information Sectors. These sectors are the source of primary and advanced technology jobs.

Colorado is projected to add 73,000 to 79,000 jobs in 2015, a gain of 3.0% to 3.2%. As mentioned earlier Colorado is on track to add 61,000 jobs this year.

CDLE/LMI has projected that a significant upward adjustment will be made to the Q4 2014 data and data for the first four months of 2015. These revisions will be made in March 2016. Total employment for 2015 should be at the lower end of the range of 73,000 to 79,000. This is the level of job growth forecasted by cber.co for 2015.

The good news is the downward trend in the number of jobs added may have been reversed in October. We will learn more next month and in March 2016 when the 2015 data is revised.

Wage and Salary Job Growth