Blog

Colorado New Car Registrations Top Record in 2015

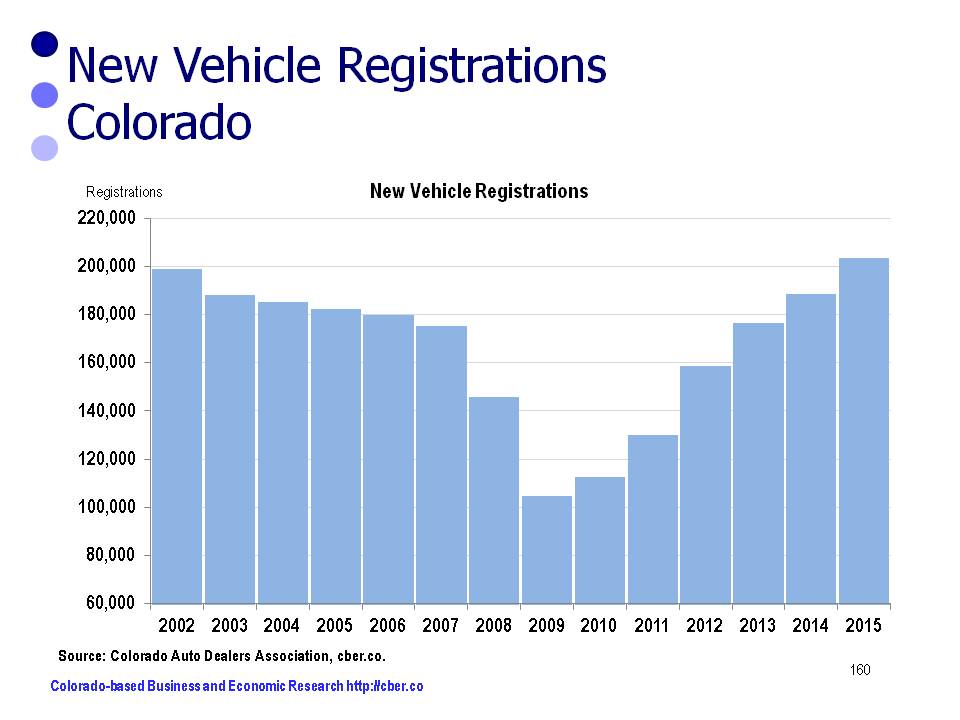
Colorado auto dealers had a banner year in 2015 reaching a record 203,471 new car registrations. This topped the previous high of 198,910 in 2002. Auto sales were driven by low gasoline prices, easy access to credit and low interest rates. In addition, Colorado experienced strong net migration and solid employment growth in 2015.

After peaking in 2002, the number of new registrations gradually tapered off until 2007. At that point they plummeted to 104,687 in 2009.

The number of new car registrations has almost doubled between 2009 and 2015.

Colorado New Car Registrations

About 35% of the 2015 new registrations were light trucks and 65% were autos. Light truck new registrations increased by 15.3% compared to only 3.5% for cars.

Category 2014 2015 % Change
Total 188,416 203,471 8.0%
Cars 73,112 70,561 3.5%
Light Trucks 115,304 "132 910" 15.3%

Almost 45% of the 2015 new registrations were for Japanese brands and 39% were for the top three Detriot brands. Slightly more than 10% were European brands and the remaining 6% were Korean brands.

The new registrations for Detroit and European brands increased by almost 10%, while the Japanese brands increased by slightly more than 7.4%. There was a decline in the number of new registrations for the Korean Brands.

Category 2014 2015 % Change
Detroit Three Brands 71,962 79,113 9.9%
European Brands 19,450 21,293 9.5%
Japanese Brands 84,896 91,154 7.4%
Korean Brands 12,108 11,911 -1.6%

The vehicle segments with the largest gains in market share, 2015 vs. 2014, were compact and compact luxury SUVs. The largest losers were standard mid-size cars and sub-compact cars.

Winners – 2015 vs. 2014

Category Change in Market Share (points)
Compact SUV 1.4
Compact luxury SUV 0.9
Compact pickup 0.8
Full size pickup 0.7
Full size crossover SUV 0.4
Full size van 0.2
Full size luxury SUV 0.1
Mid-size crossover SUV 0.1
Minivan 0.1

Losers – 2015 vs. 2014

Category Change in Market Share (points)
Sub-compact car -1.5%
Standard mid-sized care -1.5%
Entry car -0.7%
Large mid-size car -0.3%
Luxury car -0.3%
Mid-sized luxury SUV -0.2%
Sport-compact car -0.1%

The categories where there was no change in leadership were:
• Near luxury car
• Full-size SUV
• Mid-size SUV
• Sports car

If the economy stays healthy, car sales will likely show record growth in new car registrations again in 2016.

The source for the data in this post is the Colorado Auto Dealers Association.

U.S. Job Market Remains on Solid Ground

Despite the gloom and doom of the new year, there is reason to feel good about the U.S. job market.

The news from the dark side is that oil prices are down, the equity markets are volatile, it is an election year, and there is uncertainty about the global economy….There are always headwinds.

On the sunny side of the street, there is plenty of upside:
• Unemployment is 4.9%.
• About 10 million jobs were added in the last four years (2012 to 2015).
• Weekly initial jobless claims have been below 300,000 for about a year.
• The recent growth in wages exceeds the rate of inflation.
• Low gasoline prices have fueled greater saving and consumption.

Another data series that points to a solid U.S. job market is the Job Openings and Labor Turnover Survey (JOLTS). This infrequency cited database tracks job openings, hires, and separations. They are defined by the BLS as follows:
• Job Openings – All positions that are not filled on the last business day of the month.
• Hires – All additions to the payroll during the month.
• Separations – all employees separated from the payroll during the months.

During periods of economic growth, the number of openings (grey) and hires (red) increases. When the growth of the economy slows as it did in 2001 and 2008 there is a decline in the number of openings and hires. At present both openings and hires are trending upwards.

U.S. Job Market

A closer look at separations shows there are positive trends in its three series (other, quits, layoffs). These series are defined as follows:

• Other Separations – retirements; transfers to other locations; deaths; or separations due to employee disability.
• Quits – Employees who leave a company voluntarily.
• Layoffs and Discharges – Involuntary separations initiated by the employer.

Currently, other separations (grey) are flat, layoffs (blue) and discharges are flat or trending downward, and quits (purple) are increasing. These are indicators of a healthy economy.

separations

As mentioned earlier, the number of hires moves in conjunction with the performance of the economy. During 2008 and 2009 the number of hires declined sharply. At the same time, the number of separations (grey) declined at a much slower rate, i.e. the number of layoffs increased significantly. The result is the massive job losses associated with the Great Recession.

U.S. Job Market

Since 2010, both hires and separations have trended upwards. As there are more job hires, more people quit their jobs to take positions with other companies.

The bottom line – the U.S. job market appears to be on solid footing for the moment.

Panthers vs. Broncos – The Economics of the Two Cities

On February 7, Super Bowl 50 will feature the Panthers vs. Broncos. Without a doubt, most Coloradans think the outcome of the game is a foregone conclusion. Some fans have painted their houses and dyed their hair orange and blue because they know the Broncos will win.

One of the fun parts about the hype of Super Bowls is the statistics associated with the big game. For example, CBS Sports has reported that on Super Bowl Sunday fans will drink 325.5 million gallons of beer and eat 1.25 billion chicken wings. Really?

From an economic perspective how do the city of Charlotte and Denver match up?

The following table includes economic data from the Bureau of Census Quickfacts (2/14/2016) comparing the city of Denver and Charlotte.

Statistic Denver Charlotte Winner
Population estimates, July 1, 2014 663,862 809,958 Charlotte
Population, % change – 4/1/10 to 7/1/14 10.6% 10.1% Denver
Owner-occupied housing unit rate, 2010-2014 49.7% 55.4% Charlotte
Median value of owner-occupied housing, 2010-2014 $257,500 $170,200 Charlotte
Median selected monthly owner costs -with a mortgage, 2010-2014 $1,592 $1,416 Charlotte
Median gross rent, 2010-2014 $913 $902 Charlotte
Households, 2010-2014 271,054 298,815 Charlotte
High school graduate or higher, percent of persons age 25 years+, 2010-2014 85.6% 88.1% Charlotte
Bachelor's degree or higher, percent of persons age 25 years+, 2010-2014 43.7% 40.7% Denver
Persons without health insurance, under age 65 years, percent 17.6% 18.9% Denver
Mean travel time to work (minutes), workers age 16 years+, 2010-2014 24.5% 24.5% Tie
Median household income (in 2014 dollars), 2010-2014 51,800 53,274 Charlotte
Per capita income in past 12 months (in 2014 dollars), 2010-2014 34,423 31,844 Denver
Persons in poverty, percent 18.3% 17.3% Charlotte

Charlotte is the larger of the two cities, but recently Denver has grown at a slightly faster pace. Housing and rent are less expensive in Charlotte and the city has a higher owner-occupied housing rate. Charlotte has a higher percentage of high school degrees, but Denver wins the battle for bachelor’s degrees. Charlotte has a higher median household income, but Denver has a higher per capita income. Charlotte has a higher percentage of people without health insurance, but Denver has a higher rate of persons in poverty.

Both are prosperous cities. Panthers vs. Bronocs. Game on!

December Nonfarm Jobs Data for Colorado – Lackluster Growth

Today, BLS released December unemployment and employment data for Colorado. The seasonally adjusted unemployment rate for the state dropped to 3.5%. This is significantly lower than the U.S. rate of 5.0%.

Workers will benefit from lower unemployment rates, but lower rates are generally bad for businesses. In many cases companies are not able to fill critical positions. In turn they are forced to hire unqualified workers, pay overtime, or leave money on the table.

Nationally, 25 states posted declines in their December unemployment rates compared to November. There were increases in 14 states and no change in the rates for 11 states and the District of Columbia.

BLS reported lackluster nonfarm job growth in Colorado in December. This level of growth is in line with the pattern for U.S. seasonally adjusted nonfarm job growth. On a seasonally adjusted basis there were 10,700 more workers in December than November.

To that point, there was strong growth across the country. Nonfarm payroll employment increased in 36 states and the District of Columbia and it decreased in 14 states.

Looking at U.S. job growth on a quarterly basis there was weak employment growth in Q3, but strong growth in Q4. Given this trend nationally, it stands to reason that Colorado is following that same pattern. The data is in line with the level of activity on the streets.

The data indicates that Colorado added about 20,000 jobs in Q4, after no job growth in Q3.

On March 14th BLS will release its employment benchmark data for 2015. That data will more accurately tell the story of 2015 nonfarm job growth in Colorado.

nonfarm job growth


cber.co Colorado Economic Forecast – Diverse Growth

The primary focus of most state economic forecasts is to project total state employment.

Over the years cber.co has worked on various Colorado economic forecasts – some were multi-year projections, others were one-year annual totals, and some projected sector totals that were added to derive the state total. The latter approach introduced numerous variables for error.

cber.co feels the most accurate forecast is achieved by projecting total employment based on projections for three categories of sectors. Sectors are grouped into three categories based on their past performance.

Projections for the categories and overall employment are based on trends, feedback from business leaders, economic developers, and other economists. The sum of these categories is then used to estimate overall total employment.

Minor adjustments are made and final forecasts are produced for three scenarios. The most likely scenario is used as the final cber.co forecast. This final step helps create a better understanding of upside and downside risk associated with the forecast.

This portfolio approach has made it easy to see that some sectors consistently create jobs at a higher rate of growth, some show solid growth, and others are more volatile. Ultimately, the volatile category tends to have a greater influence on the change in total job growth than the sectors with steady growth.

The most difficult challenge in producing the 2016 forecast was to estimate the 2015 data. The methodology used by BLS to produce the preliminary nonfarm data was flawed. Having said that, the growth of the Strong, Solid, and Volatile Growth Categories will be similar to 2015; however, the total will be slightly less.

The Strong Growth Category of sectors (green) has performed consistently over time. The category added jobs as expected in 2015. Sectors in this category include:
• Professional, Scientific, and Technical Services
• Management of Companies and Enterprises
• Administrative – Business to Business (Not Employment Services)
• Private Education
• Health Care
• Arts, Entertainment, and Recreation
• Other Services.

Recent and projected employment changes for the Strong Growth Category follow:
• 2012 24,000
• 2013 20,100
• 2014 26,900
• 2015 26,700
• 2016 24,000 to 26,000
The 2016 projected rate of growth will be 2.9% to 3.2%, similar to the last two years.

Over time, the Solid Growth Category of sectors (yellow) has been more volatile than the Strong Growth Category and it has grown at a slower pace. In 2015, this category performed as expected. Sectors in this category include:
• Wholesale Trade
• Retail Trade
• State (Not Higher Education)
• Higher Education
• Local (Not K-12 Education)
• K-12 Education
• Accommodations and Food Services

Recent and projected employment changes for the Solid Growth Category follow:
• 2012 15,600
• 2013 26,600
• 2014 24,500
• 2015 24,700
• 2016 23,000 to 25,000
The 2016 projected rate of growth will be 2.3% to 2.5%, similar to the past two years.

Finally, the Volatile Category of sectors (red) was a significant source of growth in 2013 and 2014, but the number of jobs added in 2015 fell off significantly. Sectors in this category include:
• Natural Resources and Mining
• Construction
• Manufacturing
• Transportation, Warehousing, and Utilities
• Employment Services
• Financial Activities
• Information
• Federal Government

Recent and projected employment changes for the Volatile Category follow:
• 2012 15,100
• 2013 22,300
• 2014 30,400
• 2015 21,000
• 2016 20,000 to 22,000.
The 2016 projected rate of growth will be 2.7% to 3.0%, similar to 2015.

The 2016 cber.co Colorado economic forecast portends the state will add 67,000 to 73,000 workers and job growth will be 2.7% to 2.9%.

For additional information about the 2016 cber.co Colorado Economic Forecast click here.

Colorado Economic Forecast

cber.co 2016 Colorado Economic Forecast – Solid Growth

Last week, cber.co released its Colorado economic forecast for 2016. As is the case with most forecasts, the primary focus of the Colorado forecast is employment. As economic developers say, “it all starts with a job.”

Each year the forecast provides an optimistic, pessimistic, and most likely scenario.

The 2016 optimistic scenario calls for:
• U.S. Real GDP growth will be greater than 2.6%.
• Colorado will add more than 73,000 workers, the rate of job growth will be greater than 2.9%.

The projected likelihood of this scenario is 18%. The Colorado economy has experienced solid job growth since 2012; however, given the slowdown in the global economy and the lower price of oil, it is unlikely the state will experience accelerated growth.

The pessimistic scenario calls for:
• U.S. Real GDP growth will be less than 2.3%.
• Less that 67,000 Colorado workers. Job growth will be less than 2.7%.
The projected likelihood of this scenario is 22%. While the global and U.S. economies are expected to see slight growth in output, the Colorado economy could be derailed if the price of oil stays low and the global economy slows further.

The most likely scenario calls for:
• U.S. Real GDP will be 2.3% to 2.7%.
• The U.S. will add at least 2.7 million workers.
• Colorado will add 1.8% of total U.S. jobs added.
• Colorado will add 67,000 to 73,000 workers, job growth will be 2.7% to 2.9%.

Despite downside risks there is a 55% likelihood this forecast will occur. Since 2012 growth has been steady and broad-based. Much of the growth has been in sectors such as tourism, which have an indirect link to the extractive industries.

The bottom line – look for continued job growth in Colorado, but at a slower rate than 2015.

For additional information about the 2016 cber.co Colorado Economic Forecast click here.

colorado economic forecast

Q3 2015 Real GDP Records 2.0% Gain

On December 22nd, the Bureau of Economic Analysis released the “third estimate” of the Q3 2015 Real GDP for the United States. It increased at an annualized rate of 2.0% compared to 3.9% for Q2.

The nominal or current-dollar GDP (chained on 2009) for Q3 increased by $146.5 billion to $18,060.2 billion, a gain of 3.3%. The Q2 current-dollar GDP rose by 6.1% or $264.4 billion.

2015 Real GDP, Chained Dollars (2009 Billions)


Q1

Q2

Q3

        Gross domestic product

$16,177

$16,334

$16,414

Personal consumption expenditures

$11,081

$11,179

$11,262

    Goods

$3,804

$3,855

$3,902

    Services

$7,277

$7,325

$7,363

Gross private domestic investment

$2,830

$2,865

$2,860

    Fixed investment

$2,701

$2,736

$2,761

        Nonresidential

$2,189

$2,211

$2,225

        Residential

$512

$524

$534

    Change in private inventories

$113

$114

$86

Net exports of goods and services

$(541)

$(535)

$(546)

    Exports

$2,091

$2,118

$2,121

        Goods

$1,429

$1,452

$1,449

        Services

$661

$664

$671

    Imports

$2,633

$2,652

$2,667

        Goods

$2,161

$2,178

$2,186

        Services

$470

$472

$480

Government consumption expenditures

$2,839

$2,857

$2,870

    Federal

$1,111

$1,111

$1,112

        National defense

$680

$681

$678

        Nondefense

$431

$430

$433

    State and local

$1,726

$1,744

$1,756

Residual

$(41)

$(45)

$(49)

The 2015 Q3 Real GDP posted gains in the following areas:
• Personal consumption expenditures, the largest category, were up by 3.0% compared to 3.6% in the previous quarter. Goods were up 5.0% and Services were up 2.1%.
• Fixed investments posted a gain of 3.7% in Q3, down from 5.2% in Q2. Nonresidential investments for Q3 were up 2.6% and residential investments rose 8.2%. Both had lower levels of growth than Q2.
• Exports posted a gain of 0.7% for Q3 compared to 5.1% in Q2. Goods actually declined by -0.9% while services increased by 3.9%.
• Imports recorded an increase of 2.3% in Q3 compared to 3.0% in Q2. Goods increased by 2.3% while services posted a 6.4% increase. (Note: Imports are subtracted from the value of the GDP).
• Government consumption increased by 1.8% in Q3 compared to 2.6% in Q2. Federal spending was flat with a decrease in national defense spending and an increase in Nondefense spending. State and local government spending posted a 2.8% gain, down from 4.3% in the prior quarter.

Percent Change From Preceding Period in Real GDP – Seasonally Adjusted at Annualized Rates

Q1 Q2 Q3
        Gross domestic product 0.6 3.9 2.0
Personal consumption expenditures 1.8 3.6 3.0
    Goods 1.1 5.5 5.0
    Services 2.1 2.7 2.1
Gross private domestic investment 8.6 5.0 -0.7
    Fixed investment 3.3 5.2 3.7
        Nonresidential 1.6 4.1 2.6
            Structures -7.4 6.2 -7.2
            Equipment 2.3 0.3 9.9
            Intellectual property products 7.4 8.3 -0.8
        Residential 10.1 9.3 8.2
    Change in private inventories
Net exports of goods and services
    Exports -6.0 5.1 0.7
        Goods -11.7 6.5 -0.9
        Services 7.3 2.3 3.9
    Imports 7.1 3.0 2.3
        Goods 7.2 3.2 1.4
        Services 6.7 2.0 6.4
Government consumption expenditures -0.1 2.6 1.8
    Federal 1.1 0.0 0.2
        National defense 1.0 0.3 -1.4
        Nondefense 1.2 -0.5 2.8
    State and local -0.8 4.3 2.8
Addendum:
    Gross domestic product, current dollars 0.8 6.1 3.3

Q4 2015 Real GDP is expected to be stronger than Q3 and the rate of growth for 2015 will be in the range of 2.3% to 2.5%.

Which has the Top Economy – Colorado, Utah, Washington?

There are frequent references in the local media about how Colorado is one of the top state economies in the country. And it is!

There are many metrics that can be used to compare state economies. The two best metrics are the growth rates for Real GDP and employment. In this post we look at these metrics from 2005 to the present for Colorado, Utah, Washington and the U.S.

Employment
• Washington has the greatest number of employees, followed by Colorado.
• Utah had the highest rate of employment growth of the three states. Colorado and Washington have grown at similar rates; however, Washington’s rate of growth has been off a larger base of employment.
• Employment for all three states has grown at a faster rate than the U.S. That rate of growth has accelerated since 2010 for all three states.

Colorado Utah Washington

Real GDP
• Washington has the largest GDP, followed by Colorado.
• The Real GDP for all three states has grown at a higher rate than the U.S.
• Utah had the fastest rate of Real GDP growth from 2005 to present followed by Washington. Colorado is third.
• Since the end of the recession the GDP for all three states has grown at a faster rate than the United States. Colorado had the fastest rate of Real GDP growth from 2013 to present because of the rapid growth in the extractive industries. That rate of growth is likely to decrease in 2015 and beyond as a result of challenges facing the oil and gas industry caused by lower oil prices.

Colorado Utah Washington

Based on these metrics Washington has the largest economy and Utah is growing at a faster rate than the other two states. The strengths of the economies in Utah, Washington, and Colorado make them great places to live, work, and play. Here’s to a prosperous year for all three states in 2016.

State Agencies Release 2016 Economic Forecasts

On December 21st, the Colorado Legislative Council (CLC) and the Governor’s Office of State Planning and Budgeting (OSPB) released their quarterly 2016 economic forecast . (https://www.colorado.gov/cga-legislativecouncil and https://sites.google.com/a/state.co.us/ospb-live/). The two reports provide slightly different estimates for 2015 and forecasts for 2016, both of which are supported by rational explanations. A comparison of the 2015 estimates for key indicators follows.

2015 Estimates

At the national level, the major difference is that OSPB expects U.S. unemployment to be slightly higher.

At the state level there are several items to make note of:
• Both organizations have indicated stronger than anticipated population growth.
• CLC projected employment to be near the current levels published by the Bureau of Labor Statistics. OSPB projected employment to be near the estimated benchmark revisions that will be made in March.
• Inflations in Colorado is much higher than the U.S. OSPB’s projection for employment is slightly higher than the CLC projection.
• OSPB is more optimistic than CLC about the number of construction permits issued in 2015.

U.S. Economy December 2015 Estimate for 2015
Category CLC OSPB
Real GDP % Change 2.5% 2.4%
Employment   Change % 2.9 million

2.1%

2.8 million

2.0%

Unemployment Rate 5.0% 5.3%
Inflation (CPI) 0.1% 0.1%
Colorado Economy December 2015 Estimate for 2015
Category CLC OSPB
Population Change /% +101,200

1.9%

+98,000

1.8%

Employment Change/% +57,600

2.3%

+69,000

2.8%

Unemployment Rate 4.0% 4.1%
Retail Trade Sales (Millions)/% $93,191

2.8%

$94,200

4.3%

Home Permits (000s) 28.6 31.0
Denver-Boulder Inflation Rate 1.1% 1.5%

2016 Forecasts

At the national level, the two groups have similar forecasts. OSPB forecasted slightly higher U.S. inflation than CLC.

At the state level there are several items to make note of:
• Both groups are projecting population growth similar to 2015.
• Both groups are forecasting continued job growth; however, it will be at a slower level. There are drastic differences in the projected employment levels.
• OSPB is much more optimistic that CLC about construction growth.
• Inflation will be about one percentage point greater than the U.S. level.

December 2015 U.S. – 2016 Economic Forecast 
Category CLC OSPB
Real GDP % Change 2.3% 2.3%
Employment Change/% 2.6 million

1.8%

2.4 million

1.7%

Unemployment Rate 4.8% 4.8%
Inflation (CPI) 1.6% 1.8%
December 2015 Colorado – 2016 Economic Forecast
Category CLC OSPB
Population Change /% +95,200

1.7%

+97,300

1.8%

Employment Change/% +47,300

1.9%

+66,800

2.6%

Unemployment Rate 3.8% 3.8%
Retail Trade Sales (Millions)/% $98,037

5.2%

$99,400

5.5%

Home Permits (000s) 32.0 37.9
Denver-Boulder Inflation Rate 2.4% 2.5%

The bottom line is that the state is expected to show continued job growth. The question is whether or not it will be at a level that is weak to average or will be average to modest growth.

Employment Data for November Shows Continued Deterioration in Colorado Job Growth

The Bureau of Labor Statistics released wage and salary employment data for November that shows the level of Colorado job growth continued to deteriorate. In October, the jobs data reported there were 49,000 more jobs than 2014 and the difference for November was 43,600 jobs.

On a quarterly basis employment gains for 2015 are as follows:
• Q1 75,000
• Q2 60,200
• Q3 46,400
• Q4 46,300 (estimated).

The current employment data shows the state is on track to add 57,000 jobs in 2015. Henry Sobanet, Director of the Governor’s Office of State Planning and Budgeting recently stated the slowdown in the rate of job growth could be attributed to two things – the lower price of oil and the slower growth in the Chinese economy. In other words, the slowdown is a “bump in the road” and not a major recession.

Through the first eleven months of the year:
• About 78.8% of the total jobs added were in the top five sectors: Health Care; Accommodations and Food Services; Construction; Professional, Scientific, and Technical Services; and Financial Activities.
• Approximately 24.8% of all jobs added were in Leisure and Hospitality (Accommodations and Food Services plus Arts, Entertainment, and Recreation).
• About 10.9% of total jobs added were in the PST, Manufacturing, and Information Sectors. These sectors are the source of primary and advanced technology jobs.

Projected revisions, which will be made in March 2016, are estimated to bring Colorado job growth closer to the lower limit of the 2015 cber.co forecast, a forecasted increase of 73,000 to 79,000 jobs.

The total number of unemployed workers at the end of November 2015 was 102,035.

The total number of unemployed is 8,306 greater than the trough in May 2007 and 138,542 less than the peak in October 2010.

Lower unemployment rates have brought about shortages of trained workers in key sectors and occupations. The November 2015 unemployment rate of 3.6% is down from 4.3% in November 2014. In addition there are 19,567 fewer unemployed workers compared to a year ago.

The lower unemployment rates across the state are a mixed blessing. On the positive side, workers who are on the sideline will have more and better opportunities to find a job if their skills match the current openings. It is also likely that upward wage pressures my make it possible for them to be paid higher wages. On the downside there will be greater turnover at companies as people jump to “better” jobs, which may reduce productivity and drive up operational costs.

Looking ahead, 2016 stands to be a solid year if the unemployment rate will stabilize and job increases will be stronger than they were in the second half of 2015.

colorado jobs data