U.S. Economic Forecast 2021

The U.S. economic forecast points to improvement in Q3 and Q4. The value of real GDP slowed in Q4 2020. A slower rate of growth will continue in Q1 2021. Economic growth will resume in Q2. The value of real GDP will return to its pre-pandemic level in the second half of 2021.

A similar pattern will occur in the labor market. Job losses are likely to occur in Q1. By mid-year, job growth will return. Total employment will return to its 2019 level in 2022 or 2023. The uptick in unemployment claims will cause the unemployment rate to remain higher than usual. As more people are vaccinated, the economy will open further, and more people will return to work.

The hospitality industry has been hit hard by the lockdowns and restrictions. Employment in those areas is not expected to return until 2023. On a similar note, the airline industry was off by as much as 95%, compared to the prior year. Domestic air travel is not expected to return to pre-pandemic levels until 2023. International air travel will return in 2024.

U.S. Economic Forecast

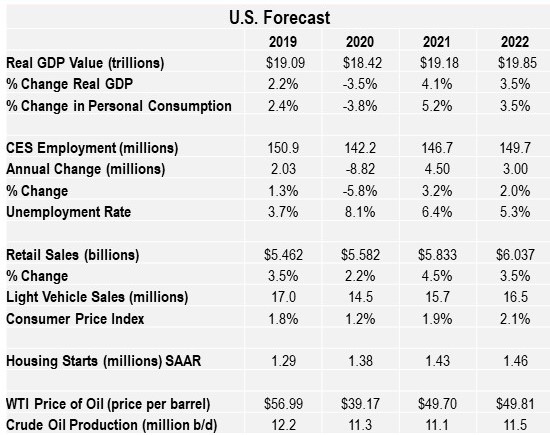
Personal consumption will become positive in 2021. Pent-up demand and stimulus support will drive retail sales higher in 2021. Both will return to pre-pandemic levels in 2022.

Light vehicle sales will gradually improve and return to 17 million units in 2023. At the moment, the automobile industry is plagued with a shortage of semiconductors. This will negatively impact sales.

Inflation will remain near the Federal Reserve’s target of 2.0%. Having said that, some economists fear the stimulus package will cause inflation problems in 2021.

The number of housing starts will increase in 2021 as interest rates remain low.

Crude oil production and prices will remain flat in 2021.They will post slight increases in 2022.

While the overall U.S. economic forecast is positive, there is still significant headwinds.

2015 cber.co Forecast – Fine Tuning the Volatile Category

In preparing its annual forecast, cber.co divides the NAICS sectors into three categories. This portfolio approach makes it easy to see that some sectors consistently create jobs at a higher rate of growth, some show solid growth, and others are more volatile. Ultimately, the volatile category tends to have a greater influence on the magnitude of change in total job growth than the sectors with steady growth. In March 2015 BLS released its benchmark revision of the 2014 data. The changes were more significant than usual.

As a result  the 2015 cber.co forecast was fine-tuned to have a better understanding of categories and sectors that were driving the economy. This brief discussion highlights the revisions to the 2015 cber.co forecast. This post will evaluate the Volatile Category.

The Volatile Category

Over the past two decades the sectors listed below were the primary source of volatility in total employment.

The sectors are:

  • Natural Resources and Mining
  • Construction
  • Manufacturing
  • Transportation, Warehousing, and Utilities
  • Employment Services
  • Financial Activities
  • Information
  • Federal Government

Total employment for this category was:

  • 1994  625,400 workers, 35.6% of total employment
  • 2004  716,000 workers, 32.8% of total employment
  • 2014  713,000 workers, 29.0% of total employment

2015 cber.co forecast

Estimated Job Growth

As can be seen below there is a significant difference between the original estimates for 2014 (January 11) and Benchmark revisions for 2014 (March 27). BLS significantly underestimated growth in this category in 2014.

The original Volatile Category estimates/forecast (January 11 Forecast) was + 23,000 to 27,000 Employees.

  • 19,800 jobs added in 2013
  • 25,600 jobs added in 2014
  • 706,100 employees in 2014

In 2015 between 23,000 and 27,000 jobs will be added, at a rate of 3.3% to 3.7%. This rate of growth is slightly slower than 2014.

The updated Volatile Category estimates/ forecasts, after benchmark revisions (March 27 Forecast) was + 23,000 to 27,000 Employees.

  • 22,200 jobs added in 2013
  • 30,000 jobs added in 2014
  • 713,000 employees in 2014

In 2015, between 23,000 and 27,000 workers will be added at a rate of 3.2% to 3.8%. Despite the significant underestimate in 2014, the forecast for 2015 was unchanged.

The recalibration of the 2015 forecast resulted in the following changes:
• The Strong Growth Category was revised upward by 4,500.
• The Solid Growth Category was revised downward by 1,500.
• The Volatile Category remained unchanged.
• The net change to the 2015 forecast was an upward revision of 3,000; however, the 2015 forecast is for total growth slightly below the 2014 total.

The change in the mix of jobs being added is equally as important as the change in the number of jobs being added. For further information on the cber.co forecasts click here.

2015 cber.co forecast


2015 cber.co Forecast – Fine Tuning Solid Growth Category

In preparing its annual forecast, cber.co divides the NAICS sectors into three categories. This portfolio approach makes it easy to see that some sectors consistently create jobs at a higher rate of growth, some show solid growth, and others are more volatile. Ultimately, the volatile category tends to have a greater influence on the magnitude of change in total job growth than the sectors with steady growth.
In March 2015 BLS released its benchmark revision of the 2014 data. The changes were more significant than usual.

As a result cber.co fine-tuned the 2015 employment forecast to have a better understanding of categories and sectors that were driving the economy. This brief discussion highlights the revisions to the 2015 cber.co forecast. This post will evaluate the Solid Growth Category.

The Solid Growth Category

Over the past two decades the following sectors generally posted gains. The category posted stronger jobs gains during the 1990s than the 2000s.
• Wholesale Trade
• Retail Trade
• State (Not Higher Education)
• Higher Education
• Local (Not K-12 Education)
• K-12 Education
• Accommodations and Food Services

Total employment for this category was:
1994  685,400 workers, 39.0% of total employment
2004  848,000 workers, 38.9% of total employment
2014  961,100 workers, 39.0% of total employment.

2015 cber.co forecast

Estimated Job Growth

As can be seen below there is a significant difference between the original estimates for 2014 (January 11) and Benchmark revisions for 2014 (March 27).

The original Solid Growth Category estimates/forecast (January 11 Forecast) was + 20,000 to 24,000 Employees.

• 27,600 jobs added in 2013
• 25,200 jobs added in 2014
• 964,000 employees in 2014
• In 2015, between 22,000 and 28,000 workers will be added at a rate of 2.6% to 2.8%. The rate of growth is similar to 2014.

The updated Solid Growth Category estimates/ forecasts, after benchmark revisions (March 27 Forecast) was+ 22,500 to 26,500 Employees.

• 26,700 jobs added in 2013
• 23,300 jobs added in 2014
• 961,100 employees in 2014
• In 2015, between 22,500 and 26,500 workers will be added at a rate of 2.3% to 2.8%

BLS overestimated the growth of jobs in the Solid Growth Category.
As a result changes were made to the 2015 category and total employment projections.

In 2015, the rate of growth will be 2.3% to 2.8%. This rate of growth is similar to 2014 and most years during the 1990s.

The recalibration of the 2015 forecast resulted in the following changes:
• The Strong Growth Category was revised upward by 4,500.
• The Solid Growth Category was revised downward by 1,500.
• The Volatile Category remained unchanged.
• The net change to the 2015 forecast was an upward revision of 3,000; however, the 2015 forecast is for total growth slightly below the 2014 total.

The change in the mix of jobs being added is equally as important as the change in the number of jobs being added.

For further information on the cber.co forecasts click here.

2015 cber.co forecast

2015 cber.co Forecast – Fine Tuning Strong Growth Category

In preparing its annual forecast, cber.co divides the NAICS sectors into three categories. This portfolio approach makes it easy to see that some sectors consistently create jobs at a higher rate of growth, some show solid growth, and others are more volatile. Ultimately, the volatile category tends to have a greater influence on the magnitude of change in total job growth than the sectors with steady growth.

In March 2015 BLS released its benchmark revision of the 2014 data. The changes were more significant than usual.

As a result cber.co fine-tuned the 2015 employment forecast to have a better understanding of categories and sectors that were driving the economy.  This brief discussion highlights the revisions to the 2015 cber.co forecast. This post will evaluate the Strong Growth Category.

solid growth

The Solid Growth Category

Over the past two decades the following NAICS sectors have been the foundation for consistent growth in Colorado employment.
• Professional, Scientific, and Technical Services
• Management of Companies and Enterprises
• Administrative – Business to Business (Not Employment Services)
• Private Education
• Health Care
• Arts, Entertainment, and Recreation
• Other Services.

Total employment for this category was:
1994 445,200 workers, 25.4% of total employment
2004 615,900 workers, 28.3% of total employment
2014 786,700 workers, 32.0% of total employment

Estimated Job Growth

As can be seen below there is a significant difference between the original estimates for 2014 (January 11)  and Benchmark revisions for 2014 (March 27).

The original Strong Growth Category estimates/forecast  (January 11 Forecast) was  + 20,000 to 24,000 Employees.
• 20,300 jobs added in 2013
• 20,900 jobs added in 2014
• 782,500 employees in 2014
• In 2015, between 20,000 and 24,000 workers will be added at a rate of 2.8% to 3.0%.

The updated Strong Growth Category estimates/ forecasts, after benchmark revisions (March 27 Forecast) was + 24,500 to 28,500 Employees.
• 20,000 jobs added in 2013
• 25,600 jobs added in 2014
• 786,700 employees in 2014
• In 2015, between 24,500 and 28,500 workers will be added at a rate of 3.1% to 3.6%.

BLS significantly underestimated the magnitude of growth in total employment as well as the increase in the number of jobs in the Strong Growth Category. As a result changes were made to the 2015 category and total employment.

In 2015, between 24,500 and 28,500 workers will be added. The rate of growth will be 3.1% to 3.6%. This rate of growth is slightly greater than 2014. Absolute job growth of this category will be similar to job growth in 2007 and 2014.

Total employment for the state will increase by 73,000 to 79,000.

The recalibration of the 2015 forecast resulted in the following changes:

• The Strong Growth Category was revised upward by 4,500.
• The Solid Growth Category was revised downward by 1,500.
• The Volatile Category remained unchanged.
• The net change to the 2015 forecast was an upward revision of 3,000; however, the 2015 forecast is for total growth slightly below the 2014 total.

The change in the mix of jobs being added is equally as important as the change in the number of jobs being added. For further information on the cber.co forecasts click here.

summary of employment growth by category

cber.co Colorado Economic Forecast for 2014 – 68,000 to 74,000 Jobs to be Added

In 2013 the state experienced natural disasters and self-inflicted political wounds, yet Colorado employment grew at a faster than expected rate. The cber.co economic forecast points to continued expansion  for 2014.

On a Positive Note…

  • The state population grew at a higher rate than expected in 2013. Stronger growth is on tap for 2014.
  • The story is the same for employment. In 2013, the state added approximately 68,000 workers and will add another 68,000 to 74,000 in 2014. This represents job growth in the rage of 2.9% to 3.1%.
  • Unemployment will continue to decline, and will be in the range of 5.5% to 5.8% at the end of 2014.
  • In 2013 consumers were delighted that gasoline prices declined. At the moment there is no reason to believe they will rise precipitously (knock on wood).
  • Colorado new car registrations have risen steadily for the period 2010 to 2013. A decline is unlikely in 2014.
  • Colorado’s general fund, particularly sales and income taxes, has been a benefactor of increased population, employment, and wages. Likewise the revenue for city and county governments has improved.

Some Mixed News…

  • Per Capita Personal Income will increase by 3.7% in 2014.  This is slightly less than the rate of growth for the U.S. Over the past two decades the gap between the U.S. PCPI and the state PCPI has closed significantly.
  • In 2014, Colorado inflation will be 3.0%, well above the rate for the U.S.
  • In Colorado, housing prices have increased at a faster rate than the nation. That is great news for home owners, but not so good news for people wanting to enter the housing market.
  • The Construction Sector is slowly improving.  Increased building activity supports growth in multiple sectors and causes greater congestion on the highways. For some, the latter is not desirable.
  • Although the state returned to 2008 peak employment, it will be a long time before the state returns to the 2007 peak number of establishments.

Looking ahead, the economy will build on the foundation established in 2013. Hopefully the state’s leadership will be less dysfunctional.

Click here to review the cber.co forecast and other economic reports.

cber.co forecast

©Copyright 2011 by CBER.

Leeds Economic Forecast Points to Slower Growth in Year Ahead – AGAIN

On December 8th Professor Richard Wobbekind and the Leeds School of Business (SOB) released the 49th annual economic forecast for Colorado. Unfortunately, the fundamentals of the 2014 outlook were as questionable as the 2012 and 2013 forecasts.

For three consecutive years (2012 to 2014) the SOB has projected fewer jobs would be added in the coming year, even though Real GDP was predicted to increase significantly in two of those three years.

A summary of the SOB forecasts from 2012 to 2014 are provided in the table below.


Leeds School of Business Forecast – US Real GDP and Colorado Employment

Year

Change in Real GDP

Change in State Employment


2012

In 2012 Real GDP will show a significant increase in the rate of growth for 2011

Fewer jobs will be added in the coming year


2013

In 2013 Real GDP will growth at about the same rate as 2012, a slight decrease is possible

Fewer jobs will be added in the coming year


2014

In 2014 Real GDP will increase at a rate almost double the 2013 rate

Fewer jobs will be added in the coming year


Source:  SOB BEOF publications


The actual data for 2012 and preliminary data for 2013 are provided in the table below.


Performance of the Economy – US Real GDP and Colorado Employment

Year

Change in Real GDP

Change in State Employment


2012

The rate of growth of 2012 was significantly greater than the rate of growth for 2011

More jobs were added in 2012 than 2011


2013

The 2013 preliminary rate of growth was significantly lower than the rate of growth for 2012.

More jobs were added in 2013 than 2012


2014

To be determined

To be determined


Source: BLS, BEA, CBER


A historical look at the recoveries from the last three recessions is instructive.

After the 1991 recession, Colorado added jobs at an increasing rate for three years (1992 to 1994). This recovery was exceptionally strong. Job growth in 1994 was second highest in state history.

  •  Following the 2001 recession, Colorado “added” jobs at an increasing rate for four years (2003 to 2006). That rate of recovery for that period was anemic, but improving. Continued job growth at an increasing rate was cut short by the 2007 recession.
  •  After the 2007 recession, Colorado has “added” jobs at an increasing rate for four years (2010 to current). The rate of recovery has been so-so. In other words, there is a strong likelihood that job growth will continue at an increasing rate in 2014.

The saying “Every blind squirrel finds an acorn now and then” can be applied to the 2012-2014 SOB forecasts. If they continue to predict the state will add fewer jobs next year than this year, at some point they will be correct. Will 2014 finally be the year they are right?

We can only hope the SOB is wrong again!


©Copyright 2011 by CBER.

CBER Colorado Economic Forecast 2013 – Growth Rate Similar in Year Ahead

CBER recently released its forecast of the Colorado economy and at the risk of sounding like a broken record, 2013 will look a lot like 2012 and 2011.

  • U.S. Real GDP will be in the range of 1.9% to 2.3%
  • The U.S. will add 1.9 to 2.1 million workers
  • Colorado will account for 2.5% of U.S. jobs added
  • Colorado will add 45,000 to 55,000 workers.

Since the end of the recession, Colorado employment has had five false starts. Despite serious national and international headwinds, the state may finally have enough momentum to begin showing solid, sustained job growth beginning in the second half of 2013.

Strong Growth Category ( About 32% of total employment)

This category has consistently posted strong growth over the past two decades. In 2013, job growth will be 2.9% to 3.1%, slightly below the category’s annualized growth rate of 3.25% for 1990 to 2011.

Limited Growth Sectors (about  40% of total employment)

This category has consistently posted solid growth over the past two decades (Annualized rates for the sectors range between 1.1% to 2.2%.) In 2013, job growth will be 1.4% to 1.6%, slightly below the category’s annualized growth rate of 1.85% for 1990 to 2011.

Volatile Growth Sectors (28% of total employment)

This category has been inconsistent in its growth rates over the past two decades. It is expected to add jobs at a rate of 2.1% to 2.3%. This is above the category’s annualized growth rate of about 0.79% for 1990 to 2011. This variance from the average is a reflection of the category’s  volatility.

©Copyright 2011 by CBER.

Occupy the Labor Market – Shields Foretells Growth in Northern Colorado

In January, Dr. Martin Shields, CSU economics professor, produced his business and economic forecast for the Northern Colorado Business Review. In short, Shields pointed out that the U.S. will see a lackluster recovery that will be driven by national and international events (debt, war, oil prices, political crises, etc.)

At the national level, Shields emphasized three points:
• “Tepid and sustained” Real GDP growth.
• The decline in unemployment will be slow as the median number of weeks that workers are unemployed remains high, based on the slow rate at which jobs are being created.
• Core inflation has returned to pre-recession levels.

The Northern Colorado economy will continue to be a mixed bag, although it has been a leader in the recovery. It is expected to continue in that role. Nevertheless, unemployment will be high by historical standards. Locals have struggled with the decline in real household income, a challenge that is likely to continue in the months ahead.

Shields also emphasized the following:
• Northern Colorado lost 5,900 jobs over the past 3 years.
• On a positive note, the region added 1,900 jobs in the past year.
• Since 2008 the number of unemployed workers in the region has increased by 6,700.
• Larimer and Weld County have performed differently during the Great Recession.
o Larimer’s labor market has been stronger
o Median household income in Larimer has declined.
o Weld County household income has remained flat.
• FFHA data shows that housing prices are stagnant.
• While it is encouraging that there is an uptick in housing starts, it must be noted that the increase is small and it is from a very low base.

Looking ahead, Shields foretells continued growth in 2012.
• The unemployment rate might approach 5.0% in Larimer County.
• In Weld County, unemployment might fall below 8.0%.
• Between 2,700 and 3,300 workers might be added to local payrolls.
The Government, Information, and Financial Activities sectors will struggle, while the energy, food manufacturing, health care, and professional business services sectors will continue to grow.

Shields heavily emphasized the term “might” in each of his projections. In closing he stated that the real challenge will be to add jobs that pay good wages.


©Copyright 2011 by CBER.

Colorado Economic Forecast Challenges (Education, Industries, Clusters)

Another year, another economic forecast.

Looking ahead to 2012, the state will again experience improved, but below average employment growth. Cber.co is projecting that U.S. real GDP growth will be 2.1% to 2.5% in 2012, with employment growth of 27,500 to 37,500 in Colorado. For more details about the Cber.co 2012 Economic Forecast, click here.

There are a myriad of challenges facing the Colorado and U.S. economies in 2012. Some of the key questions relating to these challenges are categorized into the following four areas:
Demand for goods and services;
• Debt, the financial system, and politics;
• Education and workforce; and
• Industry and cluster issues.

This post raises questions about the topics of education and workforce; and industry and cluster issues. The topics of demand for goods and services; and debt, the financial system, and politics were discussed in a post entitled “Colorado Economic Forecast – Challenges (Demand and Debt).”

Education and the Workforce
• When will the higher education bubble burst?
• How will higher education improve their performance in the classroom?
• How will the state fund PK-12 education, particularly given the outcome of the Lobato education adequacy lawsuit?
• Are high school and college students learning skills that can be transferred between professions?
• What is being done to address the mismatch between the skills that companies need and the skills of job applicants?
• What is the role of the older worker in the workforce? How are companies addressing their impending retirement?
• Has Colorado lost its pool of trained workers as a result of the Lost Decade?

Industry Issues
• How has Colorado’s high tech cluster weathered the Lost Decade?
• Has Colorado lost its critical mass of manufacturers?
• Has Colorado lost the supply chain associated with the decline in its manufacturers?
• Is Colorado saturated with retail stores?
• How will second and third generation businesses transition into the future?
• How much longer can the Health Care sector continue to add jobs?

Cluster Issues
• Is homeland security a cluster that is still important to the state?
• What happened to Colorado’s nanotechnology cluster? Five years ago it was top 10 in the country. Today it is seldom mentioned?
• Several studies have pointed to the rise of Colorado’s biosciences cluster? How will this translate into growth at Fitzsimons?
• How is the software industry going to survive and thrive given the mismatch of skills in the labor pool and the needs of the companies?
• Will 2012 be the year that photonics is recognized for its contribution to the state economy?
• Are state and local leaders poised for the volatility of the renewable energy cluster?
• How will budget reductions affect Colorado’s defense and aerospace clusters?

Clearly, it is easier to point out the difficult challenges than it is to answer questions relating to them. As well, additional obstacles will be added to the list throughout the year. While there is a lot that could go wrong, it is important to keep in mind the state has an equally impressive list of assets that can be used to address the challenges of the future. Game on!


©Copyright 2011 by CBER.

Cber.co Colorado Economic Forecast 2012 – Continued Improvement

The economy is fragile and there are a number of variables that could alter any forecast. At the risk of sounding like a broken record, 2012 will look a lot like 2011. Colorado will experience below average growth for another year. Cber.co is projecting that we will see real GDP growth of 2.1% to 2.5% in 2012, with employment growth of 27,500 to 37,500 in Colorado.  Go to Cber.co for the 2012 Colorado Economic Forecast.

The sectors of the economy can be evaluated in three groups: solid growth, limited growth, and volatile growth. A summary of these analyses for each of the groups follows.

Solid Growth Sectors (About 41% of total employment)

These sectors posted stronger growth in 2011 than any time in the past two decades. Growth will taper off slightly 2012 with the addition of at least 1,500 jobs in each of the following sectors.

Tourism
Private Education and Health Care
Professional and Scientific
Extractive Industries
Wholesale Trade
Employment Services
Higher Education

In total, these sectors will add 26,500 to 32,500 net jobs in 2012.

Limited Growth Sectors (about 26% of total employment)

In 2011 these sectors individually recorded minimal change in their number of employees. Significant change is unlikely in a slow economy.

Personal (Other) Services
Utilities
Retail Trade
Corporate Headquarters (MCE)
State (Not Higher Education)
Manufacturing
Transportation & Warehousing

Combined, these sectors will add 3,000 to 9,000 net jobs.

Volatile Growth Sectors (33% of total employment)
These sectors have either bottomed out, are near the bottom, or have turned the corner. Combined they will shed fewer jobs than in 2011.

Construction
Financial Activities
Information
Federal Government
B-to-B (Not Employment Services)
Local Government (Not K-12)
K-12 Education

Combined, there will be a change of -6,000 to 0 net jobs.

2012 Employment Outlook

Because the economy is still not on a solid foundation, it is reasonable to provide three scenarios for the summation of the above groups: optimistic, most likely, and pessimistic.

Optimistic Scenario
U.S. Real GDP 2.6%+
More than 37,500 Colorado Workers or More

Most Likely Scenario
U.S. Real GDP 2.1 % to 2.5%
+ 27,500 to 37,500 Colorado Workers

Pessimistic Scenario

U.S. Real GDP  1.6% to 2.0%
Less that 27,500 Colorado Workers

If probabilities were to be assigned to each of these scenarios, they would be as follows:
Most Likely   55%
Pessimistic 25%
Optimistic 20%.
At the time the forecast for 2012 was prepared, there was slightly more downside risk.

To access the Cber.co 2012 Colorado Economic Forecast click here.
©Copyright 2011 by CBER.