The 2018 Colorado Economic Forecast – Call it Steady

The best description of the 2018 Colorado economic forecast is steady.

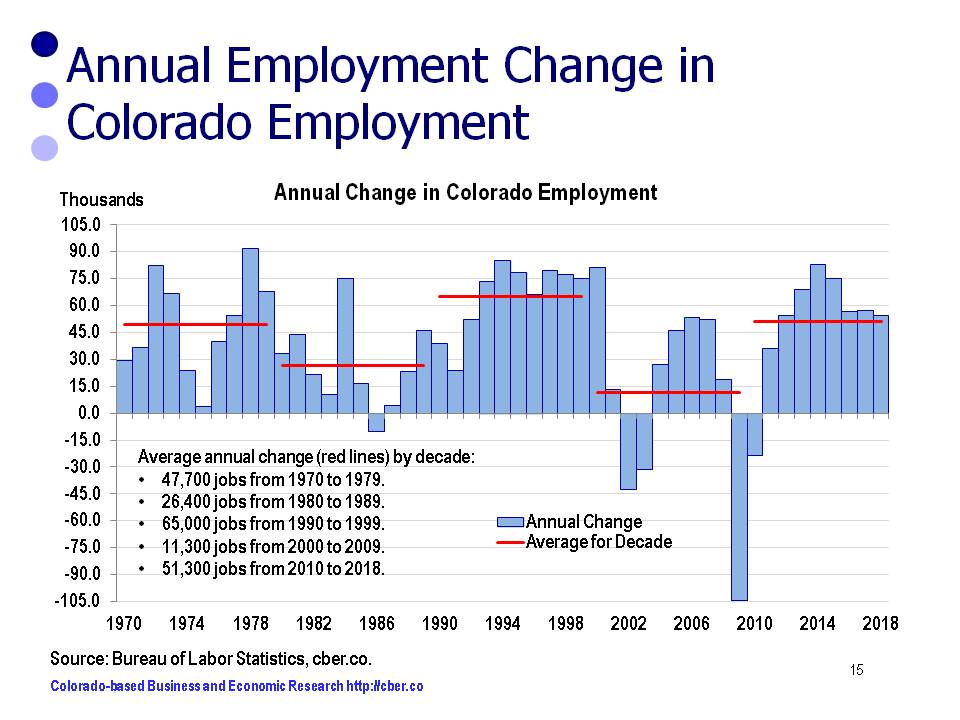
After adding jobs at a rate of 2.2% in both 2016 and 2017, Colorado will add jobs at a rate of 2.0% in 2018. Given all the moving pieces in an economy, that is steady!

Watch for the following on Colorado’s economic front in the coming months.

  • Colorado will benefit from stable global and U.S. real GDP growth.
    Net migration will be comparable to the last two years.
  • The Colorado inflation rate will increase; it will be about a point greater than the U.S. rate.
  • The Colorado economy is not operating efficiently because the unemployment rate is too low.
  • The Colorado real GDP growth rate will be greater than the U.S. rate and will be driven by health care, real estate, and the extractive industries.
  • The state’s economic growth would be slowed if the Fed Funds rate is increased 3 times in 2018.
  • Manufacturing growth will be driven by a handful of larger companies.
  • Retail trade is evolving. Retail sales will remain strong. 
  • The 2018 legislative session will be dicey as legislators struggle to address social issues, congestion, transportation issues, the state pension fund, and how much funding should be allocated to education.
  • The state’s information sector is quietly evolving; there will be minimal job growth, but high value added.
  • The growth of the state will be constrained by the lack of workers to complete construction projects.
  • There are three economies in Colorado – Front Range, micropolitan areas such as Durango, and rural Colorado. It is an understatement to say that many rural counties are significantly challenged.
  • Amazing things are happening at DIA and the area surrounding it – Welcome Gaylord!
  • The lack of snow in December and early January has left its mark on the state’s ski areas. It would be worse if they had not invested in snowmaking.

There will be ups and downs, but 2018 will be a good year! It will be steady!

For more details about the Colorado economy check out the  cber.co 2018 Colorado economic forecast on this website.

cber.co Colorado Economic Forecast – Diverse Growth

The primary focus of most state economic forecasts is to project total state employment.

Over the years cber.co has worked on various Colorado economic forecasts – some were multi-year projections, others were one-year annual totals, and some projected sector totals that were added to derive the state total. The latter approach introduced numerous variables for error.

cber.co feels the most accurate forecast is achieved by projecting total employment based on projections for three categories of sectors. Sectors are grouped into three categories based on their past performance.

Projections for the categories and overall employment are based on trends, feedback from business leaders, economic developers, and other economists. The sum of these categories is then used to estimate overall total employment.

Minor adjustments are made and final forecasts are produced for three scenarios. The most likely scenario is used as the final cber.co forecast. This final step helps create a better understanding of upside and downside risk associated with the forecast.

This portfolio approach has made it easy to see that some sectors consistently create jobs at a higher rate of growth, some show solid growth, and others are more volatile. Ultimately, the volatile category tends to have a greater influence on the change in total job growth than the sectors with steady growth.

The most difficult challenge in producing the 2016 forecast was to estimate the 2015 data. The methodology used by BLS to produce the preliminary nonfarm data was flawed. Having said that, the growth of the Strong, Solid, and Volatile Growth Categories will be similar to 2015; however, the total will be slightly less.

The Strong Growth Category of sectors (green) has performed consistently over time. The category added jobs as expected in 2015. Sectors in this category include:
• Professional, Scientific, and Technical Services
• Management of Companies and Enterprises
• Administrative – Business to Business (Not Employment Services)
• Private Education
• Health Care
• Arts, Entertainment, and Recreation
• Other Services.

Recent and projected employment changes for the Strong Growth Category follow:
• 2012 24,000
• 2013 20,100
• 2014 26,900
• 2015 26,700
• 2016 24,000 to 26,000
The 2016 projected rate of growth will be 2.9% to 3.2%, similar to the last two years.

Over time, the Solid Growth Category of sectors (yellow) has been more volatile than the Strong Growth Category and it has grown at a slower pace. In 2015, this category performed as expected. Sectors in this category include:
• Wholesale Trade
• Retail Trade
• State (Not Higher Education)
• Higher Education
• Local (Not K-12 Education)
• K-12 Education
• Accommodations and Food Services

Recent and projected employment changes for the Solid Growth Category follow:
• 2012 15,600
• 2013 26,600
• 2014 24,500
• 2015 24,700
• 2016 23,000 to 25,000
The 2016 projected rate of growth will be 2.3% to 2.5%, similar to the past two years.

Finally, the Volatile Category of sectors (red) was a significant source of growth in 2013 and 2014, but the number of jobs added in 2015 fell off significantly. Sectors in this category include:
• Natural Resources and Mining
• Construction
• Manufacturing
• Transportation, Warehousing, and Utilities
• Employment Services
• Financial Activities
• Information
• Federal Government

Recent and projected employment changes for the Volatile Category follow:
• 2012 15,100
• 2013 22,300
• 2014 30,400
• 2015 21,000
• 2016 20,000 to 22,000.
The 2016 projected rate of growth will be 2.7% to 3.0%, similar to 2015.

The 2016 cber.co Colorado economic forecast portends the state will add 67,000 to 73,000 workers and job growth will be 2.7% to 2.9%.

For additional information about the 2016 cber.co Colorado Economic Forecast click here.

Colorado Economic Forecast

State Agencies Release 2016 Economic Forecasts

On December 21st, the Colorado Legislative Council (CLC) and the Governor’s Office of State Planning and Budgeting (OSPB) released their quarterly 2016 economic forecast . (https://www.colorado.gov/cga-legislativecouncil and https://sites.google.com/a/state.co.us/ospb-live/). The two reports provide slightly different estimates for 2015 and forecasts for 2016, both of which are supported by rational explanations. A comparison of the 2015 estimates for key indicators follows.

2015 Estimates

At the national level, the major difference is that OSPB expects U.S. unemployment to be slightly higher.

At the state level there are several items to make note of:
• Both organizations have indicated stronger than anticipated population growth.
• CLC projected employment to be near the current levels published by the Bureau of Labor Statistics. OSPB projected employment to be near the estimated benchmark revisions that will be made in March.
• Inflations in Colorado is much higher than the U.S. OSPB’s projection for employment is slightly higher than the CLC projection.
• OSPB is more optimistic than CLC about the number of construction permits issued in 2015.

U.S. Economy December 2015 Estimate for 2015
Category CLC OSPB
Real GDP % Change 2.5% 2.4%
Employment   Change % 2.9 million

2.1%

2.8 million

2.0%

Unemployment Rate 5.0% 5.3%
Inflation (CPI) 0.1% 0.1%
Colorado Economy December 2015 Estimate for 2015
Category CLC OSPB
Population Change /% +101,200

1.9%

+98,000

1.8%

Employment Change/% +57,600

2.3%

+69,000

2.8%

Unemployment Rate 4.0% 4.1%
Retail Trade Sales (Millions)/% $93,191

2.8%

$94,200

4.3%

Home Permits (000s) 28.6 31.0
Denver-Boulder Inflation Rate 1.1% 1.5%

2016 Forecasts

At the national level, the two groups have similar forecasts. OSPB forecasted slightly higher U.S. inflation than CLC.

At the state level there are several items to make note of:
• Both groups are projecting population growth similar to 2015.
• Both groups are forecasting continued job growth; however, it will be at a slower level. There are drastic differences in the projected employment levels.
• OSPB is much more optimistic that CLC about construction growth.
• Inflation will be about one percentage point greater than the U.S. level.

December 2015 U.S. – 2016 Economic Forecast 
Category CLC OSPB
Real GDP % Change 2.3% 2.3%
Employment Change/% 2.6 million

1.8%

2.4 million

1.7%

Unemployment Rate 4.8% 4.8%
Inflation (CPI) 1.6% 1.8%
December 2015 Colorado – 2016 Economic Forecast
Category CLC OSPB
Population Change /% +95,200

1.7%

+97,300

1.8%

Employment Change/% +47,300

1.9%

+66,800

2.6%

Unemployment Rate 3.8% 3.8%
Retail Trade Sales (Millions)/% $98,037

5.2%

$99,400

5.5%

Home Permits (000s) 32.0 37.9
Denver-Boulder Inflation Rate 2.4% 2.5%

The bottom line is that the state is expected to show continued job growth. The question is whether or not it will be at a level that is weak to average or will be average to modest growth.

2015 cber.co Forecast – Fine Tuning Solid Growth Category

In preparing its annual forecast, cber.co divides the NAICS sectors into three categories. This portfolio approach makes it easy to see that some sectors consistently create jobs at a higher rate of growth, some show solid growth, and others are more volatile. Ultimately, the volatile category tends to have a greater influence on the magnitude of change in total job growth than the sectors with steady growth.
In March 2015 BLS released its benchmark revision of the 2014 data. The changes were more significant than usual.

As a result cber.co fine-tuned the 2015 employment forecast to have a better understanding of categories and sectors that were driving the economy. This brief discussion highlights the revisions to the 2015 cber.co forecast. This post will evaluate the Solid Growth Category.

The Solid Growth Category

Over the past two decades the following sectors generally posted gains. The category posted stronger jobs gains during the 1990s than the 2000s.
• Wholesale Trade
• Retail Trade
• State (Not Higher Education)
• Higher Education
• Local (Not K-12 Education)
• K-12 Education
• Accommodations and Food Services

Total employment for this category was:
1994  685,400 workers, 39.0% of total employment
2004  848,000 workers, 38.9% of total employment
2014  961,100 workers, 39.0% of total employment.

2015 cber.co forecast

Estimated Job Growth

As can be seen below there is a significant difference between the original estimates for 2014 (January 11) and Benchmark revisions for 2014 (March 27).

The original Solid Growth Category estimates/forecast (January 11 Forecast) was + 20,000 to 24,000 Employees.

• 27,600 jobs added in 2013
• 25,200 jobs added in 2014
• 964,000 employees in 2014
• In 2015, between 22,000 and 28,000 workers will be added at a rate of 2.6% to 2.8%. The rate of growth is similar to 2014.

The updated Solid Growth Category estimates/ forecasts, after benchmark revisions (March 27 Forecast) was+ 22,500 to 26,500 Employees.

• 26,700 jobs added in 2013
• 23,300 jobs added in 2014
• 961,100 employees in 2014
• In 2015, between 22,500 and 26,500 workers will be added at a rate of 2.3% to 2.8%

BLS overestimated the growth of jobs in the Solid Growth Category.
As a result changes were made to the 2015 category and total employment projections.

In 2015, the rate of growth will be 2.3% to 2.8%. This rate of growth is similar to 2014 and most years during the 1990s.

The recalibration of the 2015 forecast resulted in the following changes:
• The Strong Growth Category was revised upward by 4,500.
• The Solid Growth Category was revised downward by 1,500.
• The Volatile Category remained unchanged.
• The net change to the 2015 forecast was an upward revision of 3,000; however, the 2015 forecast is for total growth slightly below the 2014 total.

The change in the mix of jobs being added is equally as important as the change in the number of jobs being added.

For further information on the cber.co forecasts click here.

2015 cber.co forecast

2015 cber.co Forecast – Fine Tuning Strong Growth Category

In preparing its annual forecast, cber.co divides the NAICS sectors into three categories. This portfolio approach makes it easy to see that some sectors consistently create jobs at a higher rate of growth, some show solid growth, and others are more volatile. Ultimately, the volatile category tends to have a greater influence on the magnitude of change in total job growth than the sectors with steady growth.

In March 2015 BLS released its benchmark revision of the 2014 data. The changes were more significant than usual.

As a result cber.co fine-tuned the 2015 employment forecast to have a better understanding of categories and sectors that were driving the economy.  This brief discussion highlights the revisions to the 2015 cber.co forecast. This post will evaluate the Strong Growth Category.

solid growth

The Solid Growth Category

Over the past two decades the following NAICS sectors have been the foundation for consistent growth in Colorado employment.
• Professional, Scientific, and Technical Services
• Management of Companies and Enterprises
• Administrative – Business to Business (Not Employment Services)
• Private Education
• Health Care
• Arts, Entertainment, and Recreation
• Other Services.

Total employment for this category was:
1994 445,200 workers, 25.4% of total employment
2004 615,900 workers, 28.3% of total employment
2014 786,700 workers, 32.0% of total employment

Estimated Job Growth

As can be seen below there is a significant difference between the original estimates for 2014 (January 11)  and Benchmark revisions for 2014 (March 27).

The original Strong Growth Category estimates/forecast  (January 11 Forecast) was  + 20,000 to 24,000 Employees.
• 20,300 jobs added in 2013
• 20,900 jobs added in 2014
• 782,500 employees in 2014
• In 2015, between 20,000 and 24,000 workers will be added at a rate of 2.8% to 3.0%.

The updated Strong Growth Category estimates/ forecasts, after benchmark revisions (March 27 Forecast) was + 24,500 to 28,500 Employees.
• 20,000 jobs added in 2013
• 25,600 jobs added in 2014
• 786,700 employees in 2014
• In 2015, between 24,500 and 28,500 workers will be added at a rate of 3.1% to 3.6%.

BLS significantly underestimated the magnitude of growth in total employment as well as the increase in the number of jobs in the Strong Growth Category. As a result changes were made to the 2015 category and total employment.

In 2015, between 24,500 and 28,500 workers will be added. The rate of growth will be 3.1% to 3.6%. This rate of growth is slightly greater than 2014. Absolute job growth of this category will be similar to job growth in 2007 and 2014.

Total employment for the state will increase by 73,000 to 79,000.

The recalibration of the 2015 forecast resulted in the following changes:

• The Strong Growth Category was revised upward by 4,500.
• The Solid Growth Category was revised downward by 1,500.
• The Volatile Category remained unchanged.
• The net change to the 2015 forecast was an upward revision of 3,000; however, the 2015 forecast is for total growth slightly below the 2014 total.

The change in the mix of jobs being added is equally as important as the change in the number of jobs being added. For further information on the cber.co forecasts click here.

summary of employment growth by category

cber.co 2015 Colorado Economic Forecast by Category

The primary focus of most state economic forecasts is to project total state employment.

Some economists also produce sector forecasts. They usually add projections for the sectors to derive the state total, an approach that introduces numerous variables for error.

cber.co feels the most accurate forecast is achieved by projecting total employment based on projections for categories of sectors. Sectors are grouped into three categories based on their past performance.

Projections for the categories and overall employment are based on trends, feedback from business leaders, economic developers, and other economists. The sum of these categories is then compared to the projections for overall total employment.

Minor adjustments are made and the final forecast is produced for three scenarios. The most likely scenario is used as the final cber.co forecast. This final step helps create a better understanding of upside and downside risk associated with the forecast.

This portfolio approach has made it easy to see that some sectors consistently create jobs at a higher rate of growth, some show solid growth, and others are more volatile. Ultimately, the volatile category tends to have a greater influence on the amount of change in total job growth than the sectors with steady growth.

In 2015, the growth of the Strong, Solid, and Volatile Growth Categories will be similar to 2014.

The Strong Growth Category of sectors (green) has performed consistently over time. The category added jobs as expected in 2014. The larger sectors (Health Care, PST, and B-to-B, excluding Temp. Services) grew at a rate faster than the state. Arts, Entertainment, and Recreation, a smaller sector, grew faster than the state.

Recent and projected employment changes for the Strong Growth Category follow:
• 2012 24,000
• 2013 20,000
• 2014 20,900
• 2015 20,000 to 24,000

Over time, the Solid Growth Category of sectors (yellow) has been more volatile than the Strong Growth Category. In 2014, this category performed stronger than anticipated. AFS and K-12 Education expanded at a faster rate than the state.

Recent and projected employment changes for the Solid Growth Category follow:
• 2012 15,600
• 2013 27,600
• 2014 25,200
• 2015 24,000 to 28,000

Finally, the Volatile Category of sectors (red) was a significant source of growth in 2013 and 2014. In 2014 the Construction, Employment Services, Transportation and Warehousing, and the Extractive Industry sectors expanded at a faster rate than the overall state average.

Recent and projected employment changes for the Volatile Category follow:
• 2012 15,100
• 2013 19,800
• 2014 25,600
• 2015 23,000 to 27,000.

In 2015, overall state employment will increase by 2.8% to 3.0% or 70,000 to 76,000 jobs. Average Colorado employment will be 2,525,600 for 2015.

For additional information about the 2015 cber.co Colorado Economic Forecast click here.

Colorado Economic Forecast

Leeds Economic Forecast Points to Slower Growth in Year Ahead – AGAIN

On December 8th Professor Richard Wobbekind and the Leeds School of Business (SOB) released the 49th annual economic forecast for Colorado. Unfortunately, the fundamentals of the 2014 outlook were as questionable as the 2012 and 2013 forecasts.

For three consecutive years (2012 to 2014) the SOB has projected fewer jobs would be added in the coming year, even though Real GDP was predicted to increase significantly in two of those three years.

A summary of the SOB forecasts from 2012 to 2014 are provided in the table below.


Leeds School of Business Forecast – US Real GDP and Colorado Employment

Year

Change in Real GDP

Change in State Employment


2012

In 2012 Real GDP will show a significant increase in the rate of growth for 2011

Fewer jobs will be added in the coming year


2013

In 2013 Real GDP will growth at about the same rate as 2012, a slight decrease is possible

Fewer jobs will be added in the coming year


2014

In 2014 Real GDP will increase at a rate almost double the 2013 rate

Fewer jobs will be added in the coming year


Source:  SOB BEOF publications


The actual data for 2012 and preliminary data for 2013 are provided in the table below.


Performance of the Economy – US Real GDP and Colorado Employment

Year

Change in Real GDP

Change in State Employment


2012

The rate of growth of 2012 was significantly greater than the rate of growth for 2011

More jobs were added in 2012 than 2011


2013

The 2013 preliminary rate of growth was significantly lower than the rate of growth for 2012.

More jobs were added in 2013 than 2012


2014

To be determined

To be determined


Source: BLS, BEA, CBER


A historical look at the recoveries from the last three recessions is instructive.

After the 1991 recession, Colorado added jobs at an increasing rate for three years (1992 to 1994). This recovery was exceptionally strong. Job growth in 1994 was second highest in state history.

  •  Following the 2001 recession, Colorado “added” jobs at an increasing rate for four years (2003 to 2006). That rate of recovery for that period was anemic, but improving. Continued job growth at an increasing rate was cut short by the 2007 recession.
  •  After the 2007 recession, Colorado has “added” jobs at an increasing rate for four years (2010 to current). The rate of recovery has been so-so. In other words, there is a strong likelihood that job growth will continue at an increasing rate in 2014.

The saying “Every blind squirrel finds an acorn now and then” can be applied to the 2012-2014 SOB forecasts. If they continue to predict the state will add fewer jobs next year than this year, at some point they will be correct. Will 2014 finally be the year they are right?

We can only hope the SOB is wrong again!


©Copyright 2011 by CBER.