The primary focus of most state economic forecasts is to project total state employment.
Some economists also produce sector forecasts. They usually add projections for the sectors to derive the state total, an approach that introduces numerous variables for error.
cber.co feels the most accurate forecast is achieved by projecting total employment based on projections for categories of sectors. Sectors are grouped into three categories based on their past performance.
Projections for the categories and overall employment are based on trends, feedback from business leaders, economic developers, and other economists. The sum of these categories is then compared to the projections for overall total employment.
Minor adjustments are made and the final forecast is produced for three scenarios. The most likely scenario is used as the final cber.co forecast. This final step helps create a better understanding of upside and downside risk associated with the forecast.
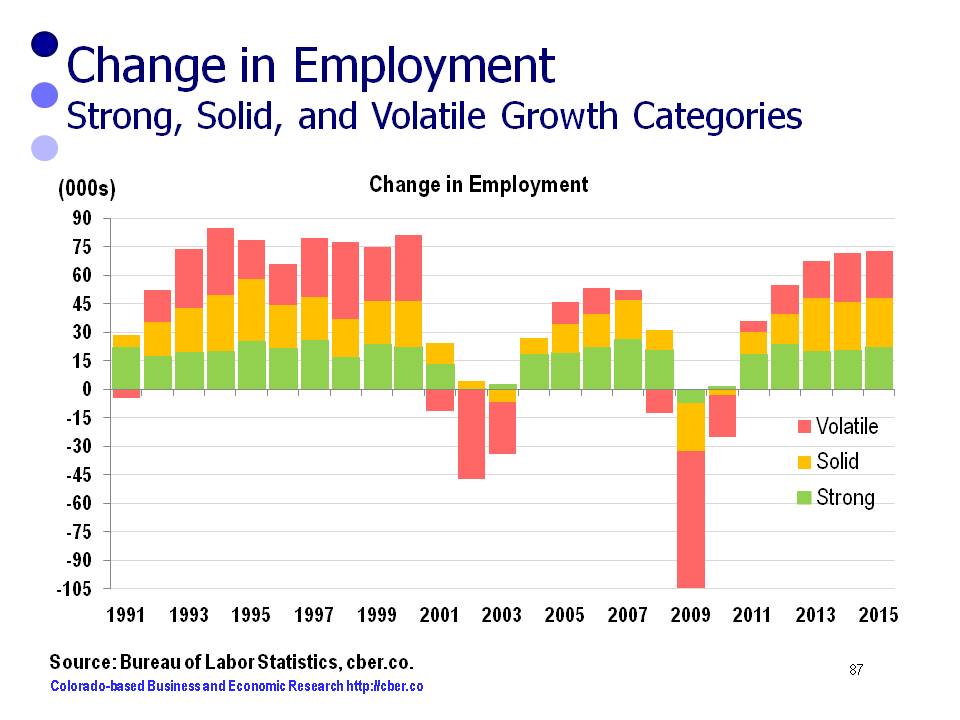
This portfolio approach has made it easy to see that some sectors consistently create jobs at a higher rate of growth, some show solid growth, and others are more volatile. Ultimately, the volatile category tends to have a greater influence on the amount of change in total job growth than the sectors with steady growth.
In 2015, the growth of the Strong, Solid, and Volatile Growth Categories will be similar to 2014.
The Strong Growth Category of sectors (green) has performed consistently over time. The category added jobs as expected in 2014. The larger sectors (Health Care, PST, and B-to-B, excluding Temp. Services) grew at a rate faster than the state. Arts, Entertainment, and Recreation, a smaller sector, grew faster than the state.
Recent and projected employment changes for the Strong Growth Category follow:
• 2012 24,000
• 2013 20,000
• 2014 20,900
• 2015 20,000 to 24,000
Over time, the Solid Growth Category of sectors (yellow) has been more volatile than the Strong Growth Category. In 2014, this category performed stronger than anticipated. AFS and K-12 Education expanded at a faster rate than the state.
Recent and projected employment changes for the Solid Growth Category follow:
• 2012 15,600
• 2013 27,600
• 2014 25,200
• 2015 24,000 to 28,000
Finally, the Volatile Category of sectors (red) was a significant source of growth in 2013 and 2014. In 2014 the Construction, Employment Services, Transportation and Warehousing, and the Extractive Industry sectors expanded at a faster rate than the overall state average.
Recent and projected employment changes for the Volatile Category follow:
• 2012 15,100
• 2013 19,800
• 2014 25,600
• 2015 23,000 to 27,000.
In 2015, overall state employment will increase by 2.8% to 3.0% or 70,000 to 76,000 jobs. Average Colorado employment will be 2,525,600 for 2015.
For additional information about the 2015 cber.co Colorado Economic Forecast click here.
