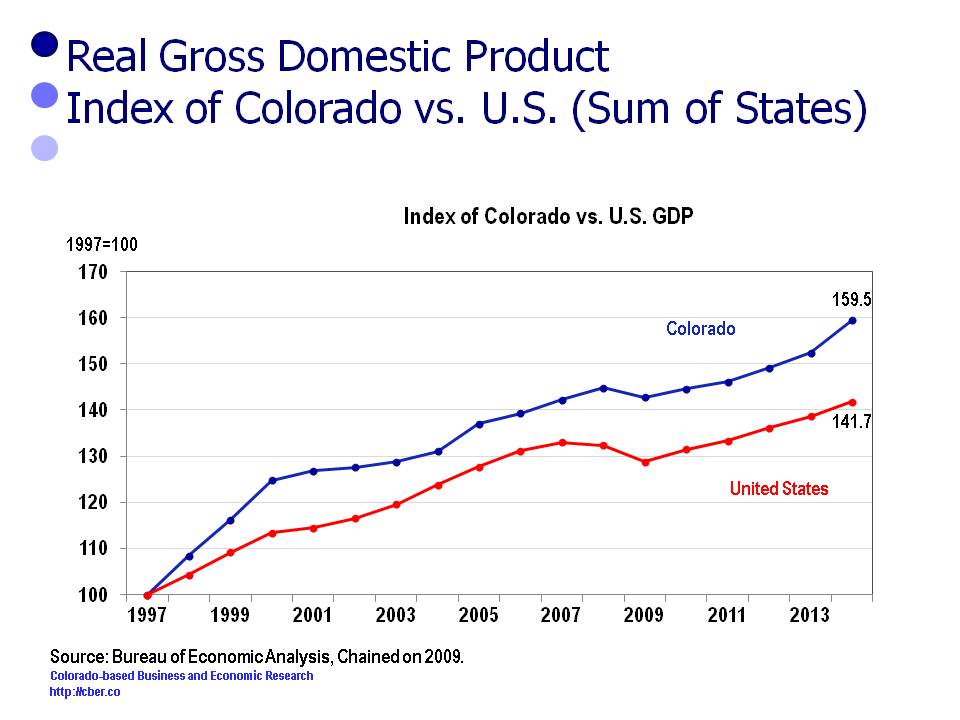
Colorado Job Growth Holds Steady

In early March the Bureau of Labor Statistics released revised employment data for Colorado showing that 2014 was the 3rd strongest year of job growth in the state’s history and 2015 was ranked 9th.

Data released near the end of March shows that average year-over-year Colorado job growth for the past seven months has been about 67,000 jobs greater than the previous 12-month period. The reduced rate of expansion has occurred for the following reasons:
• The slowdown in the Chinese economy has caused many countries to experience lower rates of GDP growth.
• Colorado’s extractive industries are continuing to contract.
• Just as the Broncos can’t win the Super Bowl every year, it is not possible to have “Super-Bowl-like” job growth all the time.

Although the rate of growth for employment and the GDP are less than last year, the economy will still experience solid growth for the following reasons:
• There is solid GDP growth across most Colorado sectors.
• Job growth is stable in most industries and occupations.
• Solid and diverse growth will continue in the state’s personal income, population, and per capita personal income.
• There is a strong outlook for the construction industry in Colorado and the U.S.
• Robust new car sales are a reflection of solid personal consumption.
• There is increased activity at DIA and the area surrounding the airport.
• While low unemployment can be problematic it will drive higher wages.
• Higher wages will cause increased consumption and offset higher living costs.

Despite the headwinds, Colorado is on track for continued solid growth in 2016. For more details check out the most recent updates by clicking here or check out cber.co Colorado Economic 2016 Forecast.

Colorado Job Growth

Colorado Real GDP Currently Stronger than U.S.

On December 10th, the Bureau of Economic Analysis (BEA) released quarterly GDP data for Colorado (2005 to Q2 2015). The Q2 year-over-year Real GDP for Colorado increased by 4.8% compared to 2.7% for the U.S.

The following trends are evident in the comparison of the year-over-year GDP data for Colorado and the U.S:
• The correlation coefficient between these two variables is .69
• The U.S. was stronger during the period Q1 2006 through Q1 2007.
• Colorado outperformed the U.S. significantly between Q2 2007 and Q4 2009 (This was during the recession).
• The U.S. was stronger coming out of the recession for most of 2010 – from Q1 2010 to Q3 2010.
• For the next two years, from Q4 2010 to Q3 2012 the rates of growth for Colorado and the U.S. were similar.
• From Q4 2012 to the present, the Colorado GDP expanded at a faster rate than the U.S. GDP. Beginning in Q1 2014 the gap between the two rates became greater as a result of the strength of the oil and gas industry in Colorado.
• That gap has since narrowed in 2015 as the price of oil has declined and oil and gas production has fallen off.

Colorado Real GDP


The following trends are evident in the comparison of the year-over-year GDP data for Colorado and the Colorado wage and salary employment:
• The correlation coefficient between these two variables is .72
• Employment grew at a higher rate from Q1 2006 to Q2 2007 than the Real GDP.
• Generally, the Real GDP grew at a greater rate from Q3 2007 to Q2 2011 than employment growth.
• From Q3 2011 to Q1 2014 the rate of growth for employment was generally greater than the Real GDP growth.
• From Q2 2014 to present the Real GDP grew at a greater rate than employment. This was in part largely because of the increase in oil and gas production in Colorado during this period.
• As the price for a barrel has dropped and oil and gas production has fallen off the gap between the two rates has declined. This caused a much greater decline in the growth rate for GDP than employment.

Colorado Real GDP

As can be seen the growth of the Colorado Real GDP and the U.S. Real GDP are closely related. As well, there is a strong relationship between the rate of growth for state Real GDP and employment.

Colorado Economy On Track to Add At Least 68,600 Jobs in 2015

At the midpoint of the year the U.S. economy is on solid footing and the second half of the year will be much stronger than the first half. The Colorado economy continues to outperform the U.S. in its rate of growth for population, employment, and GDP.

Key Data Points for the U.S.
Real GDP – Q2 will be stronger. Annual growth will be 2.5% to 2.9% in 2015.
Retail Sales – Up 1.3% for 6 months, projected to be up 3.0% for 2015.
U.S. Employment – The U.S. is on track to add 3.1 million jobs this year.
Unemployment Rate – 5.3%, down from 6.1% a year ago, 8.3 million unemployed, trending down.
ISM Indices –Manufacturing is sluggish and expected to remain that way; Non-Manufacturing is steady and well above 50.
Price of a Barrel of Oil (WTI) – Since mid-March it has varied from $43 to $61. Currently in the low 50s, but trending down.
Construction – For 6 months, employment up 4.2%, weekly earnings up 3.0%.
Case Shiller Housing Prices – U.S. prices up 4.2% from a year ago.
Dow Jones Industrial Average – On July 17rd the DJIA was 18,086, up 1.5% from 17,823 at the end of the year.

Average Colorado employment is 68,600 greater than the same period last year, with the potential of being revised upward at a later date.

Colorado Economy

As has been the case in the past, the sectors with the top job growth are: Health Care; Accommodations and Food Services (part of the Tourism Industry); Construction; Professional, Scientific, and Technical Services; and Manufacturing. These sectors accounted for about 72% of total job growth in the first half of 2015.

The Bureau of Economic Analysis has released the 2014 Gross Domestic Product for Colorado. The state’s Real GDP expanded at a rate of 4.7% compared to 2.2% for the U.S.

Key Data Points for Colorado
QCEW Revisions – Recent revisions to Q4 2014 could cause 2014 employment to be revised upward in the March 2016 benchmark revisions. There was stronger momentum coming into 2015 than originally anticipated.
Population – Colorado’s population will increase by 88,800 people this year.
Unemployment Rate – 4.4%, down from 5.0% a year ago.
MSA Unemployment Rate – Boulder and Ft. Collins have the lowest rates at 3.5% and 3.6% respectively.
2014 Colorado GDP – The state Real GDP grew by 4.7% in 2014 compared to 2.2% for the U.S.
2014 Contribution to GDP Growth – The Mining sector accounted for 6.2% of GDP and 18.2% of GDP growth in 2014.
Wage and Salary Employment – On average Colorado has added 68,600 jobs this year based on current data. This is not adjusted for the projected revisions.
Leading Sectors for Growth – About 72.2% of the jobs have been added in the Health Care; Construction; Accommodations and Food Services; Professional, Scientific, and Technical Services; and Manufacturing.

For details or more information about the Colorado economy, check out the 2015 cber.co forecast and economic updates on this website, https://cber.co.

Advanced Technology Cluster Contributes 17.8% to GDP Growth

In early June the Bureau of Economic Analysis released Gross Domestic Product at the state level for two-digit NAICS Codes.

Since 1997 Colorado Real GDP has grown at a faster rate than the Real GDP for the U.S. (Sum of States) in 11 of 17 years. The 2014 U.S. rate of growth was 2.2% compared to 4.7% for Colorado.

Since 1997 Colorado Real GDP has grown at a faster rate than the U.S. (Sum of States), 2.8% vs. 2.1%.

There were 12 sectors that lost share in 2014, i.e. their percent of contribution for these sectors was less than their percent of the 2014 total. Collectively, they accounted for 72.9% of the 2014 GDP and 53.5% of the change in the GDP. It was disappointing that the proxy for Colorado’s advanced technology cluster only contributed 17.8% to state’s GDP.

The following table shows the sectors, their percentage of the 2014 GDP and their contribution to the GDP.

Sector % of 2014 Total % of 2014 Contribution
Educational services 0.7% 0.6%
Agriculture, forestry, fishing, and hunting 1.1% 0.3%
Other services, except government 2.3% 1.8%
Administrative and waste management services 3.0% 2.9%
Retail trade 5.4% 3.9%
Finance and insurance 5.6% 3.1%
Health care and social assistance 6.0% 5.8%
Manufacturing 7.1% 6.8%
Information 7.2% 2.9%
Professional, scientific, and technical services 8.9% 8.1%
Government 12.1% 4.8%
Real estate and rental and leasing 13.5% 12.4%

There are concerns regarding the level of contribution for the five sectors that have the greatest share of the state’s GDP. The top sectors are:
• Real Estate 13.5%
• Government 12.1%
• Professional, scientific, and technical services, 8.9%
• Information 7.2%
• Manufacturing 7.1%
These five sectors accounted for 48.8% of the 2014 GDP; however they only contributed 35.0% of the 2014 GDP growth.

Of specific concern is the fact that PST, Information, and Manufacturing accounted for 23.2% of the state’s 2014 GDP, yet these 3 sectors only contributed 17.8% of the growth of the GDP. These three sectors are a proxy for the state’s advanced technology cluster, a cluster that is supposed to provide the state with a competitive advantage.

Despite these concerns, the level of Real GDP Growth in 2014 provided significant momentum for the Colorado economy moving into 2015.

GDP losing share - Advanced Technology Cluster

2014 Colorado Real GDP Growth More than Twice the Rate for U.S.

In early June the Bureau of Economic Analysis released Gross Domestic Product at the state level for two-digit NAICS Codes.

Since 1997 Colorado Real GDP has grown at a faster rate than the Real GDP for the U.S. (Sum of States) in 11 of 17 years.

gdp index

Since 1997 Colorado Real GDP has grown at a faster rate than the U.S. (Sum of States), 2.8% vs. 2.1%. The 2014 U.S. rate of growth was 2.2% compared to 4.7% for Colorado.

gdp index

There were 8 sectors that gained share in 2014, i.e., their percent of contribution to GDP was greater than their percent of the 2014 total GDP. Collectively, they accounted for 27.1% of the 2014 GDP and 46.5% of the change in the GDP. These sectors were:
• Arts, entertainment, and recreation
• Utilities
• Management of companies and enterprises
• Transportation and warehousing
• Accommodation and food services
• Construction
• Wholesale trade
• Mining

There were 12 sectors that lost share in 2014, i.e. their percent of contribution for these sectors was less than their percent of the 2014 total. Collectively, they accounted for 72.9% of the 2014 GDP and 53.5% of the change in the GDP. These sectors were:
• Educational services
• Agriculture, forestry, fishing, and hunting
• Other services, except government
• Administrative and waste management services
• Retail trade
• Finance and insurance
• Health care and social assistance
• Manufacturing
• Information
• Professional, scientific, and technical services
• Government
• Real estate and rental and leasing

The level of Real GDP Growth in 2014 provided significant momentum for the Colorado economy moving into 2015.

Mining and Real Estate – Drivers of the Colorado Economy

Thank goodness for the  mining and real estate industries! From an output perspective these industries are the primary drivers of the Colorado economy.

In 2013, Colorado’s nominal GDP was $294.4 billion (most current data available). The state’s economy expanded by $157.1 billion between 1997 and 2013 (1997 is the first year that data was available). Between 2009 and 2013 the GDP expanded by $46.3 billion.

The Great Recession had a major impact on the way the economy expanded. This is evident when comparing the contribution to output for the periods 1997 to 2013 and 2009 to 2013.

Between 1997 and 2013 the contribution to GDP was broken down as follows:
• Goods Producing 20.5%
• Service Producing 68.6%
• Private sector (Goods + Services) 89.0%
• Government 11.0%

Between 1997 and 2013 the annualized rate of growth for the GDP follows:
• Total 4.9%
• Private 5.0%
• Government 4.1%

Between 2009 and 2013 the contribution to GDP was broken down as follows:
• Goods Producing 28.0%
• Service Producing 65.5%
• Private sector (Goods + Service) 93.6%
• Government 6.4%

Between 2009 and 2013 the annualized rate of growth for the GDP follows:
• Total 4.4%
• Private 4.7%
• Government 2.2%

Thank goodness for the Goods Producing Sectors (Agriculture, Mining, Construction, and Manufacturing)!

Industry 2013 GDP (millions) 2013 minus 1997 % of Total 2013 minus 2009 % of Total
All industry total $294,443 $157,072 $46,266
Private industries $258,217 $139,860 89.0% $43,287 93.6%
Goods Producing $57,447 $32,144 20.5% $12,964 28.0%
Service Producing $200,771 $107,718 68.6% $30,325 65.5%
Government $36,226 $17,212 11.0% $2,979 6.4%

The following two tables provide more detail by industry.

The following table shows more detail by industry sector. It is sorted in descending order by the column 2013 minus 1997.

Industry 2013 GDP (millions) 2013 minus 1997 % of Total 2013 minus 2009 % of Total
Real estate and rental and leasing $40,194 $21,355 13.6% $6,895 14.9%
Mining $19,848 $17,964 11.4% $8,518 18.4%
Government $36,226 $17,212 11.0% $2,979 6.4%
Professional, scientific, and technical services $26,355 $16,084 10.2% $4,233 9.1%
Information $21,578 $12,019 7.7% $1,407 3.0%
Health care and social assistance $17,438 $10,503 6.7% $2,262 4.9%
Wholesale trade $15,915 $7,818 5.0% $2,606 5.6%
Retail trade $16,105 $6,926 4.4% $1,965 4.2%
Manufacturing $21,600 $6,657 4.2% $2,171 4.7%
Finance and insurance $14,480 $6,067 3.9% $2,436 5.3%
Accommodation and food services $9,409 $5,255 3.3% $1,769 3.8%
Management of companies and enterprises $6,207 $5,106 3.3% $1,550 3.4%
Construction $11,820 $4,861 3.1% $208 0.4%
Administrative and waste management $8,653 $4,308 2.7% $1,090 2.4%
Transportation and warehousing $7,984 $4,094 2.6% $1,598 3.5%
Other services $6,549 $2,784 1.8% $605 1.3%
Agriculture, forestry, fishing, and hunting $4,179 $2,662 1.7% $2,067 4.5%
Arts, entertainment, and recreation $3,848 $2,029 1.3% $890 1.9%
Utilities $3,798 $1,782 1.1% $646 1.4%
Educational services $2,258 $1,588 1.0% $373 0.8%

The following table shows more detail by industry sector. It is sorted in descending order by the column 2013 minus 2009.

Industry 2013 GDP (millions) 2013 minus 1997 % of Total 2013 minus 2009 % of Total
Mining $19,848 $17,964 11.4% $8,518 18.4%
Real estate and rental and leasing $40,194 $21,355 13.6% $6,895 14.9%
Professional, scientific, and technical services $26,355 $16,084 10.2% $4,233 9.1%
Government $36,226 $17,212 11.0% $2,979 6.4%
Wholesale trade $15,915 $7,818 5.0% $2,606 5.6%
Finance and insurance $14,480 $6,067 3.9% $2,436 5.3%
Health care and social assistance $17,438 $10,503 6.7% $2,262 4.9%
Manufacturing $21,600 $6,657 4.2% $2,171 4.7%
Agriculture, forestry, fishing, and hunting $4,179 $2,662 1.7% $2,067 4.5%
Retail trade $16,105 $6,926 4.4% $1,965 4.2%
Accommodation and food services $9,409 $5,255 3.3% $1,769 3.8%
Transportation and warehousing $7,984 $4,094 2.6% $1,598 3.5%
Management of companies and enterprises $6,207 $5,106 3.3% $1,550 3.4%
Information $21,578 $12,019 7.7% $1,407 3.0%
Administrative and waste management $8,653 $4,308 2.7% $1,090 2.4%
Arts, entertainment, and recreation $3,848 $2,029 1.3% $890 1.9%
Utilities $3,798 $1,782 1.1% $646 1.4%
Other services $6,549 $2,784 1.8% $605 1.3%
Educational services $2,258 $1,588 1.0% $373 0.8%
Construction $11,820 $4,861 3.1% $208 0.4%


U.S. and Colorado Economy Remain Solid

National Economy
The U.S. economy remains strong, with solid employment and output growth.

• Nationally, employment remains strong, despite slower than expected job growth in August. The non-seasonally adjusted data shows that an average of 215,000 jobs has been added each month through eight months. This means the U.S. will add about 2.5 million jobs this year.
• Output remains solid. The first Q2 estimate showed real GDP growth of 4.0%. That was revised upwards to 4.2%. It is possible the third estimate, due later this month, could be revised even higher to 5.0%.
• At the most recent FOMC meeting the Federal Reserve provided no surprises. Their stance on the economy indicates:
o The rate of inflation remains below target.
o Quantitative easing will come to an end.
o There is slack in the labor market.
o Interest rates will remain low in the near term; however, once rate increases begin they will accelerate faster than previously anticipated. It is likely rates will begin increasing in mid-2015.
• The outlook for construction is positive.  Single family building permits have been flat; however the NAHB index shows that homebuilder sentiment is much stronger than the permits data. This suggests greater activity, and stronger data, will occur in the future.
• The unemployment rate, number of unemployed, and the number of Americans filing new claims for unemployment benefits continue on a downward trend. The economy should remain healthy as long as fewer people are unemployed and an increasing number of Americans are working.

Colorado Economy

The performance of the Colorado economy is closely tied to changes in U.S. job and output growth. Since the end of the recession Colorado job growth has outperformed the U.S. because of its mix of industries. The state is on track to add jobs at an accelerated rate for the fourth consecutive year.  Job growth this year will be about 3.0%.

• The extractive industries have been a major direct and indirect contributor to the job growth. As well, the extractive industries were responsible for about one-third of the state’s GDP growth in 2013. The extractive industries are important to the economies of about half the counties in the state. From a jobs perspective, the sector is small, but the number of workers will increase by at least 9% this year compared to 2013.
• So far this year, between 10% and 12% of the jobs added in Colorado are construction jobs. The number of jobs will increase by at least 6.5% compared to the same period last year. Growth in the sector might be constrained by a lack of trained workers in specialized construction occupations such as plumbers, HVAC workers, and electricians. The home and infrastructure subsectors also include distinct specialized occupations.
• Tourism has enjoyed a banner year in Colorado. It began with good snow and a strong ski season. The good snow season also meant plenty of water for mountain rafting and summer tourism activities. Special events, such as the USA Pro Challenge, and the lack of fires and flooding provided the foundation for a strong summer season. Leisure and hospitality job growth is poised to be at least 4.6% greater in 2014 than last year. The sector will be responsible for adding about 19% of the jobs in the state this year.  The sector plays a significant part of the economy in all 64 counties.
• The healthcare sector will add more than 10,000 workers in 2014 and expand at a rate of more than 4.3%. The sector continues to face challenges finding workers in many occupations and in rural areas.
• The growth of the professional, scientific, and technical sector is important to the state because a portion of these companies are directly or indirectly a part of the state’s advanced technology sector. The lifestyle of Downtown Denver and Colorado is attracting millennials to jobs in these sectors. The growth of in the sector will be at a rate of about 4.5% in 2014. It is important to note that many of these occupations pay higher than average wages and the sector is adding jobs at an increasing rate.


Colorado Economy Remains Strong

National Economy

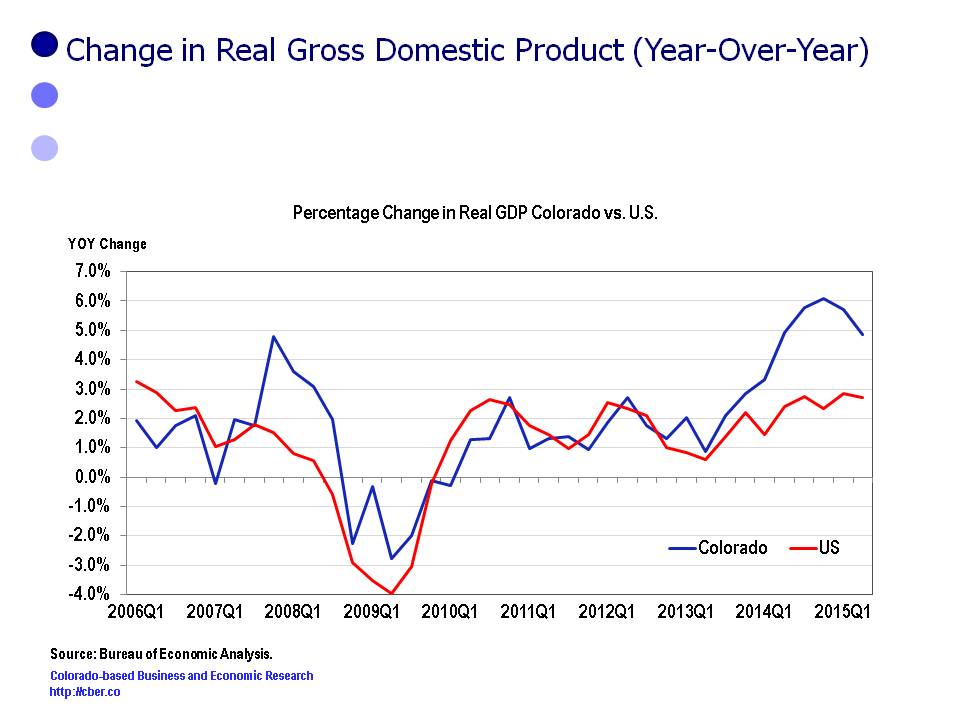
The Colorado economy is outperforming the U.S. economy. Recent strength in the U.S. economy is a positive sign for Colorado.

Nationally, employment remains strong. The non-seasonally adjusted data shows that an average of 230,000 jobs have been added each month through seven months. Most likely the U.S. will add about 2.5 million jobs this year.

On a positive note, the labor force participation rate appears to have bottomed out.

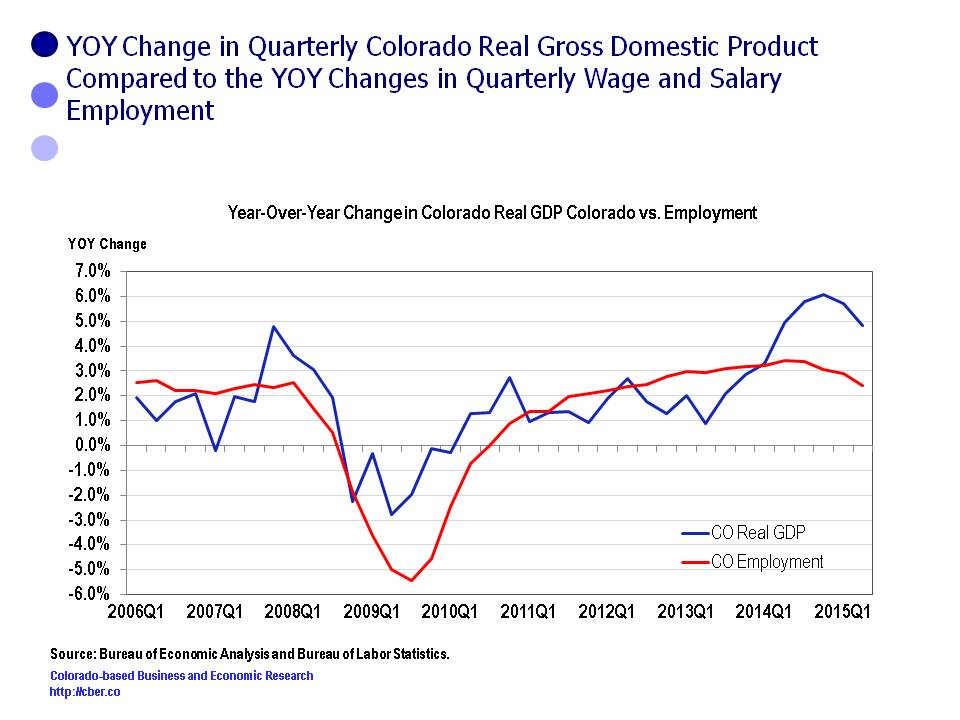
Real GDP increased by 4.0% in Q2. The reasons for the increase in the real GDP were:

  • Stronger personal consumption.
  • Greater private inventory investment.
  • Increased residential fixed investment.
  • Stronger non-residential fixed investment.
  • Improved state and local government spending.
  • Greater demand for exports

Factors that offset the growth were:

  • Increased demand for imports.
  • Decreased federal government spending.

An area of potential concern is construction. Hopefully the industry is taking a breather after its recovery from the Great Recession. The number of building permits issued over the past year has been flat.

In addition, the housing market is cooling off. The rapid appreciation in housing prices is tapering off.

Both manufacturing and services have been solid since the second half of 2009. At least this is being reflected in the growth of the GDP.

Implications of the National Economy on Colorado

These indicators have several implications for Colorado. The short-term outlook points to stronger personal consumption, which bodes well for retailers and tourism, particularly if Mother Nature cooperates by bringing early and frequent snow for the ski season.

Stronger retail sales will add to the coffers of the state and local governments, which should point to continued increases in government spending. This would benefit everything from schools to infrastructure.

On the downside, lower or constrained government spending could impact the military and federal facilities and laboratories. This has the potential to impact the universities and federal facilities in Colorado Springs, Denver, Boulder, and the Northern Colorado metro areas.

The unemployment rate and the number of unemployed continue to trend downward; however, critical labor shortages are developing in many occupations. This is particularly critical to high-tech industries.

Labor shortages are impacting all industries in Northern Colorado which is experiencing rapid growth as a result of the extractive industries boom. Workers are being raided from other companies and industries, which will ultimately drive wages up.

The Colorado construction market still appears to be solid and the value of residential housing is growing, albeit at a slower rate than last year. At the same time the Dow Jones Industrial Average is about where it was at the end of 2013.

Appreciation in the housing and equity markets play into consumer confidence. If consumers feel their house and investments have appreciated, their wealth on paper is greater, and they are more likely to purchases goods and services.
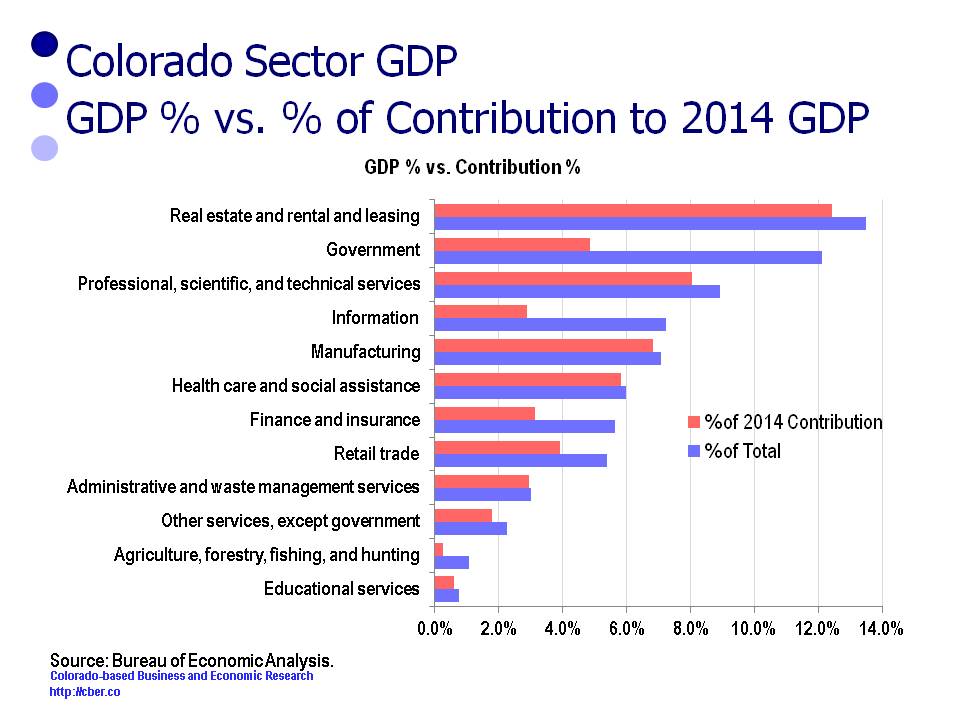
Colorado Economy

The following five sectors account for about 45% of total jobs in the state, yet they are responsible for almost 75% of the jobs added this year.

  • Accommodations and Food Services
  • Health Care
  • Construction
  • Professional and Scientific Services
  • Retail Trade.

All of these jobs are important to the state for various reasons.

  • About 10% of all jobs are in the Accommodations and Food Services sector. AFS has accounted for about 20% of the jobs added this year. As a major component of the tourism sector, AFS is an important part of the economy in all 64 counties.
  • Just under 11% of the state’s s jobs are in the Health Care sector. This category has accounted for about 15% of total jobs added this year. The Health Care sector affects our quality of life and plays a key role in the economy in all 64 counties.
  • The Construction industry is small by comparison, with about 5.0% of total state jobs. Approximately 12% of the job growth is in this category. A segment of the Construction jobs are tied to the growth of the extractive industries.
  • A portion of the Professional, Scientific, and Technical jobs are a key part of the state’s advance technology industries. They account for about 8% of the jobs and 11% of the job growth.
  • Finally, Retail Trade jobs account for almost 11% of total jobs and 11% of total job growth. The retail sector is critical to most local governments because a majority of their revenue is derived from retail sales taxes.

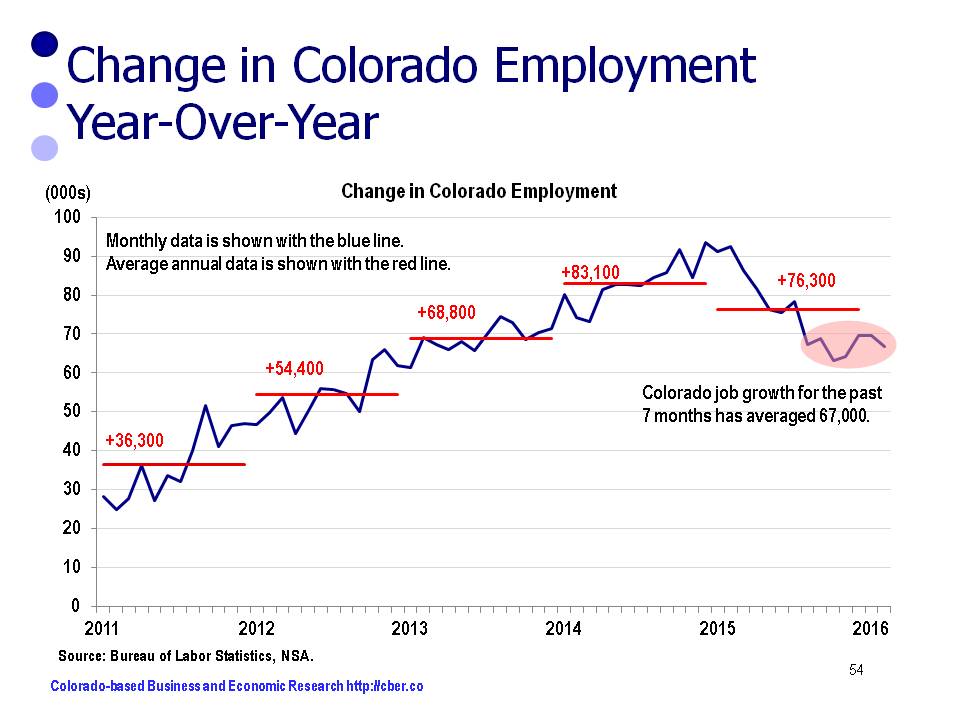
Through seven months of 2014, the average job growth is about 67,300 greater than the same period in 2013.

Colorado’s Manufacturing Output Similar to Arizona, Kansas, and Utah

Manufacturing is important to the Colorado economy because it is a primary job creator – it brings in investment from outside the state, it creates jobs with higher than average wages, and the industry often has a deeper local supply chain than other industries. In 2012, the most current data available, Colorado manufacturing output totaled $19.99 billion and was 8.4% of private sector output (BEA).

Colorado is proud to have manufacturing competencies in some high-tech areas and food and beverage and state economic development officials have focused their support on the select sectors where they have strength or potential strength.

In 2012, Colorado was ranked 29th for total manufacturing output. States with similar levels of output include Arizona, Kansas, Utah, Maryland, and Oklahoma.


State Output (millions) Percent Cumulative Percent
California $213,257 11.4% 11.4%
Texas $210,968 11.3% 22.7%
Illinois $92,383 4.9% 27.7%
North Carolina $88,252 4.7% 32.4%
Ohio $87,174 4.7% 37.1%
Indiana $84,150 4.5% 41.6%
Pennsylvania $70,634 3.8% 45.4%
Michigan $66,230 3.5% 48.9%
New York $63,088 3.4% 52.3%
Oregon $55,158 3.0% 55.2%
Louisiana $55,097 3.0% 58.2%
Wisconsin $49,981 2.7% 60.9%
Georgia $48,599 2.6% 63.5%
Washington $46,507 2.5% 66.0%
Massachusetts $41,629 2.2% 68.2%
Tennessee $41,411 2.2% 70.4%
Minnesota $40,441 2.2% 72.6%
Virginia $40,116 2.1% 74.7%
New Jersey $38,199 2.0% 76.8%
Florida $37,023 2.0% 78.8%
Missouri $32,275 1.7% 80.5%
Alabama $30,001 1.6% 82.1%
Kentucky $29,746 1.6% 83.7%
South Carolina $28,708 1.5% 85.2%
Iowa $25,406 1.4% 86.6%
Connecticut $24,079 1.3% 87.9%
Arizona $21,934 1.2% 89.1%
Kansas $20,503 1.1% 90.2%
Colorado $19,992 1.1% 91.2%
Utah $19,184 1.0% 92.3%
Maryland $18,657 1.0% 93.3%
Oklahoma $17,497 0.9% 94.2%
Arkansas $15,604 0.8% 95.0%
Mississippi $15,254 0.8% 95.8%
Nebraska $12,484 0.7% 96.5%
New Hampshire $7,657 0.4% 96.9%
Idaho $7,556 0.4% 97.3%
West Virginia $6,223 0.3% 97.7%
New Mexico $5,805 0.3% 98.0%
Nevada $5,504 0.3% 98.3%
Maine $5,497 0.3% 98.6%
Delaware $4,393 0.2% 98.8%
South Dakota $4,008 0.2% 99.0%
Rhode Island $3,919 0.2% 99.2%
Vermont $3,150 0.2% 99.4%
North Dakota $3,037 0.2% 99.6%
Montana $2,860 0.2% 99.7%
Wyoming $2,269 0.1% 99.8%
Alaska $1,671 0.1% 99.9%
Hawaii $1,274 0.1% 100.0%
District of Columbia $256 0.0% 100.0%
Total $1,866,700 100.0%

Colorado in Bottom Third of States for Output Manufacturing Location Quotient

Manufacturing is critical to the state of Colorado; however, the state’s manufacturing output lags other states.

One way to evaluate the Bureau of Economic Analysis state output data is to compare the industry specialization index or the location quotient (LQ) to show which states have a higher concentration of manufacturing relative to the other industries. A LQ > 100.0 means there is a higher concentration and a L.0  < 100.0 means there is a lower concentration.

In the first group of states (17 states) the manufacturing sector has a LQ is greater than 118.0. In other words, manufacturing is a significant export industry for these states.

Rank State LQ
1 Indiana 234.98
2 Oregon 231.48
3 Louisiana 188.87
4 North Carolina 161.40
5 Wisconsin 159.35
6 Kentucky 142.99
7 Ohio 142.70
8 Iowa 138.98
9 Michigan 137.90
10 Alabama 136.30
11 South Carolina 135.85
12 Texas 125.90
13 Mississippi 125.33
14 Tennessee 124.65
15 Kansas 123.04
16 Utah 122.60
17 Arkansas 118.77

In the second group of states (15 states) the LQ is greater than 85.0 and less than 115.0. In these states manufacturing is an important industry. Because Minnesota, Illinois, and Idaho have LQs greater than 110.0 it is likely that manufacturing is a significant export industry.

Rank State LQ
18 Minnesota 114.42
19 Illinois 110.81
20 Idaho 108.18
21 Nebraska 104.57
22 Missouri 103.98
23 Washington 103.22
24 New Hampshire 98.69
25 Pennsylvania 98.02
26 Vermont 96.23
27 Georgia 93.47
28 Oklahoma 90.65
29 California 88.76
30 Connecticut 87.56
31 Massachusetts 85.96
32 Maine 85.43

The LQ for the final group of states (18 states + District of Columbia) is less than 85.0. In these states manufacturing may be an important part of the economy and there may be pockets where there are high concentrations of exports. Manufacturing does not drive the fortunes of the state in the same way it does in the states with higher LQs.

Colorado is a perfect example. Manufacturing has a LQ of 60.1 and the industry accounts for 8.4% of private sector output. The state has competencies in food and beverage and computer and other high-tech manufacturing. By contrast, Oregon has substantially fewer manufacturing workers and appreciably greater manufacturing output. (The Portland-Vancouver MSA manufacturing output is $47.3 billion vs. almost $20 billion for the entire state of Colorado). In Oregon manufacturing accounted for 31.3% of total private sector GDP in 2012.

Rank State LQ
33 South Dakota 78.71
34 Virginia 75.03
35 West Virginia 74.79
36 Arizona 68.53
37 Rhode Island 64.13
38 New Jersey 62.70
39 Colorado 60.83
40 New Mexico 60.06
41 Montana 59.00
42 Delaware 55.52
43 North Dakota 55.04
44 Wyoming 49.24
45 Maryland 48.97
46 New York 43.62
47 Florida 39.72
48 Nevada 34.36
49 Alaska 26.87
50 Hawaii 14.67
51 District of Columbia 1.94