Fifty-Four Million Passengers Passed Through DIA in 2015

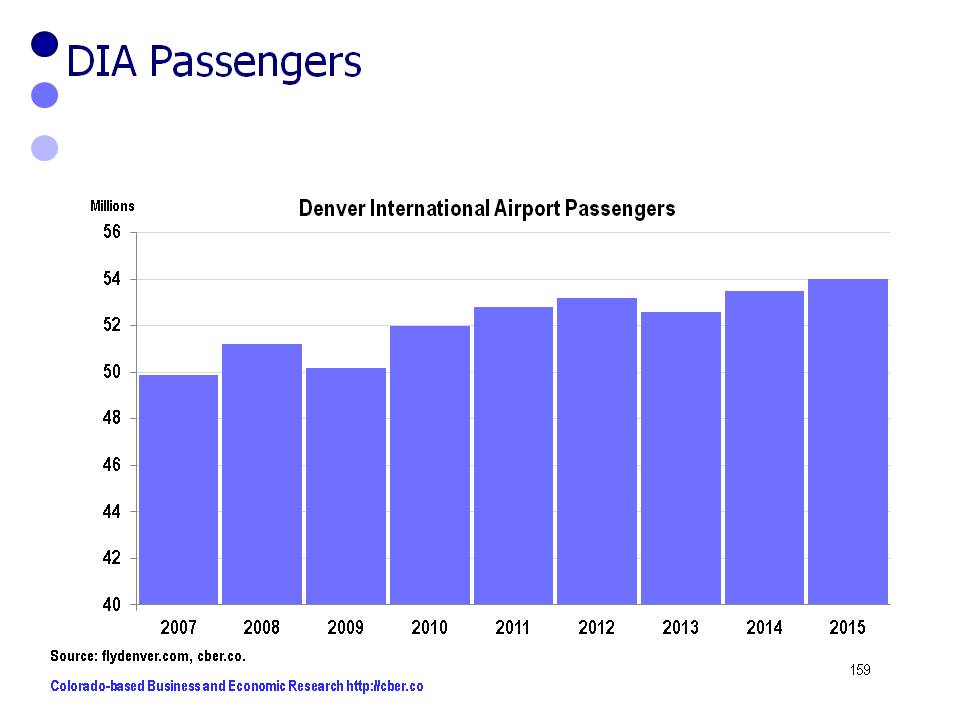
It is official, Denver International Airport celebrated its 20th anniversary with a record setting 54 million passengers in 2015.

To be exact, there were 54,014,502 passengers in 2015 up from 53,472,514 in 2014. This is an increase of 1.0% or 541,988.

The record growth was made possible by solid traffic throughout the year that included a record number of passengers in April and the last four months of the year.

International traffic in 2015 was flat compared to the previous year, 2,292,613 in 2015 vs. 2,208,209 in 2014. A DIA press release indicates that the use of the airport’s custom facility increased by 16%; however, Canadian preclearance flights declined 22%. The Canadian shortfall was attributed to the decreased activity in the oil and gas industry caused by lower prices for a barrel of oil.

DIA Passengers

It was also a good year for cargo. DIA handled 545,784,431 pounds of cargo in 2015 compared to 519,434,240 pounds the prior year. This is an increase of 5.1%.

United continued to be Denver’s airline of choice with 42.3% market share. Southwest was second with 29.8% followed by Frontier with 12.4%.

The airline with animals on the tails of its planes had a disastrous year in 2015. It led the industry in complaints and the number of Frontier passengers in 2015 declined by almost 32% from the prior year.

Airline and Affiliates 2014 Passengers 2015 Passengers % Increase Market Share
American 3,078,481 3,287,333 6.8% 6.09%
Delta 2,364,589 2,675,472 13.1% 4.95%
Frontier 9,840,553 6,697,139 -31.9% 12.40%
Southwest 14,100,970 15,814,696 12.2% 29.80%
United 21,750,604 22,855,819 5.1% 42.31%
Other 2,337,317 2,684,043 24.8% 4.97%

During each of the 20 years that DIA has been in operation, the airport has become more important to the Colorado economy. That will continue to be in case in the years ahead with the addition of the Westin Hotel at the end of the terminal.

In addition there will be a stronger connection to downtown Denver when the light rail project between DIA and Denver is completed. Over the past 20 years businesses have sprung up around DIA. A prime example of that is the Gaylord project that is expected to open in 2-3 years.

DIA has two distinctive competencies over many other airports. First, it is located in the middle of the U.S. Second, it has room to expand when growth becomes necessary.

DIA is poised to be an economic engine for Colorado in 2016 and many years into the future.

Colorado New Car Registrations Top Record in 2015

Colorado auto dealers had a banner year in 2015 reaching a record 203,471 new car registrations. This topped the previous high of 198,910 in 2002. Auto sales were driven by low gasoline prices, easy access to credit and low interest rates. In addition, Colorado experienced strong net migration and solid employment growth in 2015.

After peaking in 2002, the number of new registrations gradually tapered off until 2007. At that point they plummeted to 104,687 in 2009.

The number of new car registrations has almost doubled between 2009 and 2015.

Colorado New Car Registrations

About 35% of the 2015 new registrations were light trucks and 65% were autos. Light truck new registrations increased by 15.3% compared to only 3.5% for cars.

Category 2014 2015 % Change
Total 188,416 203,471 8.0%
Cars 73,112 70,561 3.5%
Light Trucks 115,304 "132 910" 15.3%

Almost 45% of the 2015 new registrations were for Japanese brands and 39% were for the top three Detriot brands. Slightly more than 10% were European brands and the remaining 6% were Korean brands.

The new registrations for Detroit and European brands increased by almost 10%, while the Japanese brands increased by slightly more than 7.4%. There was a decline in the number of new registrations for the Korean Brands.

Category 2014 2015 % Change
Detroit Three Brands 71,962 79,113 9.9%
European Brands 19,450 21,293 9.5%
Japanese Brands 84,896 91,154 7.4%
Korean Brands 12,108 11,911 -1.6%

The vehicle segments with the largest gains in market share, 2015 vs. 2014, were compact and compact luxury SUVs. The largest losers were standard mid-size cars and sub-compact cars.

Winners – 2015 vs. 2014

Category Change in Market Share (points)
Compact SUV 1.4
Compact luxury SUV 0.9
Compact pickup 0.8
Full size pickup 0.7
Full size crossover SUV 0.4
Full size van 0.2
Full size luxury SUV 0.1
Mid-size crossover SUV 0.1
Minivan 0.1

Losers – 2015 vs. 2014

Category Change in Market Share (points)
Sub-compact car -1.5%
Standard mid-sized care -1.5%
Entry car -0.7%
Large mid-size car -0.3%
Luxury car -0.3%
Mid-sized luxury SUV -0.2%
Sport-compact car -0.1%

The categories where there was no change in leadership were:
• Near luxury car
• Full-size SUV
• Mid-size SUV
• Sports car

If the economy stays healthy, car sales will likely show record growth in new car registrations again in 2016.

The source for the data in this post is the Colorado Auto Dealers Association.

Rocky Mountain National Park Will Top 4 Million Visitors in 2015

For many years Rocky Mountain National Park has been one of the state’s top tourist attractions. This year it is on track to surpass four million visitors.  Lower gas prices have played a role in increasing the number of visitations at Rocky Mountain as well as other western national parks.

In addition, the higher number of visitors is a result of the celebration of the park’s 100th birthday and the publicity surrounding that landmark. Throughout the year there have been numerous events celebrating the event that culminated with a re-dedication of the park on September 4th. National Park officials have indicated that visitations are frequently 10% to 15% higher during their centennial years.

The park opened in 1915 and 31,000 people visited the park. By 1948, the number of visitations topped 1 million for the first time (1,023,262). More recently the number of visitors has shown steady growth:
• 2010   2,955,821
• 2011   3,176,941
• 2012   3,229,617
• 2013   2,991,141
• 2014   3,443,501
• 2015   4,100,000 estimated.

Note: the decline in 2013 is a result of a federal government shutdown and severe flooding.

Here are some fascinating facts about Rocky Mountain National Park from the park’s website:
•Rocky Mountain National Park was established in 1915.
•The Continental Divide (a demarcation of the flow of water between the Pacific Ocean and Atlantic Ocean) runs through the park.
•Grand Lake Cemetery (which was founded in 1892) is the only active community cemetery operating inside a national park.
•Elevations inside Rocky Mountain National Park range from 8,000 feet in the valleys to 14,259 feet at the top of Longs Peak (the highest point in the park).

In Rocky Mountain National Park, there are:
•35 trailheads, with 359 miles of established trails
•585 drive-in campsites (situated in 5 campgrounds) and 200 backcountry campsites
•60 types of mammals (including moose, elk, bighorn sheep, black bears, coyotes, and mule deer)
•280 species of birds
•900 different plants
•150 lakes
•476 miles of streams and creeks, including, most notably, the headwaters of the Colorado River
•260 miles of horse trails
•5 visitor centers.

Whether it is the year ’round spectacular views, the spring-time flowers, or the bugling elk in October – its worth the trip.Rocky Mountain National Park

BLS Benchmark Revisions Push 2014 Colorado Employment Higher

The Bureau of Labor Statistics released their benchmark revisions for 2014 Colorado employment in March. The upward revisions were significant and showed that Colorado added 78,900 wage and salary jobs. The final revisions for 2013 were minimal.

The data provided no surprise for those who gauge economic growth by the activity on the streets. The magnitude of the upward revision was disappointing for those who rely heavily on accurate jobs data to make critical business decisions.

In fairness to BLS, it is a challenge to report employment data in periods of strong growth and decline. As has been the case with many public and private organizations, BLS has been expected to provide more accurate estimates in shorter time frame at a lower cost. That is not always an equation for high accuracy.

The “preliminary” data showed that Colorado employment was increasing at a decreasing rate in the second half of 2014. The “benchmark” data shows there was actually strong growth. In addition, their estimate methodologies caused noticeable errors in key industries. In other words, industries that were thought to be having a really strong impact on the growth of the state were only having a strong impact on it.

It is important to understand the significance of the difference between the preliminary and the benchmark data.

Most economic forecasts for 2015 were based on the preliminary 2014 data – the data with the errors. Most likely these forecasts will not accurately account for the actual magnitude of job growth in 2014 which may cause errors in their estimation of growth in 2015.

Use caution when reviewing any Colorado jobs forecasts for 2015. Most are likely to contain biases resulting incorrect assumptions derived from the 2014 data.

The good news is the state added jobs at a faster rate than anticipated. Most likely Colorado will enjoy a similar rate of growth in 2015.

benchmark vs preliminary data

2014 Unemployment Rate – Challenges and Positives for 2015

On March 4, the Bureau of Labor Statistics released its annual unemployment data for Colorado. The 2014 unemployment rate for Colorado was 5.0%, down from 6.8% in 2013. The average number of unemployed decreased from 189,023 in 2013 to 141,387 in 2014.

With that as a background, some of the challenges and positives facing the economy are listed below.

Employment in Colorado has increased at a modest and manageable rate for the last two years. A similar level of growth is expected in 2015, but there will be some challenges.
• The decline in the price of oil has begun to hit Colorado producers. The breakeven point for the Niobrara is in the $65 to $70 range. Several companies have announced significant layoffs.
• In addition to the drop in the price of oil, demand for Colorado coal declined in 2014. Coal is a major driver of several rural economies throughout the state. With the decline in demand, many communities are fine tuning their economic development strategies to diversify their economies.
• Colorado’s rate of inflation is more than a point higher than the rate for the U.S. (The Denver-Boulder-Greeley index is used as a proxy for the state). Last year it was 1.6% for the U.S., while it was 2.8% for Colorado. The rapidly appreciating prices of housing in Denver and many parts of the state are largely responsible for the gap in inflation between the state and the nation.
• Rising home prices are a two-edged sword. They benefit the home owners but may be detrimental to prospective buyers. In parts of the Front Range, there is solid demand and low inventories for certain types of housing, particularly at the lower end. Affordable and attainable housing are in high demand.

On the other hand the state has many positives:
• Nationally, jobs are being added at rate that is accelerating slightly. That bodes well for Colorado.
• The decline in oil and gas prices has increased disposable income slightly, about $50 for 2014 and $500 to $700 for 2015.
• Rising home prices will be beneficial to Colorado. Homeowners are more confident if they feel the value of their home is increasing. As a result they may spend more. Rising property values directly benefit the coffers of local governments and school districts.
• After a slowdown in 2014, Wall Street is enjoying a bull market. This in turn creates wealth and increases greater consumer and business confidence.
• Unemployment is expected to remain below 5.0% throughout 2015. As a result wage pressures will become a bigger issue in more occupations and industries. This is great for workers, particularly if their increases exceed Colorado’s rate of inflation (2.8% in 2014). Wage increases that exceed the rate of inflation will serve as a form of stimulus to the economy because workers will have greater confidence and more to spend. In turn, education and state and local government will be able to more fully fund programs that have been underfunded in the past.
• Because the decline in the price of oil is a global issue, oil and gas employees may not be able to move to other states or countries to find work. With the Colorado unemployment in the range of 4.0% some of these workers may be able to stay in-state and work in construction, manufacturing or other positions.
• Colorado has experienced another first-rate ski season, with an added benefit of hosting the 2015 FIS Alpine World Ski Championships in Vail. The event showcased the state to 700 athletes from more than 70 nations.
• The spring snow storms significantly increased snowpack levels in many parts of the state; however, additional snow is needed. Water in critical for all aspects of Colorado’s economy. While the snow is often viewed as an inconvenience to those along the Front Range, it is essential to have good snow pack in our mountains and counties where agriculture dominates the local economy.
• The sectors that have driven the economy over the past two years are construction; healthcare; accommodations and food services; retail trade; and professional, scientific, and technical services (PST). These sectors are expected to account for about 60% of the job growth in the state in 2015. There will admittedly be challenges in the extractive industries; however, they will have a minor impact on the growth of the state’s top five sectors for job growth.

As Colorado addresses these challenges and positives, job growth in 2015 is expected to be at or slightly less than the rate for 2014.

Colorado Population – 5.4 Million in 2015

The Colorado population increases and decreases are a result of the natural rate of change (births minus deaths) and the change in net migration (people moving into the state minus people moving out of the state).

Over the past two decades the natural change (red bars) varied from a low of 29,168 in 1995 to a peak of 41,124 in 2007.

Changes resulting from net migration (blue bars) are closely tied to the strength of the economy. For example, there were five years, from 1986 to 1990, when net migration was negative. More people moved out of state than moved into the state to escape a regional recession. During the past two recessions, net migration declined, but did not turn negative because it was difficult for people to move. Net migration remained positive.

The Colorado population increased by about 86,000 in 2014 and will increase by about 89,000 in 2015.

Net migration will increase by 56,000 in 2015, the highest level of change since 2001. In 2015 the state’s population will increase by 1.7% to 5.4 million.

change in popuoation