In early June the Bureau of Economic Analysis released Gross Domestic Product at the state level for two-digit NAICS Codes.
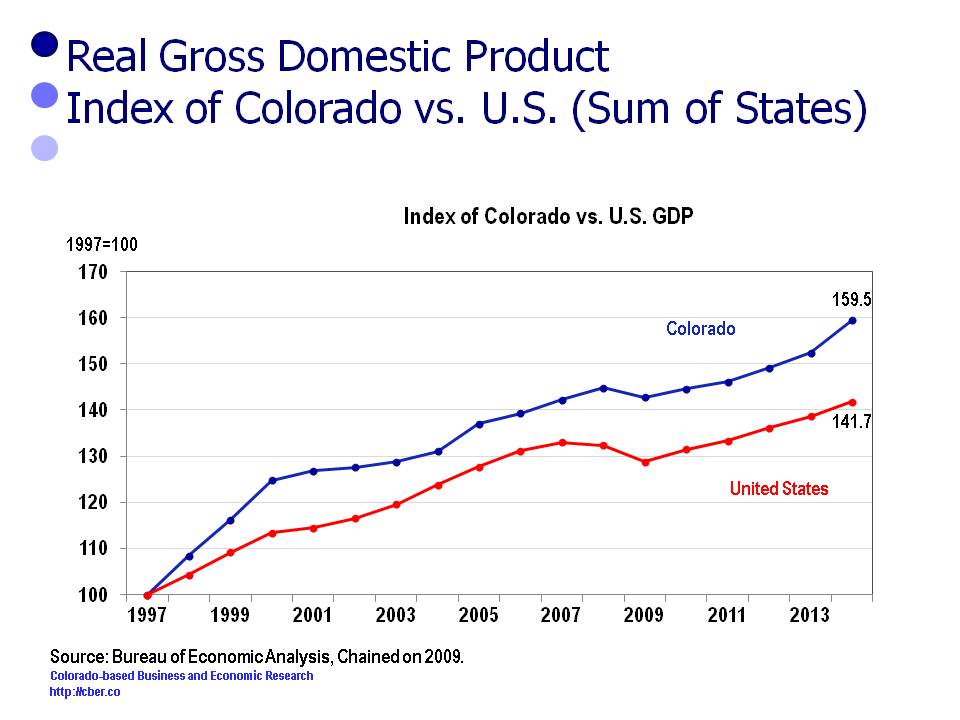
Since 1997 Colorado Real GDP has grown at a faster rate than the Real GDP for the U.S. (Sum of States) in 11 of 17 years. The 2014 U.S. rate of growth was 2.2% compared to 4.7% for Colorado.
Since 1997 Colorado Real GDP has grown at a faster rate than the U.S. (Sum of States), 2.8% vs. 2.1%.
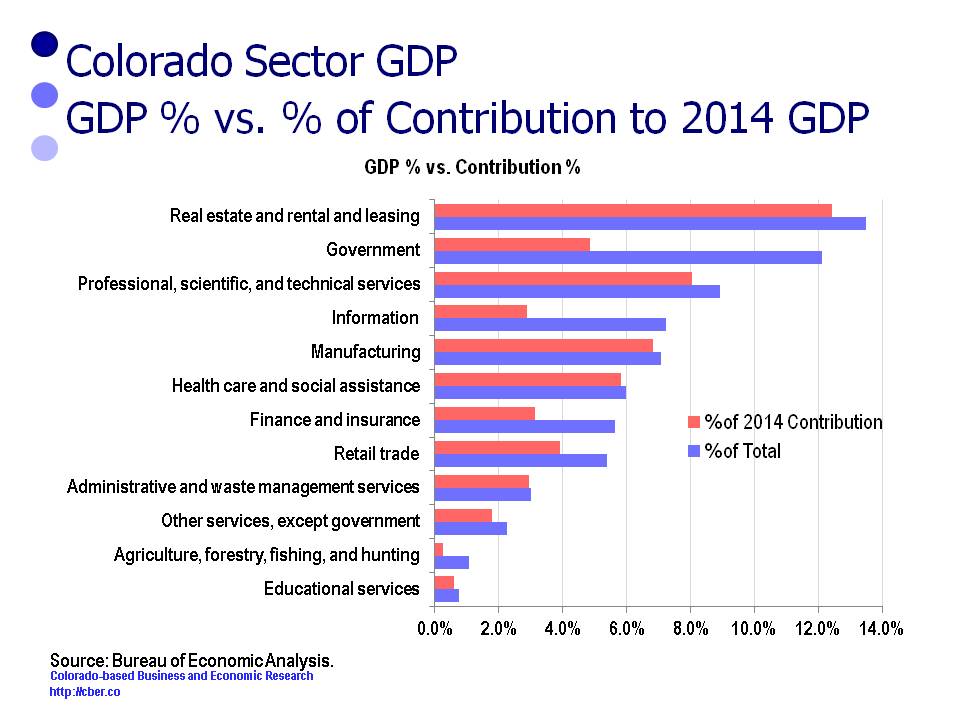
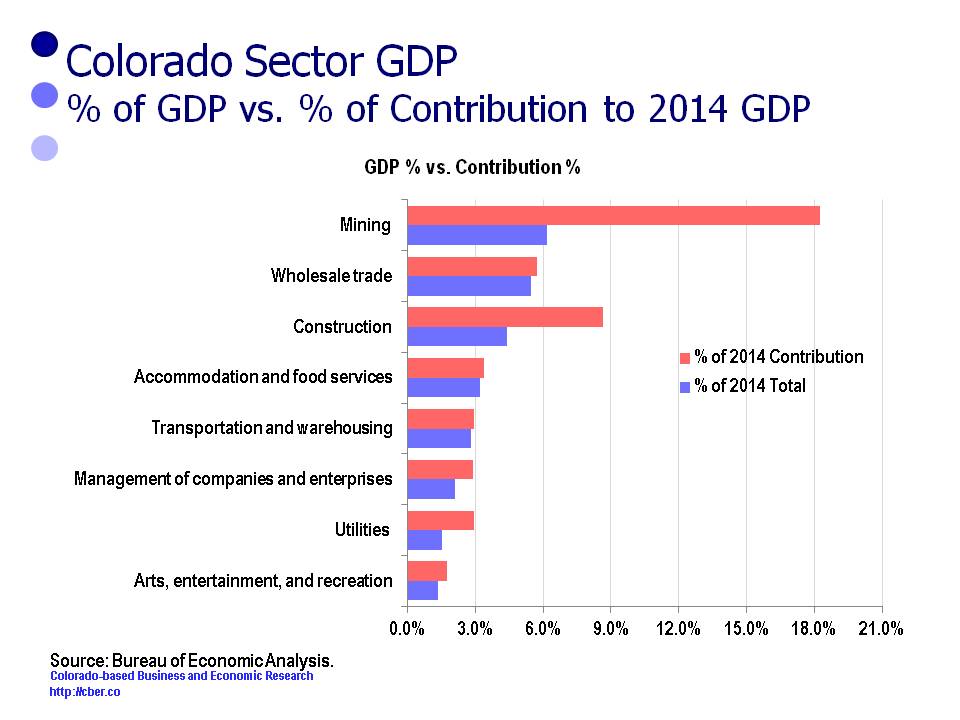
There were 12 sectors that lost share in 2014, i.e. their percent of contribution for these sectors was less than their percent of the 2014 total. Collectively, they accounted for 72.9% of the 2014 GDP and 53.5% of the change in the GDP. It was disappointing that the proxy for Colorado’s advanced technology cluster only contributed 17.8% to state’s GDP.
The following table shows the sectors, their percentage of the 2014 GDP and their contribution to the GDP.
| Sector | % of 2014 Total | % of 2014 Contribution |
|---|---|---|
| Educational services | 0.7% | 0.6% |
| Agriculture, forestry, fishing, and hunting | 1.1% | 0.3% |
| Other services, except government | 2.3% | 1.8% |
| Administrative and waste management services | 3.0% | 2.9% |
| Retail trade | 5.4% | 3.9% |
| Finance and insurance | 5.6% | 3.1% |
| Health care and social assistance | 6.0% | 5.8% |
| Manufacturing | 7.1% | 6.8% |
| Information | 7.2% | 2.9% |
| Professional, scientific, and technical services | 8.9% | 8.1% |
| Government | 12.1% | 4.8% |
| Real estate and rental and leasing | 13.5% | 12.4% |
There are concerns regarding the level of contribution for the five sectors that have the greatest share of the state’s GDP. The top sectors are:
• Real Estate 13.5%
• Government 12.1%
• Professional, scientific, and technical services, 8.9%
• Information 7.2%
• Manufacturing 7.1%
These five sectors accounted for 48.8% of the 2014 GDP; however they only contributed 35.0% of the 2014 GDP growth.
Of specific concern is the fact that PST, Information, and Manufacturing accounted for 23.2% of the state’s 2014 GDP, yet these 3 sectors only contributed 17.8% of the growth of the GDP. These three sectors are a proxy for the state’s advanced technology cluster, a cluster that is supposed to provide the state with a competitive advantage.
Despite these concerns, the level of Real GDP Growth in 2014 provided significant momentum for the Colorado economy moving into 2015.