Blog

Colorado Population – 5.4 Million in 2015

The Colorado population increases and decreases are a result of the natural rate of change (births minus deaths) and the change in net migration (people moving into the state minus people moving out of the state).

Over the past two decades the natural change (red bars) varied from a low of 29,168 in 1995 to a peak of 41,124 in 2007.

Changes resulting from net migration (blue bars) are closely tied to the strength of the economy. For example, there were five years, from 1986 to 1990, when net migration was negative. More people moved out of state than moved into the state to escape a regional recession. During the past two recessions, net migration declined, but did not turn negative because it was difficult for people to move. Net migration remained positive.

The Colorado population increased by about 86,000 in 2014 and will increase by about 89,000 in 2015.

Net migration will increase by 56,000 in 2015, the highest level of change since 2001. In 2015 the state’s population will increase by 1.7% to 5.4 million.

change in popuoation

Colorado New Vehicle Registrations Trend Upward

One of many signs of a solid Colorado economy is the growth in the number of new vehicle registrations. Increased registrations are usually a function of a growing population and solid job growth.

New registrations are also stimulated by low interest rates and higher consumer confidence. As well, lower gas prices may fuel the sales of models that have lower gas mileage, such as large pickups or four-wheel drive vehicles.

The number of new vehicle registrations in Colorado decreased from 198,910 in 2002 to 104,687 in 2009. Even though there was a steady increase in the state population, back-to-back recessions caused the sharp decline in registrations.

A solid recovery began in 2010 followed by double digit growth in 2011, 2012, and 2013. In 2013 there were 176,433 new vehicle registrations.

The estimated rate of growth will slow to 6.5% in2014 with 187,901 registrations. In 2015 there will be a 3.2% growth rate to 194,000 registrations. The “slowdown” in the rate of growth will occur as sales will increase at a more sustainable rate. In addition, uncertainty in the extractive industries will cause some consumers to be more cautious.

new vehicle registrations

Lower Gasoline Prices Save $45 in 2014

In mid-April 2012 the price for a gallon of gasoline was just under $4.00. It slowly declined through mid 2014 to about $3.80 in the U.S. and Colorado. At that point it went into a freefall and closed the year at about $2.40 per gallon.

The Savings
• For 2014 the cost to purchase 15 gallons of gasoline per week in Colorado was $2,659 compared to $2,704 in 2013. In other words, the “savings” was $45 for the year.
• For 2014 the cost to purchase 15 gallons of gasoline per week in the U.S. was $2,696 compared to $2,788 in 2013. The savings was $92 for the year.
• For 2014, the cost to purchase 15 gallons of gasoline per week in Colorado was $37 less than the U.S.

The Good News – Lower gasoline prices may increase discretionary income for consumers. It may decrease the cost of other goods, if businesses pass along their savings for lower fuel costs. In Colorado, the thought of greater discretionary income may be nothing more than a dream for many as inflation, particularly for housing costs, has risen.

The Not So Good News – Typically, the impact of lower oil and gasoline prices on the state is negative. In other words, consumers will benefit; however, state coffers will not be as full because tax collections will be lower.

There is no free lunch!

gasoline prices

Colorado Economy Remains on Solid Footing

The most recent data release by the Bureau of Labor Statistics showed the Colorado economy remains on solid footing.

The unemployment rate dropped from 6.2% a year ago to 4.0% this year. That sharp of a drop produces significant shock within the system, more so than when the change is more gradual.

With that sharp of decline, it becomes difficult to find workers in some occupations. That difficulty will be accentuated by a sense of urgency to find workers. As well, more industries will face upward wage pressures. That is good for workers, but will cut into the bottom line of companies.

The recent jobs data is another indicator the Colorado economy is continuing to grow at a steady pace. For all practical purposes, it is meaningless to talk about the December numbers. When BLS makes their annual revisions in March, it is likely the number of Colorado jobs will be revised upwards.

The U.S. economy is solid which bodes well for Colorado. New car sales have returned to pre-recession levels, real GDP will be stronger this year both globally and for the U.S., the U.S. should add more than 2.6 million jobs this year (and Colorado should be at least 2.7% of that total), government spending will be stronger, and purchasing managers in manufacturing and service companies are optimistic.

In Colorado, BLS data will show that the number of establishments increased at a greater rate than in 2013. If there are more businesses there are more potential job opportunities for workers.

In 2015 about 60% of job growth will be in construction; health care; accommodations and food services; retail trade; and professional and technical services.

Admittedly, the price of oil will have an effect on the rate of job growth in 2015; however, at a statewide level, most of the top sectors will show steady growth unless the price of oil stays low for an extended period.

The steady growth that is currently occurring in the Colorado economy is much easier to manage and deal with than the rapid growth the state experienced during the 1990s.

Colorado Establishments by Category Size

At last count, there were 174,020 private sector Colorado establishments. It will come as a surprise to some that 99.95% of the Colorado establishments have fewer than 1,000 employees.

In fact there are 83 establishments with 1,000 or more employees and there are 161 with 500 to 999 employees. About 88.6% of Colorado’s establishments have fewer than 20 workers.

BLS is very specific about what an “establishments” is. This is illustrated by the following definition from the Glossary on their website.

The physical location of a certain economic activity—for example, a factory, mine, store, or office. A single establishment generally produces a single good or provides a single service. An enterprise (a private firm, government, or nonprofit organization) can consist of a single establishment or multiple establishments. All establishments in an enterprise may be classified in one industry (e.g., a chain), or they may be classified in different industries (e.g., a conglomerate).

Number of Colorado Establishments by Size Category
Category Number Percentage Cumulative Percentage
Fewer than 5 employees per establishment 108,973 62.62% 62.62%
5 to 9 employees per establishment 26,697 15.34% 77.96%
10 to 19 employees per establishment 18,537 10.65% 88.61%
20 to 49 employees per establishment 12,932 7.43% 96.05%
50 to 99 employees per establishment 4,070 2.34% 98.38%
100 to 249 employees per establishment 2,074 1.19% 99.58%
250 to 499 employees per establishment 493 0.28% 99.86%
500 to 999 employees per establishment 161 0.09% 99.95%
1000 or more employees per establishment 83 0.05% 100.00%
Total 174 020 100.00%
Source: BLS

Debt – Good or Bad?

Depending on your perspective…
• Debt is good if it is used to make purchases that stimulate consumption and economic growth.
• Debt can deter growth if debt service obligations prevent consumption and economic growth.

Whether or not you believe debt is good for the economy, one thing is for sure. Debt has increased!

Federal Debt
• 1966 to 2000 (34 years), $.3 trillion to $5.8 trillion; the level of debt increased by$5.3 trillion.
• 2000 to 2008 (8 years) $5.8 trillion to $9.4 trillion; the level of debt increased by $3.6 trillion.
• 2008 to July 2014 (68 months) $9.4 to $17.8 trillion; the level of debt increased by $8.4 trillion.

Public Debt has exceeded GDP since Q4 2012. The only other time that debt as a percent of GDP has been greater was during the 1940s.

Consumer Credit Outstanding
• In January 2006 Consumer Credit Outstanding was $2.37 trillion.
• In October 2014 Consumer Credit Outstanding was $3.28 trillion.

Student Loans
• In Q1 2006 Student Loans Outstanding were $500 billion.
• In Q3 2014 Student Loans Outstanding were $1.3 trillion.

Is this level of debt stimulating or preventing growth in the U.S. economy?

debt


cber.co 2015 Colorado Economic Forecast by Category

The primary focus of most state economic forecasts is to project total state employment.

Some economists also produce sector forecasts. They usually add projections for the sectors to derive the state total, an approach that introduces numerous variables for error.

cber.co feels the most accurate forecast is achieved by projecting total employment based on projections for categories of sectors. Sectors are grouped into three categories based on their past performance.

Projections for the categories and overall employment are based on trends, feedback from business leaders, economic developers, and other economists. The sum of these categories is then compared to the projections for overall total employment.

Minor adjustments are made and the final forecast is produced for three scenarios. The most likely scenario is used as the final cber.co forecast. This final step helps create a better understanding of upside and downside risk associated with the forecast.

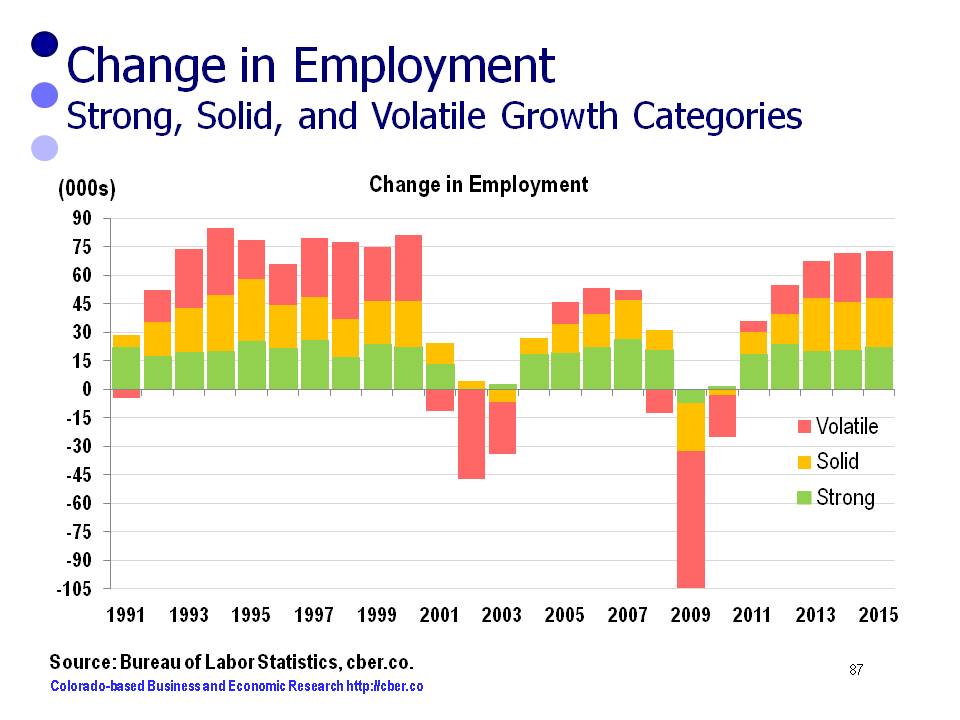
This portfolio approach has made it easy to see that some sectors consistently create jobs at a higher rate of growth, some show solid growth, and others are more volatile. Ultimately, the volatile category tends to have a greater influence on the amount of change in total job growth than the sectors with steady growth.

In 2015, the growth of the Strong, Solid, and Volatile Growth Categories will be similar to 2014.

The Strong Growth Category of sectors (green) has performed consistently over time. The category added jobs as expected in 2014. The larger sectors (Health Care, PST, and B-to-B, excluding Temp. Services) grew at a rate faster than the state. Arts, Entertainment, and Recreation, a smaller sector, grew faster than the state.

Recent and projected employment changes for the Strong Growth Category follow:
• 2012 24,000
• 2013 20,000
• 2014 20,900
• 2015 20,000 to 24,000

Over time, the Solid Growth Category of sectors (yellow) has been more volatile than the Strong Growth Category. In 2014, this category performed stronger than anticipated. AFS and K-12 Education expanded at a faster rate than the state.

Recent and projected employment changes for the Solid Growth Category follow:
• 2012 15,600
• 2013 27,600
• 2014 25,200
• 2015 24,000 to 28,000

Finally, the Volatile Category of sectors (red) was a significant source of growth in 2013 and 2014. In 2014 the Construction, Employment Services, Transportation and Warehousing, and the Extractive Industry sectors expanded at a faster rate than the overall state average.

Recent and projected employment changes for the Volatile Category follow:
• 2012 15,100
• 2013 19,800
• 2014 25,600
• 2015 23,000 to 27,000.

In 2015, overall state employment will increase by 2.8% to 3.0% or 70,000 to 76,000 jobs. Average Colorado employment will be 2,525,600 for 2015.

For additional information about the 2015 cber.co Colorado Economic Forecast click here.

Colorado Economic Forecast

Colorado Employment to Continue at Steady Pace in 2015

Later this week, cber.co will release its Colorado economic forecast for 2015. The primary focus of the Colorado forecast is employment within the state. As economic developers say, “it all starts with a job.”

Each year the forecast provides an optimistic, pessimistic, and most likely scenario.

The 2015 optimistic scenario calls for:
• U.S. Real GDP growth will be greater than 2.9%.
• Colorado will add more than 76,000 workers.

The projected likelihood of this scenario is 15%. The Colorado economy has experienced solid job growth since 2012; however, there is nothing to believe that it will experience growth at a significantly greater rate during 2015.

The pessimistic scenario calls for:
• U.S. Real GDP growth will be less than 2.5%.
• Less that 70,000 Colorado workers.

Unfortunately, there is more downside risk to the forecast than upside risk. The projected likelihood of this scenario is 30%. While the global and U.S. economies are expected to see slight growth in output, the Colorado economy could be derailed if the price of oil remains below $65 per barrel (the estimated breakeven point for the Niobrara Oil field) for an extended period.

The most likely scenario calls for:
• U.S. Real GDP will be 2.5% to 2.9%.
• The U.S. will add at least 2.6 million workers.
• Colorado will add 3.0% of total U.S. jobs added.
• Colorado will add 70,000 to 76,000 workers, job growth will be 2.8% to 3.0%.

Despite downside risks associated with lower prices for oil and reduction production in Colorado there is a 55% likelihood this forecast will occur. Since 2012 growth has been steady and broad-based. Much of the growth has been in sectors such as tourism, which have an indirect link to the extractive industries.

Average Colorado employment will be 2,525,600 for 2015.

For additional information about the 2015 cber.co Colorado Economic Forecast click here.

Mining and Real Estate – Drivers of the Colorado Economy

Thank goodness for the  mining and real estate industries! From an output perspective these industries are the primary drivers of the Colorado economy.

In 2013, Colorado’s nominal GDP was $294.4 billion (most current data available). The state’s economy expanded by $157.1 billion between 1997 and 2013 (1997 is the first year that data was available). Between 2009 and 2013 the GDP expanded by $46.3 billion.

The Great Recession had a major impact on the way the economy expanded. This is evident when comparing the contribution to output for the periods 1997 to 2013 and 2009 to 2013.

Between 1997 and 2013 the contribution to GDP was broken down as follows:
• Goods Producing 20.5%
• Service Producing 68.6%
• Private sector (Goods + Services) 89.0%
• Government 11.0%

Between 1997 and 2013 the annualized rate of growth for the GDP follows:
• Total 4.9%
• Private 5.0%
• Government 4.1%

Between 2009 and 2013 the contribution to GDP was broken down as follows:
• Goods Producing 28.0%
• Service Producing 65.5%
• Private sector (Goods + Service) 93.6%
• Government 6.4%

Between 2009 and 2013 the annualized rate of growth for the GDP follows:
• Total 4.4%
• Private 4.7%
• Government 2.2%

Thank goodness for the Goods Producing Sectors (Agriculture, Mining, Construction, and Manufacturing)!

Industry 2013 GDP (millions) 2013 minus 1997 % of Total 2013 minus 2009 % of Total
All industry total $294,443 $157,072 $46,266
Private industries $258,217 $139,860 89.0% $43,287 93.6%
Goods Producing $57,447 $32,144 20.5% $12,964 28.0%
Service Producing $200,771 $107,718 68.6% $30,325 65.5%
Government $36,226 $17,212 11.0% $2,979 6.4%

The following two tables provide more detail by industry.

The following table shows more detail by industry sector. It is sorted in descending order by the column 2013 minus 1997.

Industry 2013 GDP (millions) 2013 minus 1997 % of Total 2013 minus 2009 % of Total
Real estate and rental and leasing $40,194 $21,355 13.6% $6,895 14.9%
Mining $19,848 $17,964 11.4% $8,518 18.4%
Government $36,226 $17,212 11.0% $2,979 6.4%
Professional, scientific, and technical services $26,355 $16,084 10.2% $4,233 9.1%
Information $21,578 $12,019 7.7% $1,407 3.0%
Health care and social assistance $17,438 $10,503 6.7% $2,262 4.9%
Wholesale trade $15,915 $7,818 5.0% $2,606 5.6%
Retail trade $16,105 $6,926 4.4% $1,965 4.2%
Manufacturing $21,600 $6,657 4.2% $2,171 4.7%
Finance and insurance $14,480 $6,067 3.9% $2,436 5.3%
Accommodation and food services $9,409 $5,255 3.3% $1,769 3.8%
Management of companies and enterprises $6,207 $5,106 3.3% $1,550 3.4%
Construction $11,820 $4,861 3.1% $208 0.4%
Administrative and waste management $8,653 $4,308 2.7% $1,090 2.4%
Transportation and warehousing $7,984 $4,094 2.6% $1,598 3.5%
Other services $6,549 $2,784 1.8% $605 1.3%
Agriculture, forestry, fishing, and hunting $4,179 $2,662 1.7% $2,067 4.5%
Arts, entertainment, and recreation $3,848 $2,029 1.3% $890 1.9%
Utilities $3,798 $1,782 1.1% $646 1.4%
Educational services $2,258 $1,588 1.0% $373 0.8%

The following table shows more detail by industry sector. It is sorted in descending order by the column 2013 minus 2009.

Industry 2013 GDP (millions) 2013 minus 1997 % of Total 2013 minus 2009 % of Total
Mining $19,848 $17,964 11.4% $8,518 18.4%
Real estate and rental and leasing $40,194 $21,355 13.6% $6,895 14.9%
Professional, scientific, and technical services $26,355 $16,084 10.2% $4,233 9.1%
Government $36,226 $17,212 11.0% $2,979 6.4%
Wholesale trade $15,915 $7,818 5.0% $2,606 5.6%
Finance and insurance $14,480 $6,067 3.9% $2,436 5.3%
Health care and social assistance $17,438 $10,503 6.7% $2,262 4.9%
Manufacturing $21,600 $6,657 4.2% $2,171 4.7%
Agriculture, forestry, fishing, and hunting $4,179 $2,662 1.7% $2,067 4.5%
Retail trade $16,105 $6,926 4.4% $1,965 4.2%
Accommodation and food services $9,409 $5,255 3.3% $1,769 3.8%
Transportation and warehousing $7,984 $4,094 2.6% $1,598 3.5%
Management of companies and enterprises $6,207 $5,106 3.3% $1,550 3.4%
Information $21,578 $12,019 7.7% $1,407 3.0%
Administrative and waste management $8,653 $4,308 2.7% $1,090 2.4%
Arts, entertainment, and recreation $3,848 $2,029 1.3% $890 1.9%
Utilities $3,798 $1,782 1.1% $646 1.4%
Other services $6,549 $2,784 1.8% $605 1.3%
Educational services $2,258 $1,588 1.0% $373 0.8%
Construction $11,820 $4,861 3.1% $208 0.4%


When Can We Expect the Next Recession?

The National Bureau of Economic Research (NBER) officially tracks the performance of the U.S. economy for the purpose of identifying the timing of the troughs and peaks, which determine when recessions occur.  Specifically, NBER identifies:
• The length of the contraction, peak to trough.
• The length of the expansion, trough to peak.
• The length of the cycle, peak to peak.
• The length of the cycle, trough to trough.

They don’t predict when the next recession will occur. Instead, they will announce when the most recent recession has started and ended after-the-fact.

The following table shows NBER data since the end of World War II.

1-Peak 2- Trough 3-Contraction- Peak to Trough 4-Expansion- Trough to Peak 5-Cycle- Peak to Peak 6-Cycle-Trough to Trough
November 1948(IV) October 1949 (IV) 11 37 48 45
July 1953(II) May 1954 (II) 10 45 55 56
August 1957(III) April 1958 (II) 8 39 47 49
April 1960(II) February 1961 (I) 10 24 34 32
December 1969(IV) November 1970 (IV) 11 106 117 116
November 1973(IV) March 1975 (I) 16 36 52 47
January 1980(I) July 1980 (III) 6 58 64 74
July 1981(III) November 1982 (IV) 16 12 28 18
July 1990(III) March 1991(I) 8 92 100 108
March 2001(I) November 2001 (IV) 8 120 128 128
December 2007 (IV) June 2009 (II) 18 73 91 81

Note: Column 5 is the sum of column 3 and column 4 of the same line. Column 6 is the sum of column 3 of the previous line and column 4 of the same line.

In addition, the contraction and expansion data is shown in the following chart.

The next recession

So, when is the next recession?

Recessions are not determined by mathematical equations or charts, rather they are determined by economic conditions that cause the business cycle to move up and down. Since the end of World War II, the length of the shortest business cycle is 18 months (peak from previous peak) and the length of the longest business cycle is 128 months.

Today the U.S. is somewhere in between the shortest and the longest time frame for a business cycle.

The most recent peak was in December 2007. Seven years, or 84 months have passed since the last peak.

The most recent trough was June 2009. Six and a half years, or 66 months have passed since the last trough.

If the length of current and future business cycles is similar to the length of past business cycles, then it is likely the U.S. will see the next recession before the end of Governor Hickenlooper’s term in office.

While it is possible for the next recession to occur prior to the 2016 election, both parties are incented to take every possible step to prevent that from happening.

When is the next recession? Stay tuned!