Colorado Unemployment Rate Drops to 3.6%

Earlier today the Bureau of Labor Statistics released employment and unemployment data  Colorado. It was a mixed blessing.

Unemployment

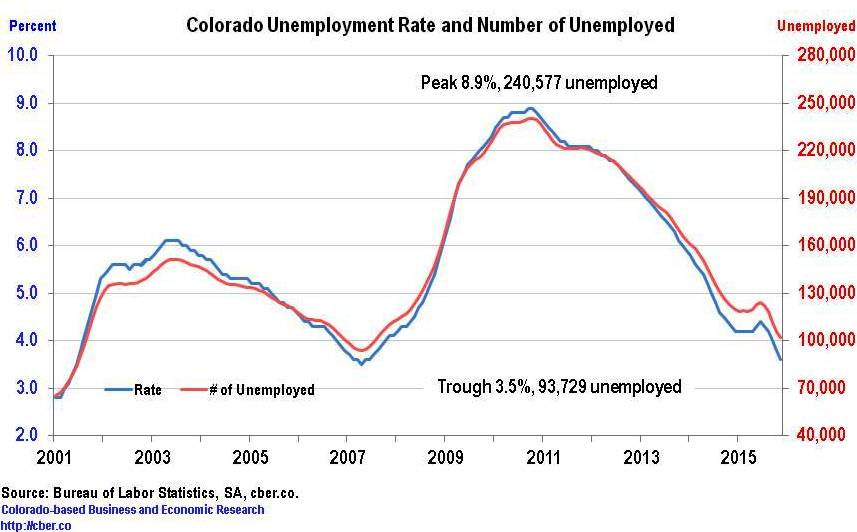
The Colorado unemployment rate for November dropped to 3.6%, down from 3.8% in October and 4.3% a year ago.

Nationally, the unemployment rate declined in 45 states compared to a year ago. By contrast only 27 states have rates lower than October. Colorado’s seasonally adjusted unemployment rate has been at or below 4.2% since December 2014 and there is little room for it to drop much further.

For job hunters this is good news as long as their skills match the available jobs. In addition, there will be upward wage pressure for occupations facing a shortage of qualified workers, such a construction, machining, and technicians.

On the other hand, the lower rate may be bad news for some companies. They may have greater difficulty finding qualified and clean workers. As a result they may have to pay higher wages for skilled positions. In addition, there is greater employee turnover during times of lower unemployment. This may decrease productivity and increase recruitment, hiring, and training costs. These increased costs will lead to lower profit margins and increased prices.

At the end of November there were 102,035 unemployed workers in Colorado. This is only 8,306 greater than the trough in May 2007 and 138,542 less than the peak in October 2010.

unemployment rate

Employment

Despite the lower unemployment rate, November wage and salary job growth was lackluster, only 43,600 greater than a year ago. During the first half of 2015 Colorado employment increased at an average monthly rate of about 5,600 jobs. That average has dropped to 3,900 jobs during the second half of the year.

Even with the declining rate of job growth Colorado will add 55,000 to 60,000 jobs this year – prior to BLS benchmark revisions that will be released in March 2016. Those revisions may push 2015 average employment to 70,000+. The leading sectors for job growth are Health Care, Accommodations and Food Services, and Construction.

As the level of job growth has tapered off there has been an increase in the number of discussions about a recession; however; the Fed’s recent decision to hike interest rates suggests the economy is on solid footing and a recession will not occur in the short-term.
Boulder County and Larimer County Business Development

Both Boulder County and Larimer County are the source of innovation and entrepreneurship that helps drive the Colorado economy.

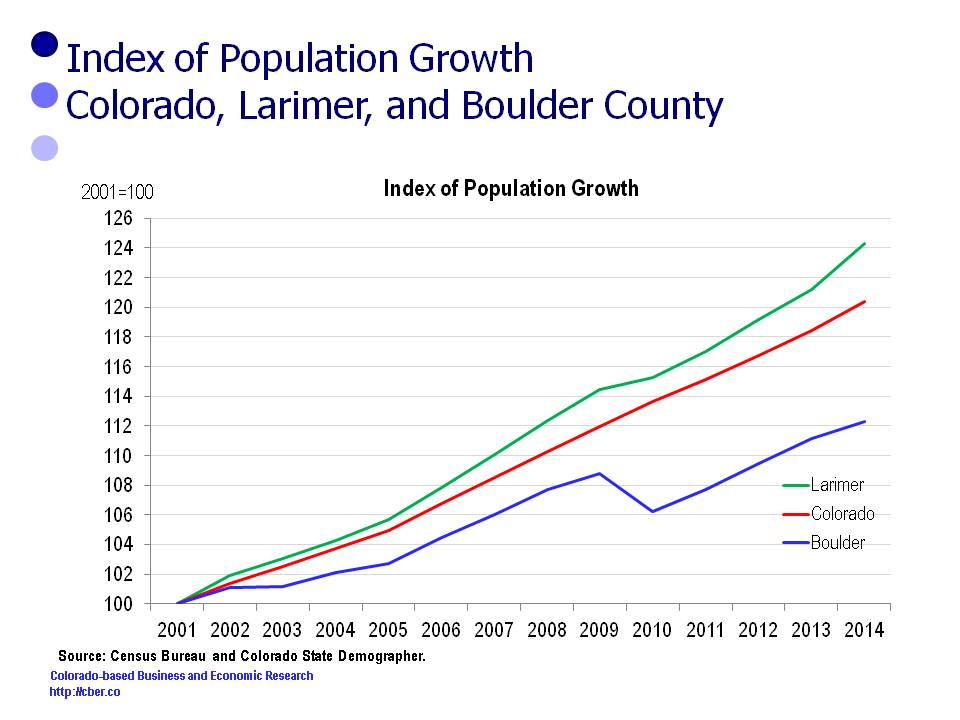
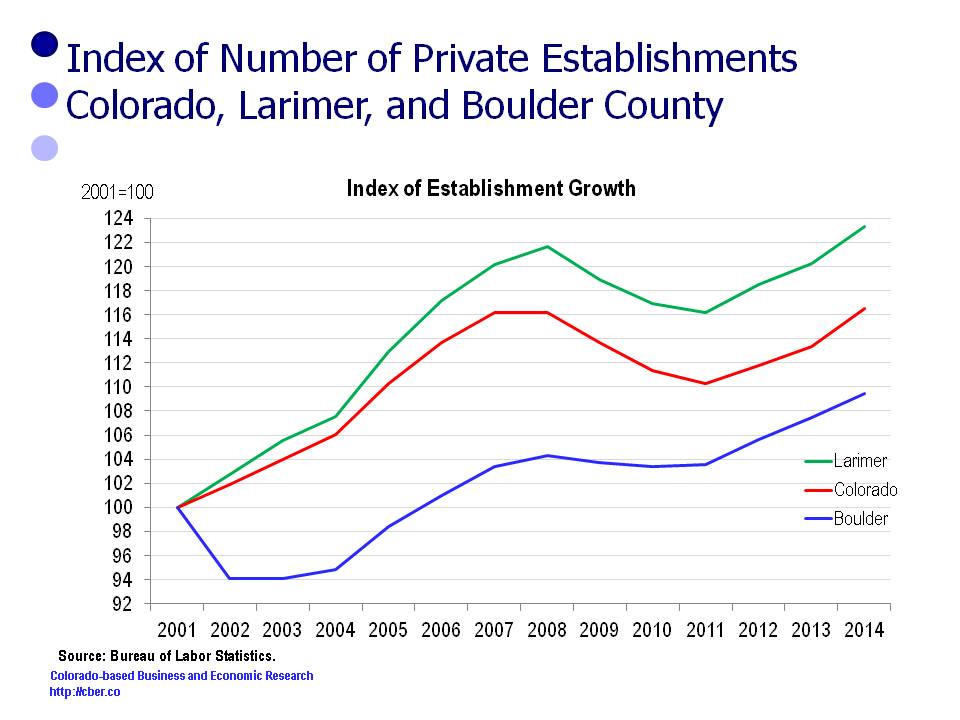
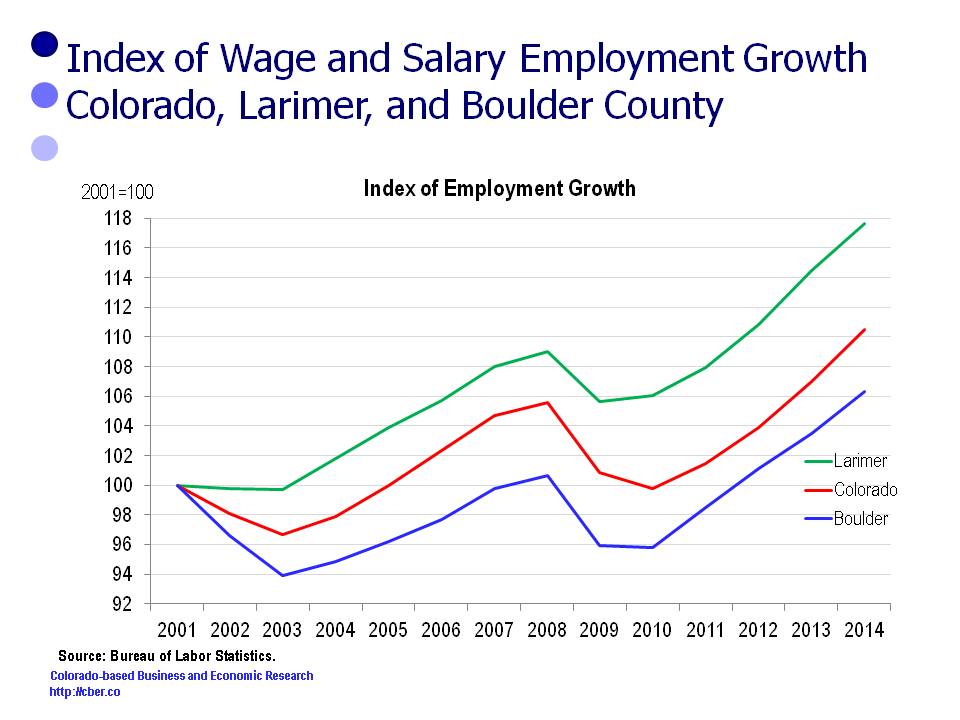
This analysis compares changes in the unemployment rate, population growth, the number of private sector establishments, and employment. It shows how the growth patterns for the two counties are significantly different for these demographics.

In summary, this comparison shows that:
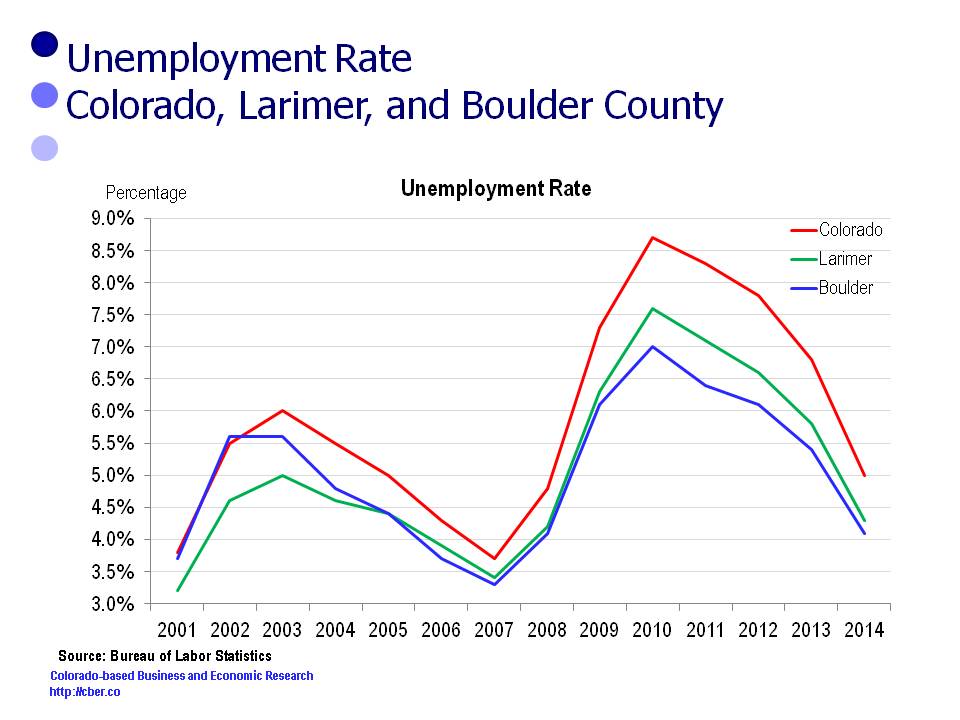
• Since 2001, Boulder County and Larimer County have usually had unemployment rates below the state – which is a mixed blessing.
• Since 2001, the population, employment, and number of private sector establishments for Boulder County have grown below the rates for Colorado and Larimer County.
Finally, this analysis poses questions that relate to the changes in these data sets.

Unemployment Rate

Typically, the unemployment rates for both Boulder and Larimer County are below the rate for the state.Boulder County and Larimer County

Population

In 2001 Larimer County population was 260,746. It increased by 63,376 and was 324,122 in 2014.
In 2001 the Colorado population was 4,444,513. It increased by 906,059 and was 5,350,572 in 2014.
In 2001 Boulder County population was 278,981. It increased by 34,352 and was 313,333 in 2014.

For this period the rates of change in the population follow:
• Larimer County 24.3%
• Colorado 20.4%
• Boulder County 12.3%.

Boulder County and Larimer County

Establishments

In 2001 there were 8,479 Larimer County establishments. The number increased by 1,976 to 10,455 in 2014.
In 2001 there were 151,025 Colorado establishments. The number increased by 24,957 to 175,992 in 2014.
In 2001 there were 12,335 Boulder County establishments. The number increased by 1,165 to 13,500 in 2014.

For this period the rate of change in the number of establishments follows:
• Larimer County 23.0%
• Colorado 16.5%
• Boulder County 9.4%.

Boulder County and Larimer County

Employment

In 2001 Larimer County employment was 126,300. It increased by 22,300 and was 148,600 in 2014.
In 2001 Colorado employment was 2,226,800. It increased by 234,000 and was 2,460,800 in 2014.
In 2001 Boulder County employment was 166,200. It increased by 10,500 and was 176,700 in 2014.

For this period the rate of change in the employment follows:
• Larimer County 17.6%
• Colorado 10.5%
• Boulder County 6.3%.

Boulder County and Larimer County

Implications

The following questions arise when looking at the changes in the unemployment rate, population, the number of private sector establishments, and employment in Boulder County and Larimer County. (Boulder County is also the Boulder MSA and Larimer County is the Fort Collins MSA).

• How do organizations in Boulder and Fort Collins find qualified workers when the regional unemployment rate is lower than the state and other MSAs? Do they have established training programs? Do they recruit workers from other companies (in-state or out-of-state)? Do they provide their workers premium compensation packages?
• Why is the rate of growth for the Boulder population lower than Fort Collins and the state? Is this a result of a lack of affordable and attainable housing in Boulder? Will the completion of improvements to the 36 corridor make it easier for workers to commute to Boulder? Can commuters afford to use it?
• Why are the number of new business establishments in Boulder growing at a slower rate than Colorado and Fort Collins? Is there a lack of adequate commercial space? Is commercial real estate too expensive in Boulder? Why are other areas more attractive? Is it too expensive to operate a business in Boulder? Is it necessary to export innovative ideas out of Boulder so companies can be successful? Why do companies stay in Boulder
• Why is the employment growth rate for Boulder lower than the state and Fort Collins?

This analysis of data for Larimer, Boulder, and Colorado shows that communities have varied business development policies and priorities that have been successful in different ways.

Colorado Economy Remains on Solid Footing

The most recent data release by the Bureau of Labor Statistics showed the Colorado economy remains on solid footing.

The unemployment rate dropped from 6.2% a year ago to 4.0% this year. That sharp of a drop produces significant shock within the system, more so than when the change is more gradual.

With that sharp of decline, it becomes difficult to find workers in some occupations. That difficulty will be accentuated by a sense of urgency to find workers. As well, more industries will face upward wage pressures. That is good for workers, but will cut into the bottom line of companies.

The recent jobs data is another indicator the Colorado economy is continuing to grow at a steady pace. For all practical purposes, it is meaningless to talk about the December numbers. When BLS makes their annual revisions in March, it is likely the number of Colorado jobs will be revised upwards.

The U.S. economy is solid which bodes well for Colorado. New car sales have returned to pre-recession levels, real GDP will be stronger this year both globally and for the U.S., the U.S. should add more than 2.6 million jobs this year (and Colorado should be at least 2.7% of that total), government spending will be stronger, and purchasing managers in manufacturing and service companies are optimistic.

In Colorado, BLS data will show that the number of establishments increased at a greater rate than in 2013. If there are more businesses there are more potential job opportunities for workers.

In 2015 about 60% of job growth will be in construction; health care; accommodations and food services; retail trade; and professional and technical services.

Admittedly, the price of oil will have an effect on the rate of job growth in 2015; however, at a statewide level, most of the top sectors will show steady growth unless the price of oil stays low for an extended period.

The steady growth that is currently occurring in the Colorado economy is much easier to manage and deal with than the rapid growth the state experienced during the 1990s.

Measures of the Colorado Unemployment Rate

The Bureau of Labor Statistics compiles several measures of the Colorado unemployment rate. Each measure and its descriptions are listed below.  In each case, the  percentage has declined over the past year. The U-3 number is the headline number; however, many people think U-6 is more representative of the state of the economy because its definition is more inclusive.

Measures  of the Colorado Unemployment Rate Sept. 2013 Sept. 2014
U-1 Persons unemployed 15 weeks or longer, as a percent of the civilian labor force. 3.80%  2.80%
U-2 Job losers and persons who completed temporary jobs, as a percent of the civilian labor force. 3.70% 2.90%
U-3 Total unemployed, as a percent of the civilian labor force (headline unemployment rate). 7.20% 5.90%
U-4 Total unemployed plus discouraged workers, as a percent of the civilian labor force plus discouraged workers. 7.70% 6.40%
U-5 Total unemployed, plus discouraged workers, plus all other persons marginally attached to the labor force, as a percent of the civilian labor force plus all persons marginally attached to the labor force. 8.60% 7.30%
U-6 Total unemployed, plus all persons marginally attached to the labor force, plus total employed part-time for economic reasons, as a percent of the civilian labor force plus all persons marginally attached to the labor force. 13.60% 11.80%


Lackluster Wage Growth Continues

A lot has been written about the lack of significant U.S. wage growth since the end of the Great Recession. Quite frankly, the abundance of qualified workers looking for jobs has not incented companies to raise wages.

Since the end of the Great Recession in July 2009, the unemployment rate has fallen from 9.5% to 6.3%. In addition, the country has added 8.8 million jobs. This decline in the unemployment rate and the increase in the number of jobs has occurred at a painfully slow rate. As a result there has been minimal pressure to increase wages in many sectors.

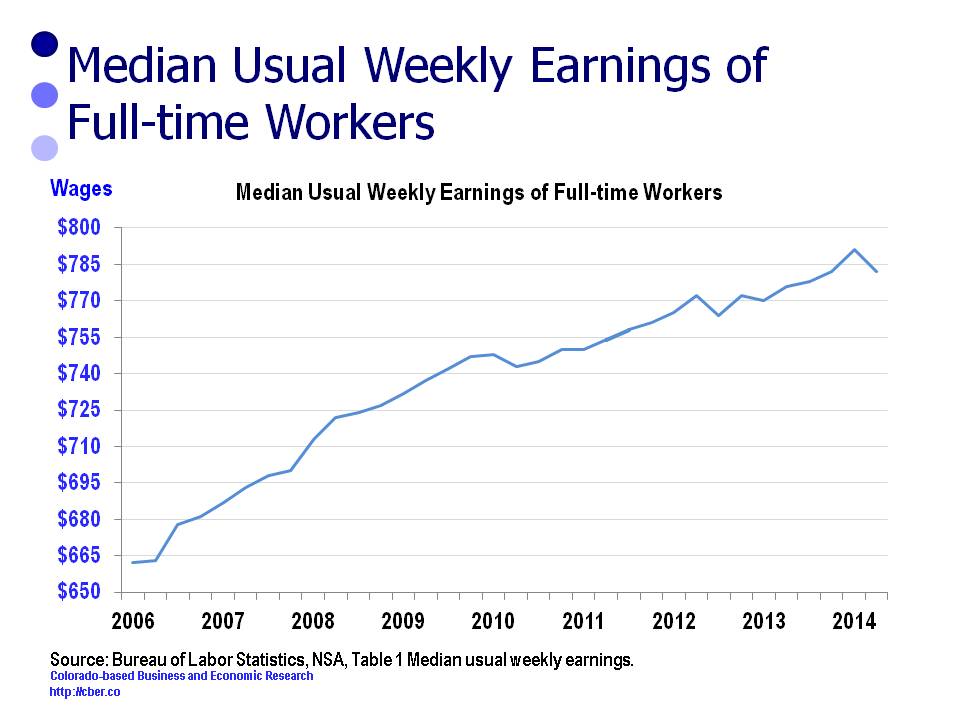
Median usual weekly earnings of the nation’s 106.6 million full-time wage and salary workers were $782 in Q2 2014 compared to $776 in Q2 2013. When inflation is accounted for (2.1% CPI), this wage rate represents a slight decline in wages.

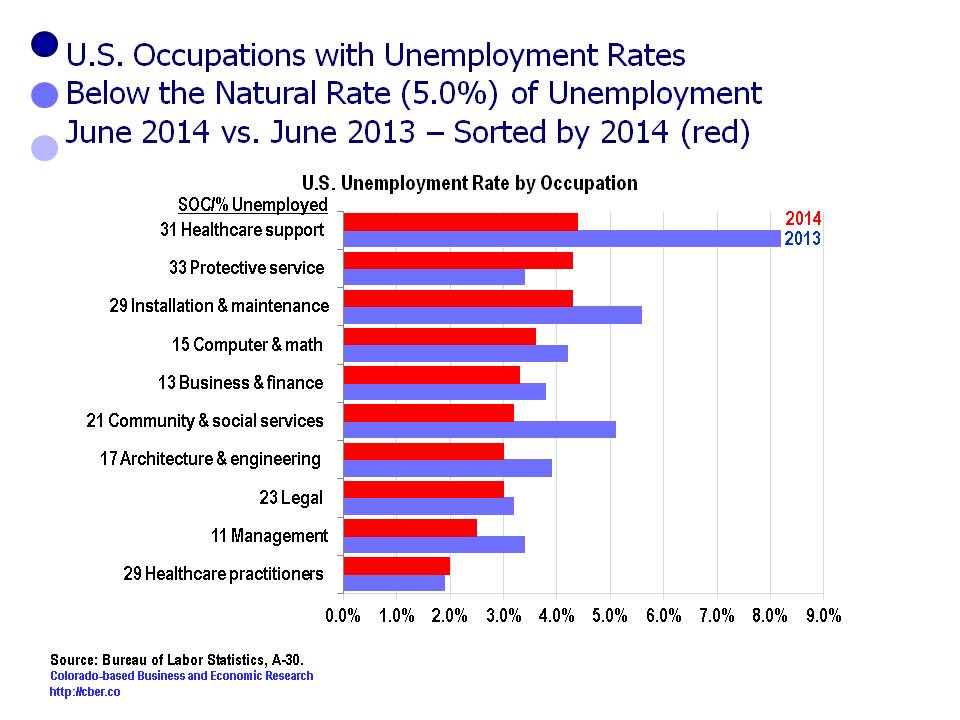
Ten of the 22 two-digit occupation codes have unemployment rates below 5.0%, including computer and math (15), architecture and engineering (17), management (11), business and finance (13) and healthcare practitioners (29). Eventually demand for workers in these occupations will drive increases in wages. As well, rapid growth in sectors such as the extractive industries will drive direct and indirect industry wage growth.

This is just another sign of how painful the recovery from the Great Recession has been for some Americans.

There has been a lack of significant wage growth


Declining Unemployment Rate Not Always a Good Sign

Generally, it is good news that the unemployment rate is trending downward, however, in some instances labor shortages are on the rise in some occupations.

There are 22 SOC (Standard Occupational Classification System) codes. Ten of these occupations have unemployment rates less than the natural rate of unemployment, which is assumed to be 5.0%. In addition, the unemployment rate has declined in 8 of the 10 categories.

There are about 1.7 million unemployed workers in occupations with unemployment rates below 5.0%, compared to 2.2 million a year ago. It is not possible to fill many of these occupations in a short period of time because they require a college degree.

The escalating labor shortages are often occurring in primary employers and advanced technology companies. At some point, companies will either lose business or be forced to offshore it if there isn’t a sufficient number of trained workers to meet their needs.

occupational unemployment rate less than 5%


U.S. Occupations with Low Unemployment Rates

The U.S. unemployment rate has finally dropped below 7.0%, yet there are occupations where the rate of unemployment is well below the natural rate. An unemployment rate of 4.5% to 5.5% is often referred to as the natural rate. (Milton Friedman and Edmund Phelps developed the concept of the natural rate in the 1960s to describe the rate of unemployment where the economy operates most efficiently.)

The occupations with the lowest unemployment rates are Healthcare practitioners, Computer, Legal, Education, and Math. Many of the 10 occupations require a college degree. On the other hand many of the occupations that have levels of unemployment above 5.0% have minimal education requirements or they require only on-the-job training. For example, a laid off construction worker may not have skills that are transferable to being a software developer. As a result some occupations, such as construction workers, may consistently have higher unemployment rates.

On a positive note, the unemployment rate has declined in 7 of the 10 categories. Interestingly enough, the number of unemployed workers in these 10 categories has increased from about 2.0 million to 3.0 million over the past year. Most likely that is a result of increased hiring, volatility in companies, and job churn.


©Copyright 2011 by CBER.

Year-End Colorado County Unemployment Rates for 2013 Range from 3.2% to 12.3%

The year-end 2013 state unemployment rates were recently released and Colorado posted a not-seasonally adjusted (NSA) rate of 5.9%.

The county unemployment rates were the lowest in:

  •  Yuma 3.2%
  •  Cheyenne 3.2%
  •  Kiowa 3.3%.

The metro counties with the lowest rates were:

  • Boulder 4.4%
  • Larimer 4.8%
  • Broomfield 5.3%

The county unemployment rates weret he highest in:

  •  Costilla 12.3%
  •  Saguache 10.3%
  • Huerfano 10.2%

The metro counties with the highest rates were:

  •  Pueblo 8.6%
  •  El Paso 7.2%
  •  Mesa 6.9%

 county unemployment rate

The NSA year-end county unemployment rates  are listed below.
 

County

%

County

%
Adams County 6.5   Kit Carson County 3.8
Alamosa County 7.0   La Plata County 4.7
Arapahoe County 5.7   Lake County 5.5
Archuleta County 7.0   Larimer County 4.8
Baca County 3.5   Las Animas County 9.0
Bent County 7.5   Lincoln County 4.0
Boulder County 4.4   Logan County 4.7
Broomfield County 5.3   Mesa County 6.9
Chaffee County 5.6   Mineral County 6.8
Cheyenne County 3.2   Moffat County 5.2
Clear Creek County 5.3   Montezuma County 7.0
Conejos County 9.3   Montrose County 8.5
Costilla County 12.3   Morgan County 5.2
Crowley County 9.6   Otero County 8.0
Custer County 6.6   Ouray County 4.9
Delta County 7.3   Park County 6.0
Denver County 6.2   Phillips County 4.0
Dolores County 6.4   Pitkin County 5.8
Douglas County 4.7   Prowers County 5.0
Eagle County 5.2   Pueblo County 8.6
El Paso County 7.2   Rio Blanco County 4.7
Elbert County 4.6   Rio Grande County 8.6
Fremont County 8.1   Routt County 4.5
Garfield County 5.8   Saguache County 10.3
Gilpin County 5.4   San Juan County 6.4
Grand County 4.6   San Miguel County 5.0
Gunnison County 5.5   Sedgwick County 4.1
Hinsdale County 3.4   Summit County 4.1
Huerfano County 10.2   Teller County 6.9
Jackson County 3.6   Washington County 4.0
Jefferson County 5.4   Weld County 6.1
Kiowa County 3.3   Yuma County 3.2

©Copyright 2011 by CBER.

cber.co Colorado Economic Forecast for 2014 – 68,000 to 74,000 Jobs to be Added

In 2013 the state experienced natural disasters and self-inflicted political wounds, yet Colorado employment grew at a faster than expected rate. The cber.co economic forecast points to continued expansion  for 2014.

On a Positive Note…

  • The state population grew at a higher rate than expected in 2013. Stronger growth is on tap for 2014.
  • The story is the same for employment. In 2013, the state added approximately 68,000 workers and will add another 68,000 to 74,000 in 2014. This represents job growth in the rage of 2.9% to 3.1%.
  • Unemployment will continue to decline, and will be in the range of 5.5% to 5.8% at the end of 2014.
  • In 2013 consumers were delighted that gasoline prices declined. At the moment there is no reason to believe they will rise precipitously (knock on wood).
  • Colorado new car registrations have risen steadily for the period 2010 to 2013. A decline is unlikely in 2014.
  • Colorado’s general fund, particularly sales and income taxes, has been a benefactor of increased population, employment, and wages. Likewise the revenue for city and county governments has improved.

Some Mixed News…

  • Per Capita Personal Income will increase by 3.7% in 2014.  This is slightly less than the rate of growth for the U.S. Over the past two decades the gap between the U.S. PCPI and the state PCPI has closed significantly.
  • In 2014, Colorado inflation will be 3.0%, well above the rate for the U.S.
  • In Colorado, housing prices have increased at a faster rate than the nation. That is great news for home owners, but not so good news for people wanting to enter the housing market.
  • The Construction Sector is slowly improving.  Increased building activity supports growth in multiple sectors and causes greater congestion on the highways. For some, the latter is not desirable.
  • Although the state returned to 2008 peak employment, it will be a long time before the state returns to the 2007 peak number of establishments.

Looking ahead, the economy will build on the foundation established in 2013. Hopefully the state’s leadership will be less dysfunctional.

Click here to review the cber.co forecast and other economic reports.

cber.co forecast

©Copyright 2011 by CBER.

Jobs and Output Data Point to Stronger Growth for Colorado

Earlier today, the Bureau of Labor Statistics released November jobs data for Colorado. As measured by increased jobs and decreased unemployment, the update showed the improvement in the economy is geographically broad-based. Most states are enjoying the recovery!

Specifically the highlights from the jobs data are:

  • Wage and salary employment increased in 43 states and decreased in 7 states and the District of Columbia.
  • Decreased unemployment rates were recorded in 42 states and the District of Columbia compared to a year ago, 1 state was flat and 7 states were higher. Nationally, November unemployment registered 7.0%, down 0.8 percentage points from a year ago.
  • In Colorado the November unemployment rate was down 1.1 percentage points from the same time last year (7.6% compared to 6.5%).

A stronger national economy bodes well for Colorado.

Earlier in the month the Bureau of Labor Statistics indicated its projection models had understated the rate of job growth in the state in 2013. Latest estimates project the state will actually add 60,000 to 65,000 jobs this year.

More good news came today when the Bureau of Economic Analysis revised Q3 GDP upward to 4.1%. Exports and business and consumer spending were stronger than anticipated.

The stronger jobs and output data suggest the impacts of sequestration, the partial government shutdown, and the fallout from the earlier budget and debt ceiling debates may have had less of a net impact than originally thought.

For the first time in 6 or 7 years, Colorado and the U.S. will be entering a new year with a solid foundation for growth. If that foundation remains in place, there is reason to believe that Colorado will add at least 65,000 jobs in 2014.

©Copyright 2011 by CBER.