Top Output Categories for Colorado

The following list identifies the top output categories for Colorado. The list has been extracted from an IMPLAN database, www.implan.com. This database divides output and employment  into  440 categories.

IMPLAN is an economic analysis tool that uses input-output analysis in combination with regional specific Social Accounting Matrices and Multiplier Models.

This list provides insight into the industries that drive the Colorado economy. As can be seen finance is a major contributor to the state’s output. Other key categories are food services, extractive industries, construction, government, health care, and advanced technology.

Top Output Categories for Colorado Based on IMPLAN Data

Rank Industry Code Description Output Percent Cumulative Percent
1 360 Real estate establishments $25,472,296,875 5.2% 5.2%
2 361 Imputed rental activity for owner-occupied dwellings $22,888,701,172 4.7% 9.9%
3 319 Wholesale trade businesses $22,869,310,547 4.7% 14.6%
4 351 Telecommunications $20,428,070,313 4.2% 18.8%
5 413 Food services and drinking places $12,926,014,648 2.6% 21.4%
6 438 * Employment and payroll only (state & local govt, education) $11,658,043,945 2.4% 23.8%
7 354 Monetary authorities and depository credit intermediation activities $11,587,137,695 2.4% 26.2%
8 20 Extraction of oil and natural gas $11,270,791,992 2.3% 28.5%
9 356 Securities, commodity contracts, investments, and related activities $10,981,884,766 2.2% 30.7%
10 394 Offices of physicians, dentists, and other health practitioners $9,923,915,039 2.0% 32.8%
11 440 * Employment and payroll only (federal govt, military) $9,475,095,703 1.9% 34.7%
12 381 Management of companies and enterprises $9,202,613,281 1.9% 36.6%
13 437 * Employment and payroll only (state & local govt, non-education) $9,006,702,148 1.8% 38.4%
14 357 Insurance carriers $8,479,899,414 1.7% 40.2%
15 36 Construction of other new nonresidential structures $8,137,076,660 1.7% 41.8%
16 397 Private hospitals $7,912,281,250 1.6% 43.5%
17 369 Architectural, engineering, and related services $7,906,128,906 1.6% 45.1%
18 345 Software publishers $7,026,037,598 1.4% 46.5%
19 31 Electric power generation, transmission, and distribution $5,340,330,078 1.1% 47.6%
20 366 Lessors of nonfinancial intangible assets $5,337,109,375 1.1% 48.7%
21 439 * Employment and payroll only (federal govt, non-military) $5,274,785,156 1.1% 49.8%
22 371 Custom computer programming services $5,234,539,063 1.1% 50.9%
23 359 Funds, trusts, and other financial vehicles $5,130,132,813 1.1% 51.9%
24 115 Petroleum refineries $4,738,690,430 1.0% 52.9%
25 367 Legal services $4,462,339,844 0.9% 53.8%
Other $225,686,144,106 46.2% 100.0%

Total output for the model was $488,356,072,817 and employment was 3,235,493. These 25 categories account for 46.4% of employment and 53.8% of output for the state.
Industry Codes with Leading Output per Employee for Colorado

The following list identifies the leading output per employee categories for Colorado. The list has been extracted from an IMPLAN database, www.implan.com. This database divides output and employment into 440 categories.

IMPLAN is an economic analysis tool that uses input-output analysis in combination with regional specific Social Accounting Matrices and Multiplier Models.

Total output for the model is $488,356,072,817 and employment is 3,235,493. Overall output per employee is $150,937.

There were at least 1,000 workers for each of the top 35 categories. A minimum of 1,000 workers was set because many small categories have a high output per employee that may not be sustainable if they were larger. Characteristics of this group of companies are:
• The range of output per worker is $322,539 to $3,206,588.
• Average output per employee is $562,606.
• Total employment is 190,042. This is 5.9% of the state total.
• Total output was $106,918,935,715. This is 21.9% of the state total.
Most of these categories include companies that provide primary jobs. They are mostly manufacturing or advance technology companies.

There were 132 categories with average output per employee greater than $322,539. Each of these categories had fewer than 1,000 workers.
• Total employment is 34,786. This is 1.1% of the state total.
• Total output was $47,425,590,085. This is 9.7% of the state total.
• Average output per employee is $1,363,337.20.
As was the case with the above category, most of these categories include companies that provide primary jobs.

Finally, there were 238 categories with average output per employee less than $322,539.
• Total employment is 3,010,664. This is 93.0% of the state total.
• Total output is $334,011,547,017. This is 68.4% of the state total.
• Average output per employee is $110,943.
This group provides a wide variety of companies and industries. Many of the categories with lower output per employee are retail operations or personal or business services. They are important to society for a variety of reasons, but they are drivers of the economy.

There were 35 categories with no employment or output.

Industry Codes with Leading Output per Employee for Colorado

Rank IndustryCode Description Employment Output/Employee % of State Average
1 366 Lessors of nonfinancial intangible assets 1,664 $3,206,588 2,124%
2 234 Electronic computer manufacturing 1,189 $1,485,686 984%
3 55 Fluid milk and butter manufacturing 1,157 $1,430,300 948%
4 32 Natural gas distribution 1,099 $1,363,518 903%
5 133 Pharmaceutical preparation manufacturing 2,156 $1,347,071 892%
6 235 Computer storage device manufacturing 2,049 $1,174,215 778%
7 170 Iron and steel mills and ferroalloy manufacturing 1,518 $1,144,157 758%
8 243 Semiconductor and related device manufacturing 3,176 $1,078,421 714%
9 71 Breweries 3,651 $1,048,101 694%
10 225 Other engine equipment manufacturing 1,673 $920,406 610%
11 31 Electric power generation, transmission, and distribution 6,651 $802,901 532%
12 349 Cable and other subscription programming 3,596 $791,950 525%
13 28 Drilling oil and gas wells 2,823 $768,501 509%
14 70 Soft drink and ice manufacturing 1,956 $736,120 488%
15 190 Metal can, box, and other metal container (light gauge) manufacturing 1,052 $680,582 451%
16 351 Telecommunications 30,489 $670,023 444%
17 24 Mining gold, silver, and other metal ore 2,377 $585,851 388%
18 236 Computer terminals and other computer peripheral equipment manufacturing 1,769 $541,175 359%
19 345 Software publishers 14,165 $496,019 329%
20 283 Motor vehicle parts manufacturing 1,098 $483,561 320%
21 249 Search, detection, and navigation instruments manufacturing 2,520 $481,246 319%
22 248 Electromedical and electrotherapeutic apparatus manufacturing 3,307 $460,979 305%
23 222 Turbine and turbine generator set units manufacturing 1,214 $437,374 290%
24 333 Transport by rail 2,877 $432,021 286%
25 253 Electricity and signal testing instruments manufacturing 1,364 $429,077 284%
26 287 Guided missile and space vehicle manufacturing 6,128 $426,830 283%
27 158 Glass container manufacturing 465 $405,217 268%
28 254 Analytical laboratory instrument manufacturing 1,109 $388,003 257%
29 354 Monetary authorities and depository credit intermediation activities 31,465 $368,257 244%
30 10 All other crop farming 4,425 $361,804 240%
31 251 Industrial process variable instruments manufacturing 1,094 $347,713 230%
32 20 Extraction of oil and natural gas 34,047 $331,039 219%
33 352 Data processing, hosting, ISP, web search portals and related services 8,766 $328,557 218%
34 343 Book publishers 1,133 $325,470 216%
35 305 Surgical and medical instrument, laboratory and medical instrument manufacturing 4,819 $322,539 214%
Other 3,045,450 $125,248 83%
Total 3,235,493 $150,397

U.S. and Colorado Economy Remain Solid

National Economy
The U.S. economy remains strong, with solid employment and output growth.

• Nationally, employment remains strong, despite slower than expected job growth in August. The non-seasonally adjusted data shows that an average of 215,000 jobs has been added each month through eight months. This means the U.S. will add about 2.5 million jobs this year.
• Output remains solid. The first Q2 estimate showed real GDP growth of 4.0%. That was revised upwards to 4.2%. It is possible the third estimate, due later this month, could be revised even higher to 5.0%.
• At the most recent FOMC meeting the Federal Reserve provided no surprises. Their stance on the economy indicates:
o The rate of inflation remains below target.
o Quantitative easing will come to an end.
o There is slack in the labor market.
o Interest rates will remain low in the near term; however, once rate increases begin they will accelerate faster than previously anticipated. It is likely rates will begin increasing in mid-2015.
• The outlook for construction is positive.  Single family building permits have been flat; however the NAHB index shows that homebuilder sentiment is much stronger than the permits data. This suggests greater activity, and stronger data, will occur in the future.
• The unemployment rate, number of unemployed, and the number of Americans filing new claims for unemployment benefits continue on a downward trend. The economy should remain healthy as long as fewer people are unemployed and an increasing number of Americans are working.

Colorado Economy

The performance of the Colorado economy is closely tied to changes in U.S. job and output growth. Since the end of the recession Colorado job growth has outperformed the U.S. because of its mix of industries. The state is on track to add jobs at an accelerated rate for the fourth consecutive year.  Job growth this year will be about 3.0%.

• The extractive industries have been a major direct and indirect contributor to the job growth. As well, the extractive industries were responsible for about one-third of the state’s GDP growth in 2013. The extractive industries are important to the economies of about half the counties in the state. From a jobs perspective, the sector is small, but the number of workers will increase by at least 9% this year compared to 2013.
• So far this year, between 10% and 12% of the jobs added in Colorado are construction jobs. The number of jobs will increase by at least 6.5% compared to the same period last year. Growth in the sector might be constrained by a lack of trained workers in specialized construction occupations such as plumbers, HVAC workers, and electricians. The home and infrastructure subsectors also include distinct specialized occupations.
• Tourism has enjoyed a banner year in Colorado. It began with good snow and a strong ski season. The good snow season also meant plenty of water for mountain rafting and summer tourism activities. Special events, such as the USA Pro Challenge, and the lack of fires and flooding provided the foundation for a strong summer season. Leisure and hospitality job growth is poised to be at least 4.6% greater in 2014 than last year. The sector will be responsible for adding about 19% of the jobs in the state this year.  The sector plays a significant part of the economy in all 64 counties.
• The healthcare sector will add more than 10,000 workers in 2014 and expand at a rate of more than 4.3%. The sector continues to face challenges finding workers in many occupations and in rural areas.
• The growth of the professional, scientific, and technical sector is important to the state because a portion of these companies are directly or indirectly a part of the state’s advanced technology sector. The lifestyle of Downtown Denver and Colorado is attracting millennials to jobs in these sectors. The growth of in the sector will be at a rate of about 4.5% in 2014. It is important to note that many of these occupations pay higher than average wages and the sector is adding jobs at an increasing rate.


Colorado Outperforms U.S. in Real GDP Growth

Today the Bureau of Economic Analysis released its updated real GDP data by state for 2013. There were increases in 49 of the 50 states, with Alaska being the one state showing a decline.

In 2013 U.S. Real GDP growth expanded at a rate of 1.8%, compared to 2.5% in 2012. Private sector growth grew by 2.3% in 2013 compared to 3.0% in 2012.

In short, Colorado outperformed the U.S. in output growth last year. While the rate for the U.S. declined, real GDP growth for Colorado increased.

Nationally, the top six contributors to absolute growth were:

• Real estate and rental and leasing
• Agriculture, forestry, fishing, and hunting
• Health care and social assistance
• Finance and insurance
• Wholesale trade
• Professional, scientific, and technical services.

Combined, these 6 categories accounted for 53.6% of the change in U.S. output in 2013.

The Colorado Real GDP growth increased from 3.0% in 2012 to 3.8% in 2013. Real private sector growth expanded at a rate of 4.2% in 2013 compared to 3.4% in 2012.

In Colorado the leading contributors to absolute growth were:
• Mining
• Real estate and rental and leasing
• Professional, scientific, and technical services
• Agriculture, forestry, fishing, and hunting
• Construction
• Government.

Combined these six sectors accounted for 75% of the change in Colorado output in 2013.

There is a significant difference between the composition of the top contributors for the U.S. and Colorado. In part this helps explain why the Colorado economy has outperformed the U.S. economy over the past five years.

Note: There is a slight difference between the national GDP and the national GDP calculated as a summary by state outputs. Details are explained on the BEA website. Also, for methodological reasons, the contributions to absolute growth were calculated using the nominal GDP data.

Colorado’s Manufacturing Output Similar to Arizona, Kansas, and Utah

Manufacturing is important to the Colorado economy because it is a primary job creator – it brings in investment from outside the state, it creates jobs with higher than average wages, and the industry often has a deeper local supply chain than other industries. In 2012, the most current data available, Colorado manufacturing output totaled $19.99 billion and was 8.4% of private sector output (BEA).

Colorado is proud to have manufacturing competencies in some high-tech areas and food and beverage and state economic development officials have focused their support on the select sectors where they have strength or potential strength.

In 2012, Colorado was ranked 29th for total manufacturing output. States with similar levels of output include Arizona, Kansas, Utah, Maryland, and Oklahoma.


State Output (millions) Percent Cumulative Percent
California $213,257 11.4% 11.4%
Texas $210,968 11.3% 22.7%
Illinois $92,383 4.9% 27.7%
North Carolina $88,252 4.7% 32.4%
Ohio $87,174 4.7% 37.1%
Indiana $84,150 4.5% 41.6%
Pennsylvania $70,634 3.8% 45.4%
Michigan $66,230 3.5% 48.9%
New York $63,088 3.4% 52.3%
Oregon $55,158 3.0% 55.2%
Louisiana $55,097 3.0% 58.2%
Wisconsin $49,981 2.7% 60.9%
Georgia $48,599 2.6% 63.5%
Washington $46,507 2.5% 66.0%
Massachusetts $41,629 2.2% 68.2%
Tennessee $41,411 2.2% 70.4%
Minnesota $40,441 2.2% 72.6%
Virginia $40,116 2.1% 74.7%
New Jersey $38,199 2.0% 76.8%
Florida $37,023 2.0% 78.8%
Missouri $32,275 1.7% 80.5%
Alabama $30,001 1.6% 82.1%
Kentucky $29,746 1.6% 83.7%
South Carolina $28,708 1.5% 85.2%
Iowa $25,406 1.4% 86.6%
Connecticut $24,079 1.3% 87.9%
Arizona $21,934 1.2% 89.1%
Kansas $20,503 1.1% 90.2%
Colorado $19,992 1.1% 91.2%
Utah $19,184 1.0% 92.3%
Maryland $18,657 1.0% 93.3%
Oklahoma $17,497 0.9% 94.2%
Arkansas $15,604 0.8% 95.0%
Mississippi $15,254 0.8% 95.8%
Nebraska $12,484 0.7% 96.5%
New Hampshire $7,657 0.4% 96.9%
Idaho $7,556 0.4% 97.3%
West Virginia $6,223 0.3% 97.7%
New Mexico $5,805 0.3% 98.0%
Nevada $5,504 0.3% 98.3%
Maine $5,497 0.3% 98.6%
Delaware $4,393 0.2% 98.8%
South Dakota $4,008 0.2% 99.0%
Rhode Island $3,919 0.2% 99.2%
Vermont $3,150 0.2% 99.4%
North Dakota $3,037 0.2% 99.6%
Montana $2,860 0.2% 99.7%
Wyoming $2,269 0.1% 99.8%
Alaska $1,671 0.1% 99.9%
Hawaii $1,274 0.1% 100.0%
District of Columbia $256 0.0% 100.0%
Total $1,866,700 100.0%

Colorado in Bottom Third of States for Output Manufacturing Location Quotient

Manufacturing is critical to the state of Colorado; however, the state’s manufacturing output lags other states.

One way to evaluate the Bureau of Economic Analysis state output data is to compare the industry specialization index or the location quotient (LQ) to show which states have a higher concentration of manufacturing relative to the other industries. A LQ > 100.0 means there is a higher concentration and a L.0  < 100.0 means there is a lower concentration.

In the first group of states (17 states) the manufacturing sector has a LQ is greater than 118.0. In other words, manufacturing is a significant export industry for these states.

Rank State LQ
1 Indiana 234.98
2 Oregon 231.48
3 Louisiana 188.87
4 North Carolina 161.40
5 Wisconsin 159.35
6 Kentucky 142.99
7 Ohio 142.70
8 Iowa 138.98
9 Michigan 137.90
10 Alabama 136.30
11 South Carolina 135.85
12 Texas 125.90
13 Mississippi 125.33
14 Tennessee 124.65
15 Kansas 123.04
16 Utah 122.60
17 Arkansas 118.77

In the second group of states (15 states) the LQ is greater than 85.0 and less than 115.0. In these states manufacturing is an important industry. Because Minnesota, Illinois, and Idaho have LQs greater than 110.0 it is likely that manufacturing is a significant export industry.

Rank State LQ
18 Minnesota 114.42
19 Illinois 110.81
20 Idaho 108.18
21 Nebraska 104.57
22 Missouri 103.98
23 Washington 103.22
24 New Hampshire 98.69
25 Pennsylvania 98.02
26 Vermont 96.23
27 Georgia 93.47
28 Oklahoma 90.65
29 California 88.76
30 Connecticut 87.56
31 Massachusetts 85.96
32 Maine 85.43

The LQ for the final group of states (18 states + District of Columbia) is less than 85.0. In these states manufacturing may be an important part of the economy and there may be pockets where there are high concentrations of exports. Manufacturing does not drive the fortunes of the state in the same way it does in the states with higher LQs.

Colorado is a perfect example. Manufacturing has a LQ of 60.1 and the industry accounts for 8.4% of private sector output. The state has competencies in food and beverage and computer and other high-tech manufacturing. By contrast, Oregon has substantially fewer manufacturing workers and appreciably greater manufacturing output. (The Portland-Vancouver MSA manufacturing output is $47.3 billion vs. almost $20 billion for the entire state of Colorado). In Oregon manufacturing accounted for 31.3% of total private sector GDP in 2012.

Rank State LQ
33 South Dakota 78.71
34 Virginia 75.03
35 West Virginia 74.79
36 Arizona 68.53
37 Rhode Island 64.13
38 New Jersey 62.70
39 Colorado 60.83
40 New Mexico 60.06
41 Montana 59.00
42 Delaware 55.52
43 North Dakota 55.04
44 Wyoming 49.24
45 Maryland 48.97
46 New York 43.62
47 Florida 39.72
48 Nevada 34.36
49 Alaska 26.87
50 Hawaii 14.67
51 District of Columbia 1.94

Strong Colorado Manufacturing Output is Essential to Growth of Colorado

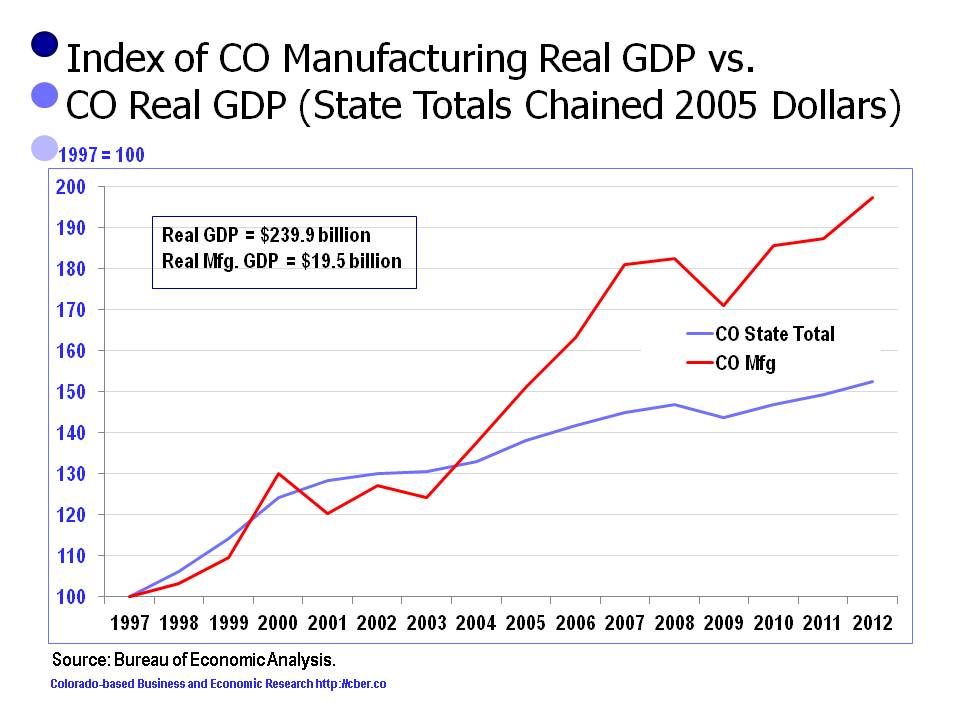
For the period 1997 to 2012, Colorado Real GDP expanded on a more consistent basis than the Colorado manufacturing output. In other words, overall output growth was less volatile.

However; manufacturing Real GDP grew at an annualized rate of 4.6% compared to 2.9% for Real GDP. The faster rate of growth for Colorado occurred, in part, because the manufacturing sector expanded off a much smaller base. Also, a portion of Colorado manufacturing is high value goods, such as electronics.

For this period, total employment increased as an annualized rate of 1.0% and manufacturing declined at an annualized rate of 2.3%. It is clear that gains in output were made as a result of capital expenditures, rather than investment in labor.

Note: At the time of this writing, the 2012 data was the most current data available.

Colorado Manufacturing Output
Growth of Colorado manufacturing output has outpaced growth of state output.


Output Projections for Global Economy Show Improvement

The global economy is poised for a turn-around in 2014, with stronger growth in most regions. At this time a year ago most output projections for 2013 pointed to lower growth rates than 2012. Today, both the Conference Board -TCB- and the International Monetary Fund -IMF- are optimistic about the global economy in 2014 – truly a pleasant change.

Part of the good news is that the optimistic projections are broad-based and the most notable improvements are in the U.S. and Europe economies.

TCB ouput projections for 2013 vs. 2014 are:

  • Global                  2.8% vs. 3.1%
  • Mature                 1.0% vs. 1.7%
  • Emerging             4.7% vs. 4.6%

IMF output projections for 2013 vs. 2014 are:

  • Global                  2.9% vs. 3.6%
  • Mature                 1.2% vs. 2.0%
  • Emerging             4.5% vs. 5.1%

The IMF is slightly more optimistic than TCB, particularly with its output projections for the emerging countries. Let’s hope they are correct.
output projections

©Copyright 2011 by CBER.

Agriculture Output Trended Downward 2009 to 2012 – Will There Be a Turn Around in 2013

Real Agriculture output peaked in 2009 for both Colorado and the U.S. and it has trended downward for the period 2009 to 2012.

Between 1997 and 2012, the Bureau of Economic Analysis statistics show:

  • The annualized rate of growth for U.S. Private Sector Real GDP (sum of all states) was 2.3% and the U.S. Agriculture sector increased annually at a rate of 1.7%.
  • The compound growth rate for Colorado Private Sector Real GDP was 3.1%. The Colorado Agriculture sector increased annually at a rate of 1.5%.

Although Colorado private sector output expanded at a significantly faster rate than the U.S.between 1997 and 2012, Agriculture output for the state grew at a slightly slower rate.

Between 2009 and 2012, the data shows:

  • The annualized rate of growth for U.S. Private Sector Real GDP (sum of all states) was 2.5% and the U.S. Agriculture sector decreased at an annualized rate of -6.9%.
  • The compound growth rate for Colorado Private Sector Real GDP was 2.2%. The Colorado Agriculture sector declined annually at a rate of 11.7%.

Farmers and ranchers have their fingers crossed that the downward trend will be reversed in 2013.

©Copyright 2011 by CBER.

Construction Output Declined for Eleven Years – Reversed in 2012

Real GDP for the Construction sector finally rebounded in 2012, after decreasing for eleven years, 2001 to 2011.

Between 1997 and 2012, the Bureau of Economic Analysis statistics show:

  • The annualized rate of growth for U.S. Private Sector Real GDP (sum of all states) was 2.3% and the U.S. Construction sector declined annually at a rate of -1.5%.
  • The compound growth rate for Colorado Private Sector Real GDP was 3.1%. The Colorado Construction sector declined annually at a rate of -2.4%.

For this period, the Colorado Construction sector was hit much harder than the U.S. In addition, the recovery was much slower for Colorado.

Between 2009 and 2012, the data shows:

  • The annualized rate of growth for U.S. Private Sector Real GDP (sum of all states) was 2.5% and the U.S. Construction sector increased at an annualized rate of 0.5%.
  • The compound growth rate for Colorado Private Sector Real GDP was 2.2%. The Colorado Construction sector declined annually at a rate of -1.4%.

Preliminary data suggests that 2013 Colorado Construction output will again be positive and that it will be stronger than the nation.


©Copyright 2011 by CBER.