Colorado Manufacturing Could be Stronger

The Manufacturing Sector is critical to the Colorado economy because it is a source of primary jobs that pay higher than average wages. In addition, manufacturers bring in revenue from outside the state that is spent in Colorado and they export goods to domestic and international destinations.

In 1990, manufacturers accounted for 11.3% of total state employment. In 2014, only 5.6% of Colorado’s employees were in the manufacturing sector. Around 2000 the number of manufacturing workers in Colorado and across the U.S. declined as companies outsourced and off shored. As well, the back-to-back recessions in the 2000s forced manufacturers to become more efficient. They accomplished this by investing in capital expenditures rather than labor.

Compared to most other parts of the country, Colorado has never been a strong manufacturing state. It is the proud home to world-class manufacturers such as Ball Aerospace, Miller Coors, and Leprino Foods. Most manufacturers are small businesses that produce everything from tacos to optical mirrors.

The state’s manufacturing sector is concentrated in pockets along the Front Range:
• Boulder County is at the forefront for its high tech manufacturers.
• Weld and Pueblo Counties are strong in renewable energy. Vestas has been a significant source of manufacturing job growth over the past decade. In addition, Weld County is home to various ag-based manufacturers.
• A majority of the state’s manufacturers are located in Denver.

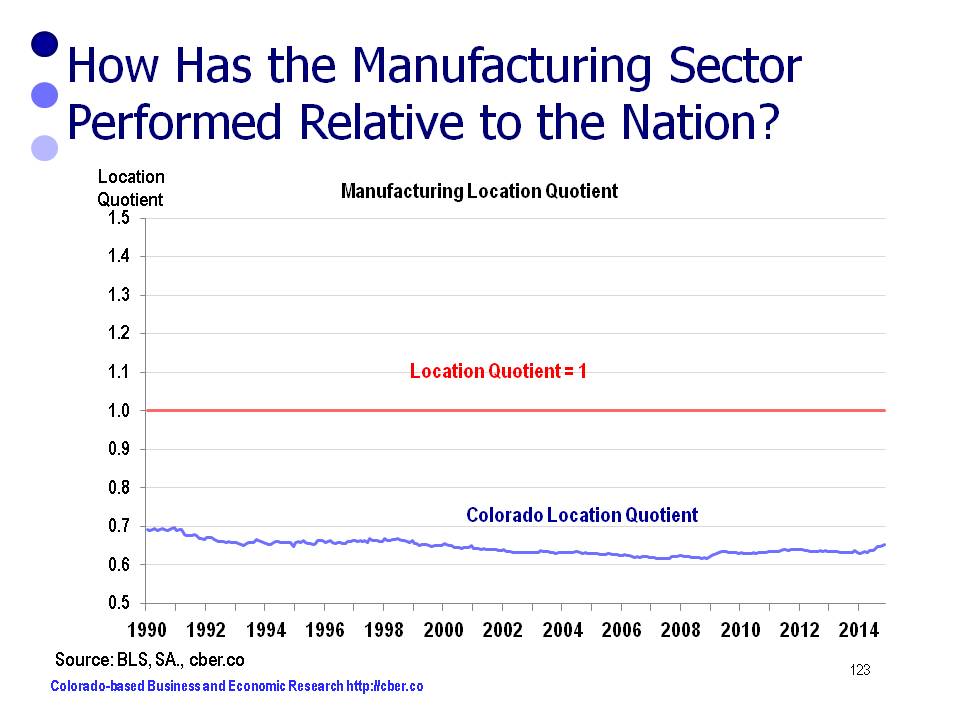
The location quotient for all wage and salary manufacturing workers, or the concentration relative to other industries, is well below 1.0. It trended downward from 1990 to 2001, but has been relatively flat since then.

Here’s to growth for the Colorado manufacturing sector in years to come.

colorado manufacturing

Colorado’s Manufacturing Output Similar to Arizona, Kansas, and Utah

Manufacturing is important to the Colorado economy because it is a primary job creator – it brings in investment from outside the state, it creates jobs with higher than average wages, and the industry often has a deeper local supply chain than other industries. In 2012, the most current data available, Colorado manufacturing output totaled $19.99 billion and was 8.4% of private sector output (BEA).

Colorado is proud to have manufacturing competencies in some high-tech areas and food and beverage and state economic development officials have focused their support on the select sectors where they have strength or potential strength.

In 2012, Colorado was ranked 29th for total manufacturing output. States with similar levels of output include Arizona, Kansas, Utah, Maryland, and Oklahoma.


State Output (millions) Percent Cumulative Percent
California $213,257 11.4% 11.4%
Texas $210,968 11.3% 22.7%
Illinois $92,383 4.9% 27.7%
North Carolina $88,252 4.7% 32.4%
Ohio $87,174 4.7% 37.1%
Indiana $84,150 4.5% 41.6%
Pennsylvania $70,634 3.8% 45.4%
Michigan $66,230 3.5% 48.9%
New York $63,088 3.4% 52.3%
Oregon $55,158 3.0% 55.2%
Louisiana $55,097 3.0% 58.2%
Wisconsin $49,981 2.7% 60.9%
Georgia $48,599 2.6% 63.5%
Washington $46,507 2.5% 66.0%
Massachusetts $41,629 2.2% 68.2%
Tennessee $41,411 2.2% 70.4%
Minnesota $40,441 2.2% 72.6%
Virginia $40,116 2.1% 74.7%
New Jersey $38,199 2.0% 76.8%
Florida $37,023 2.0% 78.8%
Missouri $32,275 1.7% 80.5%
Alabama $30,001 1.6% 82.1%
Kentucky $29,746 1.6% 83.7%
South Carolina $28,708 1.5% 85.2%
Iowa $25,406 1.4% 86.6%
Connecticut $24,079 1.3% 87.9%
Arizona $21,934 1.2% 89.1%
Kansas $20,503 1.1% 90.2%
Colorado $19,992 1.1% 91.2%
Utah $19,184 1.0% 92.3%
Maryland $18,657 1.0% 93.3%
Oklahoma $17,497 0.9% 94.2%
Arkansas $15,604 0.8% 95.0%
Mississippi $15,254 0.8% 95.8%
Nebraska $12,484 0.7% 96.5%
New Hampshire $7,657 0.4% 96.9%
Idaho $7,556 0.4% 97.3%
West Virginia $6,223 0.3% 97.7%
New Mexico $5,805 0.3% 98.0%
Nevada $5,504 0.3% 98.3%
Maine $5,497 0.3% 98.6%
Delaware $4,393 0.2% 98.8%
South Dakota $4,008 0.2% 99.0%
Rhode Island $3,919 0.2% 99.2%
Vermont $3,150 0.2% 99.4%
North Dakota $3,037 0.2% 99.6%
Montana $2,860 0.2% 99.7%
Wyoming $2,269 0.1% 99.8%
Alaska $1,671 0.1% 99.9%
Hawaii $1,274 0.1% 100.0%
District of Columbia $256 0.0% 100.0%
Total $1,866,700 100.0%

Colorado in Bottom Third of States for Output Manufacturing Location Quotient

Manufacturing is critical to the state of Colorado; however, the state’s manufacturing output lags other states.

One way to evaluate the Bureau of Economic Analysis state output data is to compare the industry specialization index or the location quotient (LQ) to show which states have a higher concentration of manufacturing relative to the other industries. A LQ > 100.0 means there is a higher concentration and a L.0  < 100.0 means there is a lower concentration.

In the first group of states (17 states) the manufacturing sector has a LQ is greater than 118.0. In other words, manufacturing is a significant export industry for these states.

Rank State LQ
1 Indiana 234.98
2 Oregon 231.48
3 Louisiana 188.87
4 North Carolina 161.40
5 Wisconsin 159.35
6 Kentucky 142.99
7 Ohio 142.70
8 Iowa 138.98
9 Michigan 137.90
10 Alabama 136.30
11 South Carolina 135.85
12 Texas 125.90
13 Mississippi 125.33
14 Tennessee 124.65
15 Kansas 123.04
16 Utah 122.60
17 Arkansas 118.77

In the second group of states (15 states) the LQ is greater than 85.0 and less than 115.0. In these states manufacturing is an important industry. Because Minnesota, Illinois, and Idaho have LQs greater than 110.0 it is likely that manufacturing is a significant export industry.

Rank State LQ
18 Minnesota 114.42
19 Illinois 110.81
20 Idaho 108.18
21 Nebraska 104.57
22 Missouri 103.98
23 Washington 103.22
24 New Hampshire 98.69
25 Pennsylvania 98.02
26 Vermont 96.23
27 Georgia 93.47
28 Oklahoma 90.65
29 California 88.76
30 Connecticut 87.56
31 Massachusetts 85.96
32 Maine 85.43

The LQ for the final group of states (18 states + District of Columbia) is less than 85.0. In these states manufacturing may be an important part of the economy and there may be pockets where there are high concentrations of exports. Manufacturing does not drive the fortunes of the state in the same way it does in the states with higher LQs.

Colorado is a perfect example. Manufacturing has a LQ of 60.1 and the industry accounts for 8.4% of private sector output. The state has competencies in food and beverage and computer and other high-tech manufacturing. By contrast, Oregon has substantially fewer manufacturing workers and appreciably greater manufacturing output. (The Portland-Vancouver MSA manufacturing output is $47.3 billion vs. almost $20 billion for the entire state of Colorado). In Oregon manufacturing accounted for 31.3% of total private sector GDP in 2012.

Rank State LQ
33 South Dakota 78.71
34 Virginia 75.03
35 West Virginia 74.79
36 Arizona 68.53
37 Rhode Island 64.13
38 New Jersey 62.70
39 Colorado 60.83
40 New Mexico 60.06
41 Montana 59.00
42 Delaware 55.52
43 North Dakota 55.04
44 Wyoming 49.24
45 Maryland 48.97
46 New York 43.62
47 Florida 39.72
48 Nevada 34.36
49 Alaska 26.87
50 Hawaii 14.67
51 District of Columbia 1.94

Colorado Manufacturing Employment Stronger than U.S.

Since 1990 Colorado manufacturing employment has fared better than U.S. manufacturing employment. This has occurred in part because Colorado has grown off a much smaller base. Also the mix of companies in Colorado has not included some of the industries, such as textiles, that were hit hardest by outsourcing.

Colorado’s strength in manufacturing is beverages such as Coors/Miller and Budweiser. As well, the state has competencies in select high-tech sectors.

The bad news for Colorado is that the industry’s location quotient, or concentration, is well below 1.0 and trending downward.  In other words, Colorado has a lower concentration of manufacturers than the U.S.

U.S. vs. Colorado Manufacturing Employment
U.S. vs. Colorado Manufacturing Employment.


Strong Colorado Manufacturing Output is Essential to Growth of Colorado

For the period 1997 to 2012, Colorado Real GDP expanded on a more consistent basis than the Colorado manufacturing output. In other words, overall output growth was less volatile.

However; manufacturing Real GDP grew at an annualized rate of 4.6% compared to 2.9% for Real GDP. The faster rate of growth for Colorado occurred, in part, because the manufacturing sector expanded off a much smaller base. Also, a portion of Colorado manufacturing is high value goods, such as electronics.

For this period, total employment increased as an annualized rate of 1.0% and manufacturing declined at an annualized rate of 2.3%. It is clear that gains in output were made as a result of capital expenditures, rather than investment in labor.

Note: At the time of this writing, the 2012 data was the most current data available.

Colorado Manufacturing Output
Growth of Colorado manufacturing output has outpaced growth of state output.


Colorado’s Concentration of Manufacturing is Lower than the U.S.

Colorado manufacturers produce coffee (Boyer’s Coffee) and beer (Coors). These types of products are classified as nondurable goods. Durable goods products include satellites (Ball Aerospace), air safety devices (Particle Measuring Systems), or ice making machines (Ice-O-Matic).

Many manufacturers create primary jobs – that is an economic development term. Many primary job creators pay higher than average wages. In addition, they attract outside investment to our local communities. In other words, their products are exported outside the state. As well, they often have higher “multiplier” effects. In non-economic terms that means they have a local supply chain.

The concentration, or location quotient (LQ), for Colorado manufacturing was .65 in 2012 (calculated using the most recent QCEW data). In other words, Colorado has a much lower concentration of manufacturers than the U.S.

The majority of manufacturers are located in the Denver MSA; however, Northern Colorado and Boulder have the highest concentration of manufacturing employees.

Greeley and Boulder are the only MSAs with a concentration of manufacturing greater than 1.0.
Greeley and Boulder are the only MSAs with manufacturing location quotients greater than 1.0.

Manufacturing Role in U.S. Recovery May be Overstated

The Manufacturing Sector has been regarded as a driving force in the recovery from the Great Recession.

A look at U.S. Manufacturing Shipments shows the sector’s contribution to the recovery may be slightly overstated. Consider the annualized growth rates for shipments for the following periods:

  • January 1992 to January 2000, 8 years at +5.6%.
  • January 2000 to January 2002, 2 years at -4.6%.
  • January 2002 to January 2008, 6 years at +6.5%.
  • January 2008 to January 2009, 1 year at -21.6%.
  • January 2009 to January 2014 (est.), 5 years at +6.1%.

As a result of the Great Recession, shipments dropped to mid-2004 levels and it took 5 years before shipments returned to 2008 levels.

While it is good news that the manufacturing sector has played an important role in the recovery, it should be noted that the annualized rate of growth from 2012 to 2014 was only about 2.0%.

What’s on tap for manufacturing in 2014?
manufacturing
©Copyright 2011 by CBER.

Manufacturing is Critical to Colorado

Manufacturing is important to the Colorado economy for a variety of reasons.

From a data perspective, manufacturing is important for the following reasons:

  • 131,989 workers are employed in the sector. This is 5.8% of total employment and 7.0% of all private sector jobs.
  • There are 5,280 manufacturing establishments. This is 3.1% of all firms, public and private.
  • Total annual wages are $8.2 billion, or 7.2% of total wages and 8.5% of the private sector total.
  •  Average annual wages are $62,237. This is 123.1% of the state average and 122.2% of the private sector average.

The source is the 2012 QCEW data series produced by BLS.


©Copyright 2011 by CBER.

Colorado Manufacturing Wages Higher than State Average

Manufacturing is a source of primary jobs, or jobs that create other jobs, for about 130,000 Coloradans. As well, some manufacturing jobs pay higher than average wages.

In 2011, the year that data is most currently available, the average annual wages per three-digit NAICS manufacturing sector was $61,668 (Colorado). By contrast, the average for the state was $49,245.

Of the 21 sectors, 5 have average annual wages above the Manufacturing average:

  • NAICS 324 (nondurable goods) Petroleum $106,413.
  • NAICS 334 (durable goods) Computers $94,452
  • NAICS 336 (durable goods) Transportation equipment $91,340
  • NAICS 325 (nondurable goods) Chemicals $75,217
  • NAICS 312 (nondurable goods) Beverage $62,099

The following two sectors have wages similar to the Manufacturing average:

  • NAICS 333 (durable goods) Machinery  $61,252
  • NAICS 335 (durable goods) Electrical equipment  $61,257

Of the 21 sectors, 14 have average annual wages below the sector average.

Overall, Colorado average manufacturing wages are higher than the state average.

For additional information on the state’s manufacturing sector check out Colorado Manufacturing Update Analysis of Employment Data Through 2012. It is available in the Special Reports section at https://cber.co.

©Copyright 2011 by CBER.

Colorado’s Dwindling Concentration of Manufacturers a Concern for the State

Manufacturing is a critical part of Colorado’s economy.  Between 1998 and 2010 manufacturing employment decreased significantly in the state and the nation. Despite a slight rebound in jobs, Colorado’s concentration, or location quotient (LQ), of manufacturing workers has not bounced back.

A LQ is the local concentration of workers in a particular sector relative to the concentration in another area (typically the other area is the United States). If the local concentration is the same as the national concentration, the LQ=1.

The Colorado LQ for manufacturing is .645.

In December 2012:

  • 5.72% of Colorado employment was manufacturing
  • 8.87% of U.S. employment was manufacturing.
  • 5.72% / 8.87% = .645

Colorado has a lower concentration of manufacturing that the U.S. In short, this is important because many manufacturing jobs have higher than average pay. As well, segments of the manufacturing industry are critical components of the state’s high tech cluster.

For additional information on the state’s manufacturing sector check out Colorado Manufacturing Update Analysis of Employment Data Through 2012. It is available in the Special Reports section at https://cber.co.

©Copyright 2011 by CBER.