Boulder County and Larimer County Business Development

Both Boulder County and Larimer County are the source of innovation and entrepreneurship that helps drive the Colorado economy.

This analysis compares changes in the unemployment rate, population growth, the number of private sector establishments, and employment. It shows how the growth patterns for the two counties are significantly different for these demographics.

In summary, this comparison shows that:
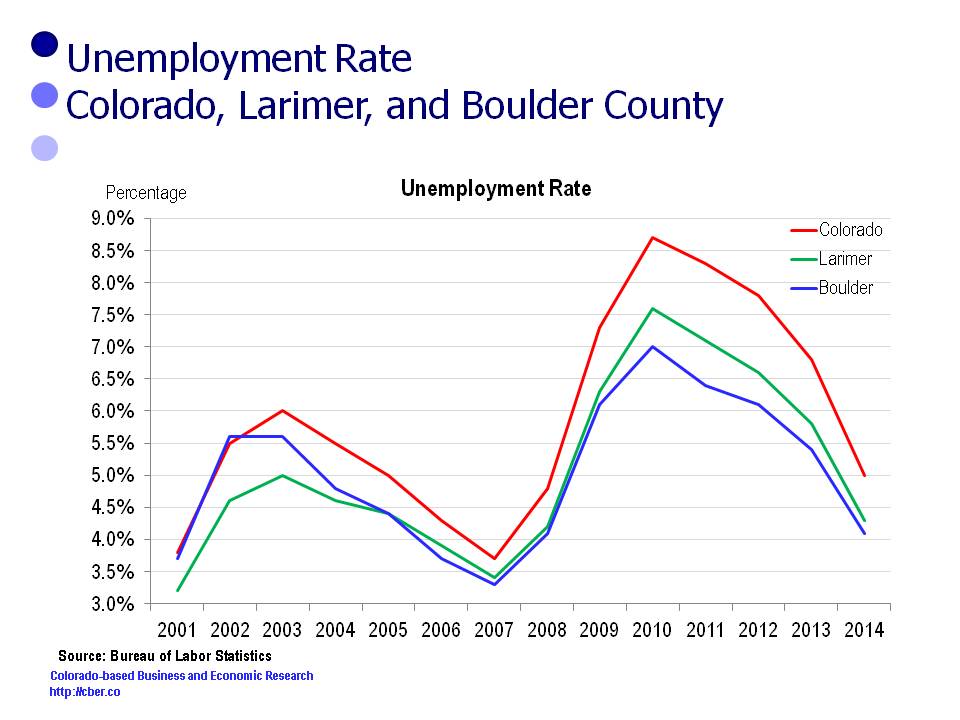
• Since 2001, Boulder County and Larimer County have usually had unemployment rates below the state – which is a mixed blessing.
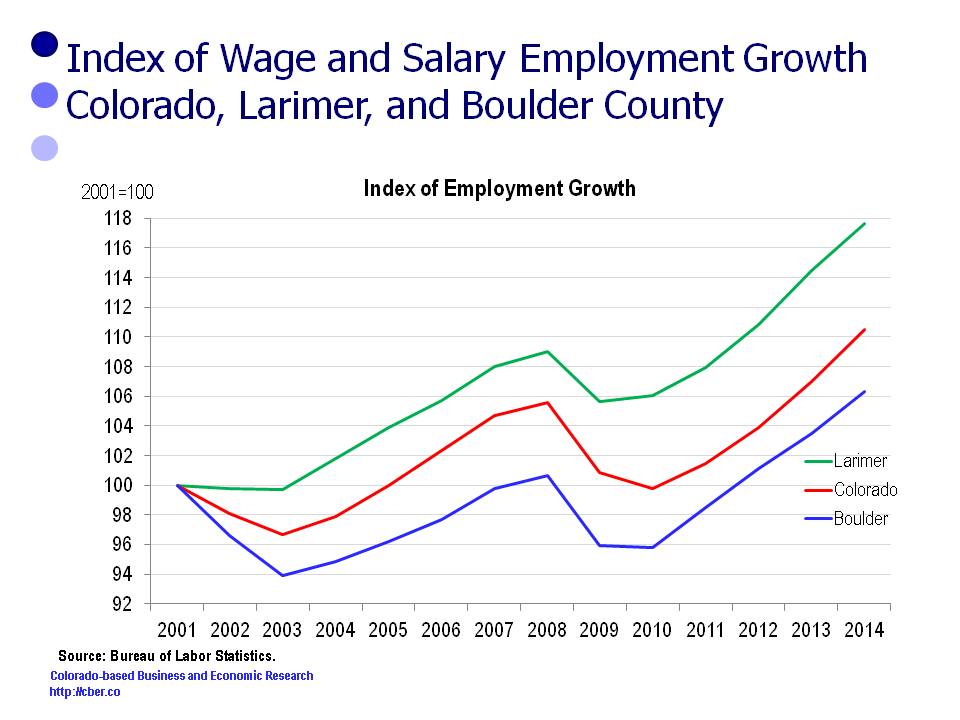
• Since 2001, the population, employment, and number of private sector establishments for Boulder County have grown below the rates for Colorado and Larimer County.
Finally, this analysis poses questions that relate to the changes in these data sets.

Unemployment Rate

Typically, the unemployment rates for both Boulder and Larimer County are below the rate for the state.Boulder County and Larimer County
Population

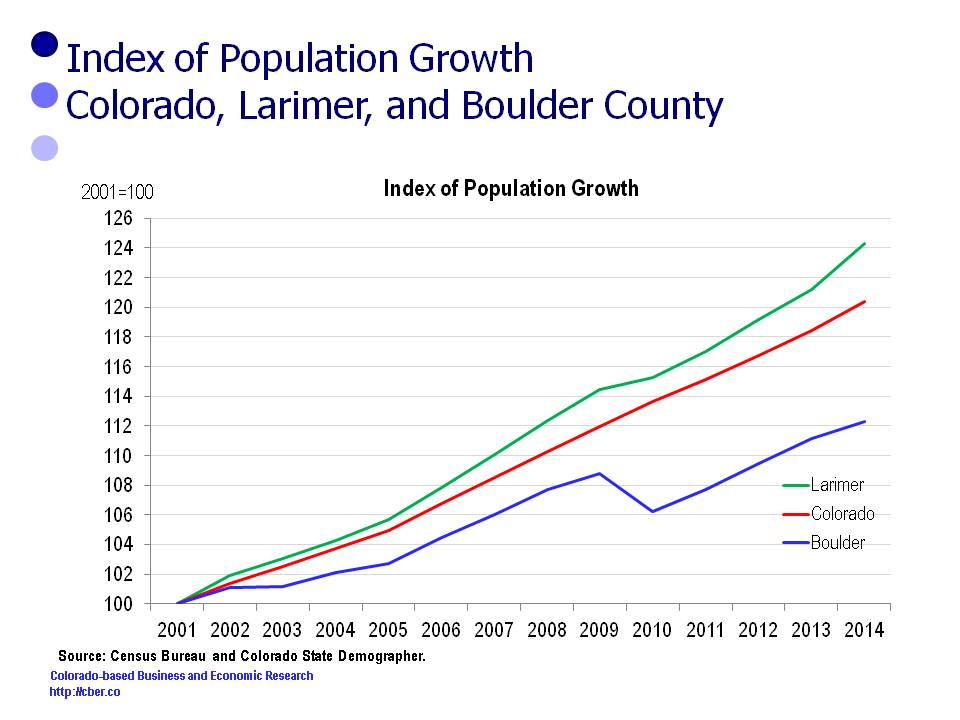
In 2001 Larimer County population was 260,746. It increased by 63,376 and was 324,122 in 2014.
In 2001 the Colorado population was 4,444,513. It increased by 906,059 and was 5,350,572 in 2014.
In 2001 Boulder County population was 278,981. It increased by 34,352 and was 313,333 in 2014.

For this period the rates of change in the population follow:
• Larimer County 24.3%
• Colorado 20.4%
• Boulder County 12.3%.

Boulder County and Larimer County

Establishments

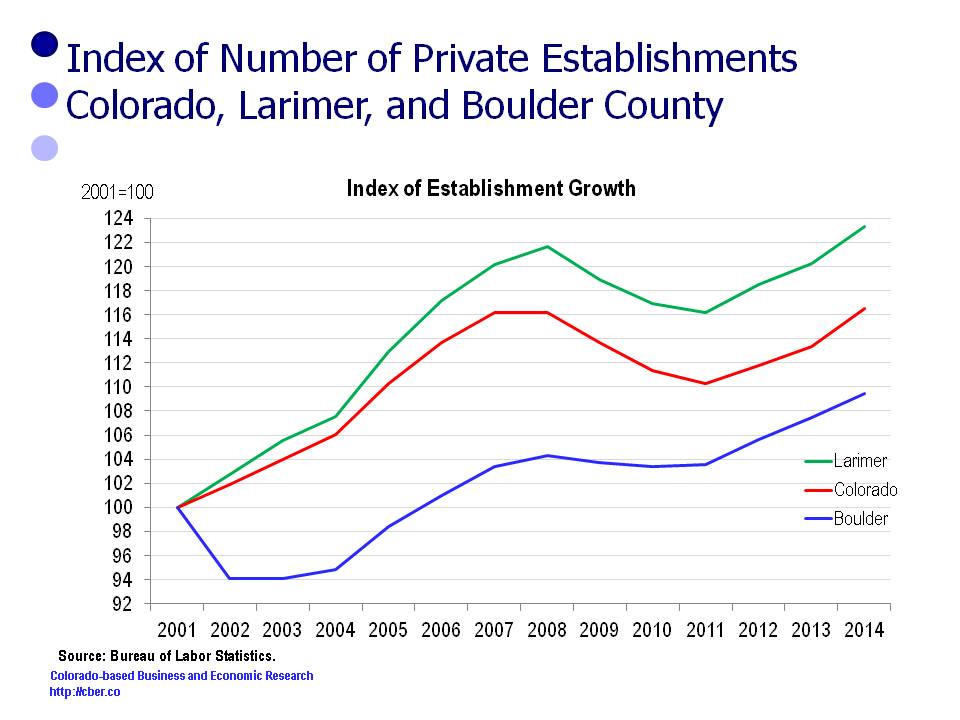
In 2001 there were 8,479 Larimer County establishments. The number increased by 1,976 to 10,455 in 2014.
In 2001 there were 151,025 Colorado establishments. The number increased by 24,957 to 175,992 in 2014.
In 2001 there were 12,335 Boulder County establishments. The number increased by 1,165 to 13,500 in 2014.

For this period the rate of change in the number of establishments follows:
• Larimer County 23.0%
• Colorado 16.5%
• Boulder County 9.4%.

Boulder County and Larimer County

Employment

In 2001 Larimer County employment was 126,300. It increased by 22,300 and was 148,600 in 2014.
In 2001 Colorado employment was 2,226,800. It increased by 234,000 and was 2,460,800 in 2014.
In 2001 Boulder County employment was 166,200. It increased by 10,500 and was 176,700 in 2014.

For this period the rate of change in the employment follows:
• Larimer County 17.6%
• Colorado 10.5%
• Boulder County 6.3%.

Boulder County and Larimer County

Implications

The following questions arise when looking at the changes in the unemployment rate, population, the number of private sector establishments, and employment in Boulder County and Larimer County. (Boulder County is also the Boulder MSA and Larimer County is the Fort Collins MSA).

• How do organizations in Boulder and Fort Collins find qualified workers when the regional unemployment rate is lower than the state and other MSAs? Do they have established training programs? Do they recruit workers from other companies (in-state or out-of-state)? Do they provide their workers premium compensation packages?
• Why is the rate of growth for the Boulder population lower than Fort Collins and the state? Is this a result of a lack of affordable and attainable housing in Boulder? Will the completion of improvements to the 36 corridor make it easier for workers to commute to Boulder? Can commuters afford to use it?
• Why are the number of new business establishments in Boulder growing at a slower rate than Colorado and Fort Collins? Is there a lack of adequate commercial space? Is commercial real estate too expensive in Boulder? Why are other areas more attractive? Is it too expensive to operate a business in Boulder? Is it necessary to export innovative ideas out of Boulder so companies can be successful? Why do companies stay in Boulder
• Why is the employment growth rate for Boulder lower than the state and Fort Collins?

This analysis of data for Larimer, Boulder, and Colorado shows that communities have varied business development policies and priorities that have been successful in different ways.
The Impact of the Decline in the Price of Oil on Colorado

The recent release of BLS wage and salary employment data for Colorado showed that after four months the state is on track to add 71,400 workers. This is slightly below the cber.co forecast range of 73,000 to 79,000.

The softness in job growth may be attributed to the decrease in the price of oil, which bottomed out at $43 per barrel on March 17. A prominent Boulder economist has stated that average annual state employment for the year would fall to 40,000 because of the decline in oil prices. So far, the impact has been minimal.

In April there were 34,400 jobs (NSA) in the Mining and Logging Sector, which includes the mining and oil and gas industries. This is down about 1,300 jobs from December but about 1,800 jobs above the April 2014 total. The sector had record employment this past December.

Some of the factors that have affected demand are:
• Over time global demand for oil has declined, in part because of increased energy efficiency and an increase in the number of alternate sources. That decrease is expected to continue in the future.
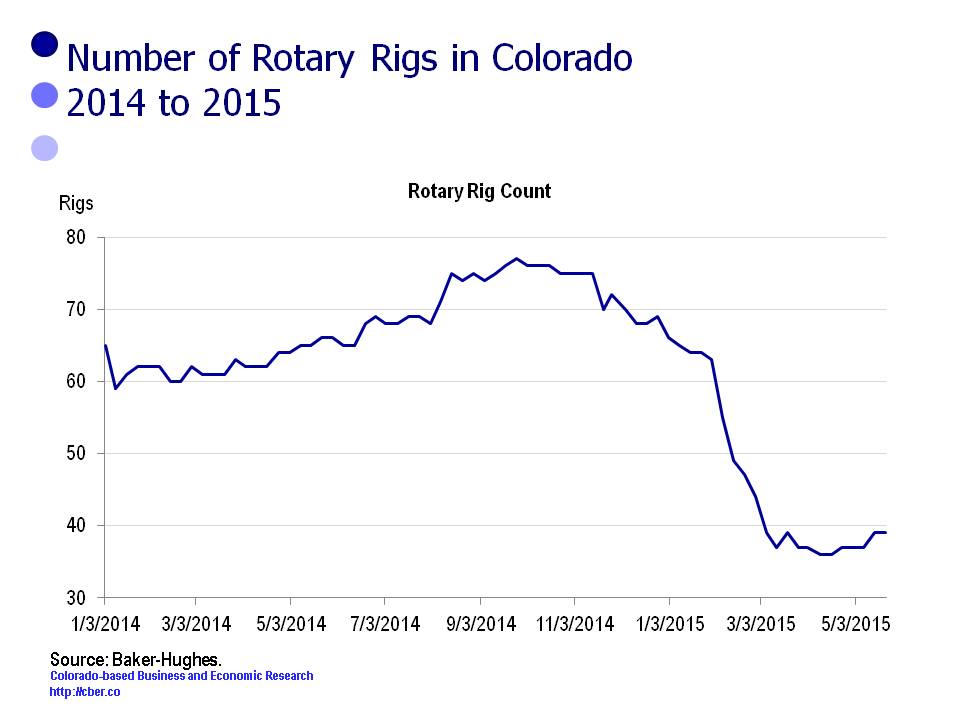
• The number of Colorado rigs in operation has dropped sharply in the past six months.

price of oil
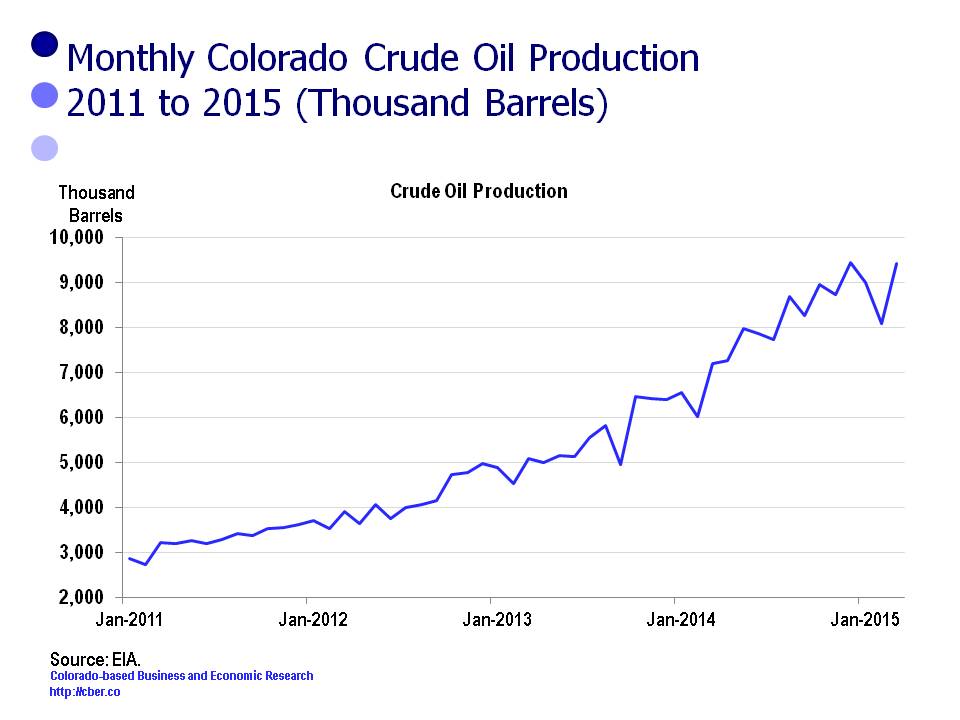
• Oil production in Colorado reached a record high in 2014. Despite the decline in oil prices, monthly production has remained near record levels; however, at some point reduced production is expected if prices remain suppressed for an extended period.

crude oil production
• Nationally, Colorado is a second-tier state for production; however, the oil and gas industry is a significant contributor to the state’s Gross Domestic Product. Today, the U.S. is producing about 80% of the oil used domestically, a significant change from five years ago. This means that Colorado producers will continue to drill, although production may be at lower levels.
• The price per barrel and the breakeven point are less critical than they were five years ago. Producers have become more efficient by reducing overhead and adopting improved technology such as super-fracking. In addition they have capped wells that are older or less efficient. Through increased efficiencies, companies have been able to lower the break-even point for many of their plays and adjust to lower prices per barrel.
• Since March 17th, the price per barrel has risen and reached $60 per barrel in early May. The consensus is that it will remain around that level for the remainder of the year.

These factors will have the following implications on the state:
• Colorado has a diverse energy industry. It is a strong second tier oil and gas state, it has companies that manufacturer solar and wind energy equipment, and significant energy research is conducted locally. Because energy is critical to the security of the U.S., the state will benefit from having a balanced energy portfolio.
• The reduction in the number of rigs will result in a fewer workers in the industry and its supply chain.
• Because production has remained at a high level, the industry’s contribution to the state GDP may not be as adversely impacted as originally thought.
• Oil and gas companies are evolving in a manner similar to manufacturing and other industries – they are becoming much more efficient. Increased efficiencies are expected to continue and many of the jobs that are being eliminated will not return.

Increased efficiencies will allow American companies to continue to be competitive, which in turn will help the U.S. be an “energy independent” nation. In a convoluted way, the Colorado oil and gas industry may actually benefit in the long run from the recent drop in the price of oil.

Q1 2015 Colorado Employment Posts Solid Growth

On April 21, the Bureau of Labor Statistics released its monthly wage and salary employment data for Colorado. Job growth for Q1 2015 was 3.1%, or 74,800 jobs, greater than Q1 2014. The Q1 2015 growth is down slightly from the 2014 annual average of 78,900 jobs; however it is in line with the 2015 cber. co forecast that calls for an increase of 73,000 to 79,000 jobs, or job growth at a rate of 3.0% to 3.2%.

The preliminary March 2015 Colorado employment was 68,900 jobs greater than the March 2014 value. The year-over-previous-year increase for February was 80,800 jobs. It was 74,600 jobs for January.

The lower level of growth in March does not necessarily signify a downward trend. Most likely it is a reflection of volatility related to changes in the extractive industries.

About 67.0% of total jobs added were in the Health Care; Accommodations and Food Services; Construction; Profesional, Scientific, and Technical Services (PST); and Manufacturing sectors.

Approximately 21.3% of all jobs added were in Leisure and Hospitality; however, the BLS estimate model has most likely overstated this YTD contribution.

About 9.9% of total jobs added were in the PST, Manufacturing, and Information sectors. These sectors are the source of primary and advanced technology jobs.

Colorado Employment vs. U.S. Employment

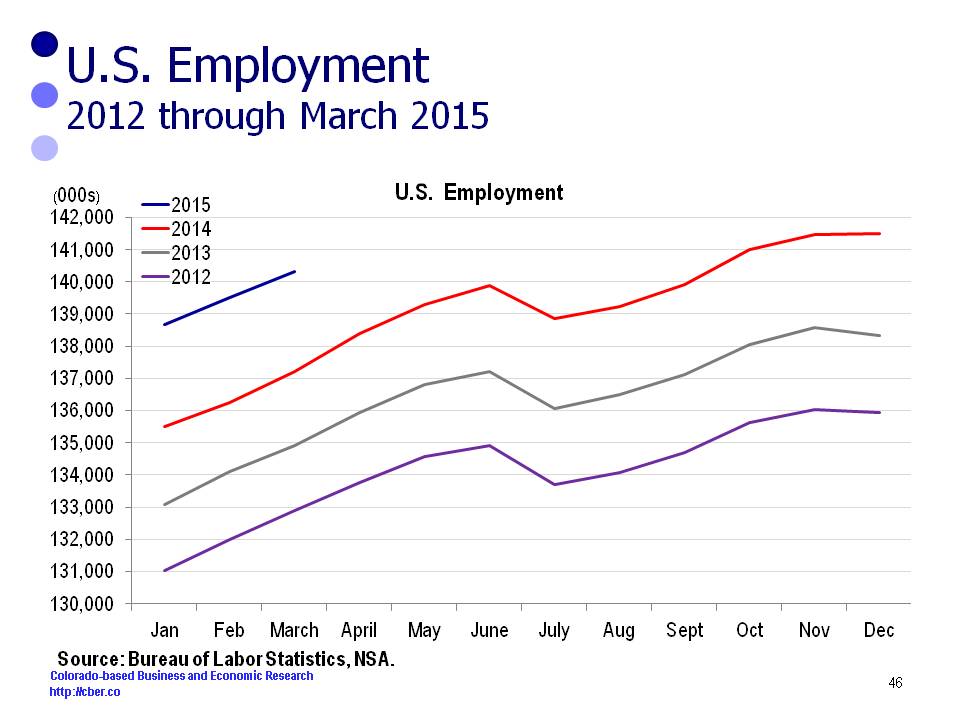
Nationally, average employment for Q1 2015 is about 2,265,133 jobs greater than Q1 2014 employment. While this rate of growth is solid, the Q1 value is less than the average number of jobs added during 2014 (2,313,033). A brutal winter in parts of the country prevented employment and output during the first quarter from being stronger.

The cber.co forecast for U.S. job growth in 2015 is 2,600,000 workers. Stronger job growth is expected in the second half of the year.

us employment Q1 2015

2015 cber.co Forecast – Fine Tuning the Volatile Category

In preparing its annual forecast, cber.co divides the NAICS sectors into three categories. This portfolio approach makes it easy to see that some sectors consistently create jobs at a higher rate of growth, some show solid growth, and others are more volatile. Ultimately, the volatile category tends to have a greater influence on the magnitude of change in total job growth than the sectors with steady growth. In March 2015 BLS released its benchmark revision of the 2014 data. The changes were more significant than usual.

As a result  the 2015 cber.co forecast was fine-tuned to have a better understanding of categories and sectors that were driving the economy. This brief discussion highlights the revisions to the 2015 cber.co forecast. This post will evaluate the Volatile Category.

The Volatile Category

Over the past two decades the sectors listed below were the primary source of volatility in total employment.

The sectors are:

  • Natural Resources and Mining
  • Construction
  • Manufacturing
  • Transportation, Warehousing, and Utilities
  • Employment Services
  • Financial Activities
  • Information
  • Federal Government

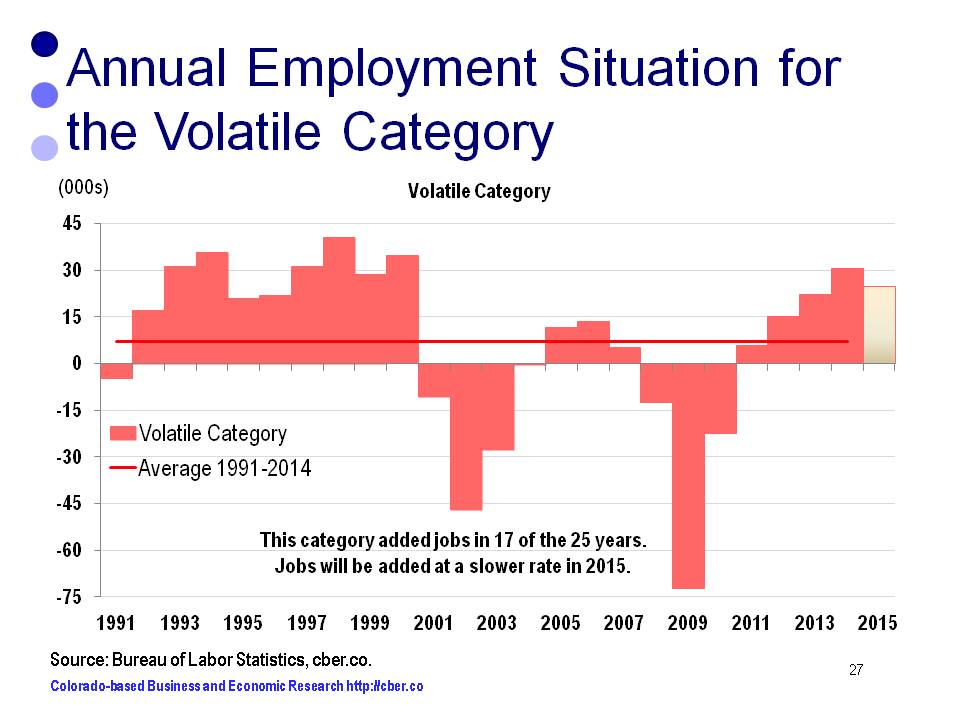
Total employment for this category was:

  • 1994  625,400 workers, 35.6% of total employment
  • 2004  716,000 workers, 32.8% of total employment
  • 2014  713,000 workers, 29.0% of total employment

2015 cber.co forecast

Estimated Job Growth

As can be seen below there is a significant difference between the original estimates for 2014 (January 11) and Benchmark revisions for 2014 (March 27). BLS significantly underestimated growth in this category in 2014.

The original Volatile Category estimates/forecast (January 11 Forecast) was + 23,000 to 27,000 Employees.

  • 19,800 jobs added in 2013
  • 25,600 jobs added in 2014
  • 706,100 employees in 2014

In 2015 between 23,000 and 27,000 jobs will be added, at a rate of 3.3% to 3.7%. This rate of growth is slightly slower than 2014.

The updated Volatile Category estimates/ forecasts, after benchmark revisions (March 27 Forecast) was + 23,000 to 27,000 Employees.

  • 22,200 jobs added in 2013
  • 30,000 jobs added in 2014
  • 713,000 employees in 2014

In 2015, between 23,000 and 27,000 workers will be added at a rate of 3.2% to 3.8%. Despite the significant underestimate in 2014, the forecast for 2015 was unchanged.

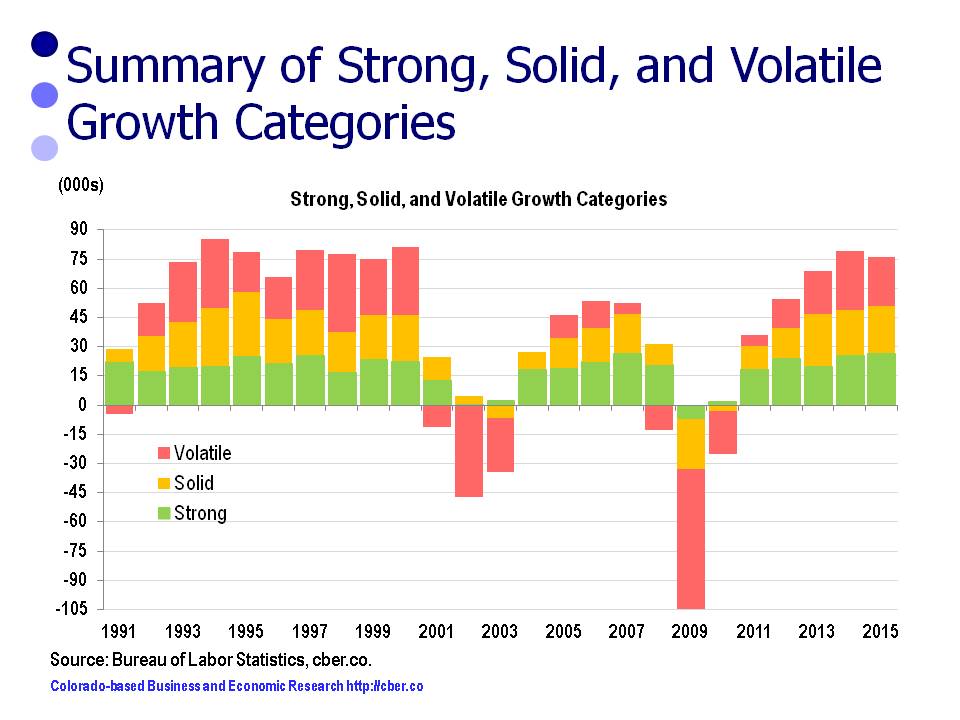
The recalibration of the 2015 forecast resulted in the following changes:
• The Strong Growth Category was revised upward by 4,500.
• The Solid Growth Category was revised downward by 1,500.
• The Volatile Category remained unchanged.
• The net change to the 2015 forecast was an upward revision of 3,000; however, the 2015 forecast is for total growth slightly below the 2014 total.

The change in the mix of jobs being added is equally as important as the change in the number of jobs being added. For further information on the cber.co forecasts click here.

2015 cber.co forecast


2015 cber.co Forecast – Fine Tuning Strong Growth Category

In preparing its annual forecast, cber.co divides the NAICS sectors into three categories. This portfolio approach makes it easy to see that some sectors consistently create jobs at a higher rate of growth, some show solid growth, and others are more volatile. Ultimately, the volatile category tends to have a greater influence on the magnitude of change in total job growth than the sectors with steady growth.

In March 2015 BLS released its benchmark revision of the 2014 data. The changes were more significant than usual.

As a result cber.co fine-tuned the 2015 employment forecast to have a better understanding of categories and sectors that were driving the economy.  This brief discussion highlights the revisions to the 2015 cber.co forecast. This post will evaluate the Strong Growth Category.

solid growth

The Solid Growth Category

Over the past two decades the following NAICS sectors have been the foundation for consistent growth in Colorado employment.
• Professional, Scientific, and Technical Services
• Management of Companies and Enterprises
• Administrative – Business to Business (Not Employment Services)
• Private Education
• Health Care
• Arts, Entertainment, and Recreation
• Other Services.

Total employment for this category was:
1994 445,200 workers, 25.4% of total employment
2004 615,900 workers, 28.3% of total employment
2014 786,700 workers, 32.0% of total employment

Estimated Job Growth

As can be seen below there is a significant difference between the original estimates for 2014 (January 11)  and Benchmark revisions for 2014 (March 27).

The original Strong Growth Category estimates/forecast  (January 11 Forecast) was  + 20,000 to 24,000 Employees.
• 20,300 jobs added in 2013
• 20,900 jobs added in 2014
• 782,500 employees in 2014
• In 2015, between 20,000 and 24,000 workers will be added at a rate of 2.8% to 3.0%.

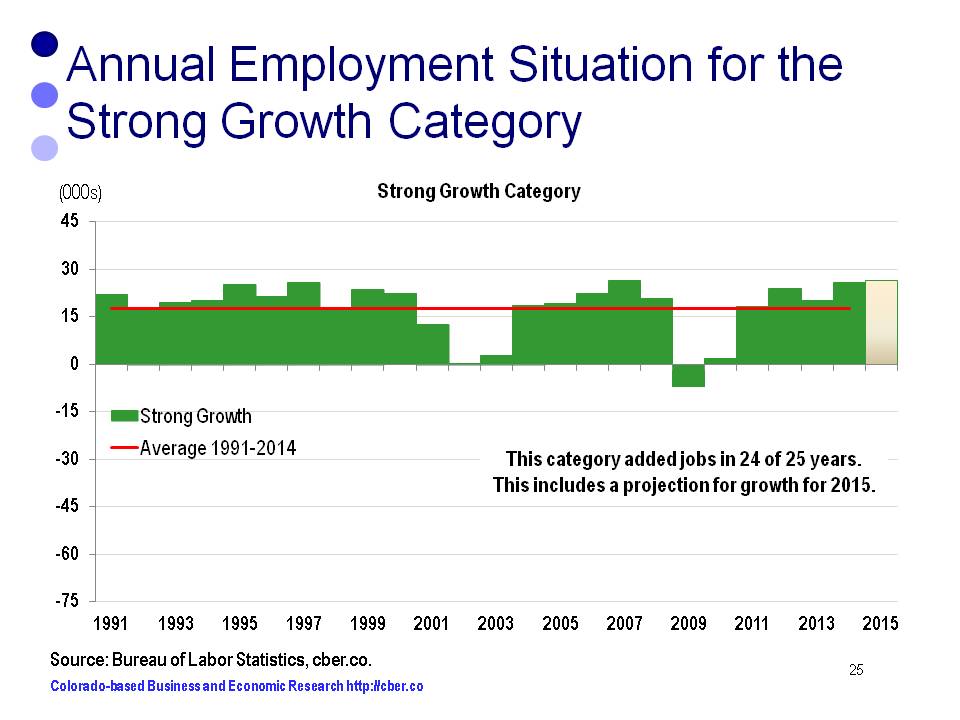
The updated Strong Growth Category estimates/ forecasts, after benchmark revisions (March 27 Forecast) was + 24,500 to 28,500 Employees.
• 20,000 jobs added in 2013
• 25,600 jobs added in 2014
• 786,700 employees in 2014
• In 2015, between 24,500 and 28,500 workers will be added at a rate of 3.1% to 3.6%.

BLS significantly underestimated the magnitude of growth in total employment as well as the increase in the number of jobs in the Strong Growth Category. As a result changes were made to the 2015 category and total employment.

In 2015, between 24,500 and 28,500 workers will be added. The rate of growth will be 3.1% to 3.6%. This rate of growth is slightly greater than 2014. Absolute job growth of this category will be similar to job growth in 2007 and 2014.

Total employment for the state will increase by 73,000 to 79,000.

The recalibration of the 2015 forecast resulted in the following changes:

• The Strong Growth Category was revised upward by 4,500.
• The Solid Growth Category was revised downward by 1,500.
• The Volatile Category remained unchanged.
• The net change to the 2015 forecast was an upward revision of 3,000; however, the 2015 forecast is for total growth slightly below the 2014 total.

The change in the mix of jobs being added is equally as important as the change in the number of jobs being added. For further information on the cber.co forecasts click here.

summary of employment growth by category

Colorado Employment to Continue at Steady Pace in 2015

Later this week, cber.co will release its Colorado economic forecast for 2015. The primary focus of the Colorado forecast is employment within the state. As economic developers say, “it all starts with a job.”

Each year the forecast provides an optimistic, pessimistic, and most likely scenario.

The 2015 optimistic scenario calls for:
• U.S. Real GDP growth will be greater than 2.9%.
• Colorado will add more than 76,000 workers.

The projected likelihood of this scenario is 15%. The Colorado economy has experienced solid job growth since 2012; however, there is nothing to believe that it will experience growth at a significantly greater rate during 2015.

The pessimistic scenario calls for:
• U.S. Real GDP growth will be less than 2.5%.
• Less that 70,000 Colorado workers.

Unfortunately, there is more downside risk to the forecast than upside risk. The projected likelihood of this scenario is 30%. While the global and U.S. economies are expected to see slight growth in output, the Colorado economy could be derailed if the price of oil remains below $65 per barrel (the estimated breakeven point for the Niobrara Oil field) for an extended period.

The most likely scenario calls for:
• U.S. Real GDP will be 2.5% to 2.9%.
• The U.S. will add at least 2.6 million workers.
• Colorado will add 3.0% of total U.S. jobs added.
• Colorado will add 70,000 to 76,000 workers, job growth will be 2.8% to 3.0%.

Despite downside risks associated with lower prices for oil and reduction production in Colorado there is a 55% likelihood this forecast will occur. Since 2012 growth has been steady and broad-based. Much of the growth has been in sectors such as tourism, which have an indirect link to the extractive industries.

Average Colorado employment will be 2,525,600 for 2015.

For additional information about the 2015 cber.co Colorado Economic Forecast click here.

Colorado Jobs and Economy Remain Strong

On December 20th the BLS will provide their final 2014 Colorado jobs report.

Given the strength of the U.S. job growth reported earlier this month (321,000 jobs added), it is reasonable to think there will be solid job growth for November. While the economy has had its ups and downs, job growth remains solid, and is trending upwards.

The upcoming press release is somewhat irrelevant because the BLS will release the 2014 benchmark revisions in early March of 2015. That data is expected to show that the number of Colorado jobs increased by about 73,000, or 3.1%, during 2014.

The BLS began producing state employment data in 1939. The Job growth of 73,000 jobs in 2014 will be the tenth best year in terms of absolute job growth (the number of jobs added). On the other hand, 2014 will be the 38th best year in terms of relative job growth (percentage of job growth).

This year marks the only time that Colorado jobs have increased at an accelerating rate for four consecutive years. Between 2011 and 2014, Colorado has added about 231,000 workers (36,300 jobs in 2011; 54,400 jobs in 2012; 68,100 jobs in 2013; and 73,000 jobs in 2014.)

Looking ahead to 2015:
• The price of oil has declined precipitously because supply exceeds demand. As a result the price for a gallon of gasoline has dropped well below $3.00 per gallon. To date, the short-term impact of lower gas prices has been minimal. If prices remain low, Colorado’s frequent fuelers will realize savings of about $500 to $600 next in 2015. Because wage growth has been weak over the past four years, most people will not use the savings for discretionary purposes. Rather they will pay for rent, food, medical costs, and other necessary expenses that have risen at a rate faster than their wages.
• In the short-term (first half of 2015) lower oil prices may not have a significant impact on production and the number of workers in Colorado’s extractive industries. If prices are suppressed for an extended period, then production will fall. Initially, contractors and engineers will be laid off and production workers will be furloughed. Eventually smaller companies and suppliers will be impacted. The extractive industries have a comparatively small direct workforce; however, they indirectly touch many industries. They have a much bigger role in the Colorado economy than most people realize.
• A slowdown in the economies of China, Russia, and parts of the European Union may impact Colorado companies that export products and services globally.
• Wage growth has been extremely weak, particularly given the decline in the rate of unemployment this year. Although the unemployment rate is below 4.5% (the natural rate of unemployment), upward wage pressure has been felt in only a few industries, such as construction and finance.
• Retail sales have remained solid because of increased employment and in-migration. Stronger wage growth is needed to support significant growth in retail sales.
• The downward trend in the unemployment rate is a mixed blessing. It is great that more people have jobs, but labor shortages will occur  in more industries during 2015 as the supply of trained workers is reduced.
• Health care costs will continue to be an issue in 2015. Participants in the Connect for Health Colorado program will not see minimal increases in their 2015 premiums. Unfortunately, the subsidies were reduced, which will cause costs for insurance to increase significantly for many families.
• Colorado’s housing prices continue to rise, which is good news for existing home owners. It is not such good news for renters and people moving to the state.

Despite these headwinds, there are plenty of reasons to be optimistic about the growth in the number of Colorado jobs and the overall economy in 2015.

Colorado’s Diversity of Job Growth

cber.co tracks changes in employment for 23 sectors of the Colorado economy. Part of that tracking includes a two-step process for measuring Colorado’s diversity of job growth.

The first step is to identify the number of sectors that are adding jobs. For the last three years the data shows:
• In 2012 19 sectors added jobs
• In 2013 19 sectors added jobs
• In 2014 18 sectors will add jobs (estimate).

As a point of reference, a comparison can be made to the following years:
• In 1993 22 sectors added jobs
• In 1998 22 sectors added jobs
• In 2002 13 sectors added jobs
• in 2003 10 sectors added jobs
• in 2009 8 sectors added jobs
• In 2010 10 sectors added jobs.
This shows that during the best of times, some sectors lose jobs. As well, it illustrates that during the worst of times, there are sectors adding jobs.

Another way to look at the data is to calculate the percent of employment in sectors where jobs are being added. For the last three years the data shows:
• In 2012 the sectors that added jobs had 88.5% of total employment.
• In 2013 the sectors that added jobs had 89.2% of total employment.
• In 2014 the sectors that added jobs had 85.4% of total employment (estimate).
The 2014 percentage might increase when the BLS revises 2014 data in March 2015.

As a point of reference, a comparison can be made to the following years:
• In 1993 the sectors that added jobs had 99.1% of total employment.
• In 1998 the sectors that added jobs had 99.6% of total employment.
• In 2002 the sectors that added jobs had 49.4% of total employment.
• In 2003 the sectors that added jobs had 36.7% of total employment.
• In 2009 the sectors that added jobs had 27.3% of total employment.
• In 2010 the sectors that added jobs had 33.2% of total employment.

The data shows that since 2012 Colorado’s job growth has been diverse and solid.

diversity of job growth


U.S. and Colorado Economy Remain Solid

National Economy
The U.S. economy remains strong, with solid employment and output growth.

• Nationally, employment remains strong, despite slower than expected job growth in August. The non-seasonally adjusted data shows that an average of 215,000 jobs has been added each month through eight months. This means the U.S. will add about 2.5 million jobs this year.
• Output remains solid. The first Q2 estimate showed real GDP growth of 4.0%. That was revised upwards to 4.2%. It is possible the third estimate, due later this month, could be revised even higher to 5.0%.
• At the most recent FOMC meeting the Federal Reserve provided no surprises. Their stance on the economy indicates:
o The rate of inflation remains below target.
o Quantitative easing will come to an end.
o There is slack in the labor market.
o Interest rates will remain low in the near term; however, once rate increases begin they will accelerate faster than previously anticipated. It is likely rates will begin increasing in mid-2015.
• The outlook for construction is positive.  Single family building permits have been flat; however the NAHB index shows that homebuilder sentiment is much stronger than the permits data. This suggests greater activity, and stronger data, will occur in the future.
• The unemployment rate, number of unemployed, and the number of Americans filing new claims for unemployment benefits continue on a downward trend. The economy should remain healthy as long as fewer people are unemployed and an increasing number of Americans are working.

Colorado Economy

The performance of the Colorado economy is closely tied to changes in U.S. job and output growth. Since the end of the recession Colorado job growth has outperformed the U.S. because of its mix of industries. The state is on track to add jobs at an accelerated rate for the fourth consecutive year.  Job growth this year will be about 3.0%.

• The extractive industries have been a major direct and indirect contributor to the job growth. As well, the extractive industries were responsible for about one-third of the state’s GDP growth in 2013. The extractive industries are important to the economies of about half the counties in the state. From a jobs perspective, the sector is small, but the number of workers will increase by at least 9% this year compared to 2013.
• So far this year, between 10% and 12% of the jobs added in Colorado are construction jobs. The number of jobs will increase by at least 6.5% compared to the same period last year. Growth in the sector might be constrained by a lack of trained workers in specialized construction occupations such as plumbers, HVAC workers, and electricians. The home and infrastructure subsectors also include distinct specialized occupations.
• Tourism has enjoyed a banner year in Colorado. It began with good snow and a strong ski season. The good snow season also meant plenty of water for mountain rafting and summer tourism activities. Special events, such as the USA Pro Challenge, and the lack of fires and flooding provided the foundation for a strong summer season. Leisure and hospitality job growth is poised to be at least 4.6% greater in 2014 than last year. The sector will be responsible for adding about 19% of the jobs in the state this year.  The sector plays a significant part of the economy in all 64 counties.
• The healthcare sector will add more than 10,000 workers in 2014 and expand at a rate of more than 4.3%. The sector continues to face challenges finding workers in many occupations and in rural areas.
• The growth of the professional, scientific, and technical sector is important to the state because a portion of these companies are directly or indirectly a part of the state’s advanced technology sector. The lifestyle of Downtown Denver and Colorado is attracting millennials to jobs in these sectors. The growth of in the sector will be at a rate of about 4.5% in 2014. It is important to note that many of these occupations pay higher than average wages and the sector is adding jobs at an increasing rate.


Colorado Job Growth Outpaces the U.S.

Colorado is outpacing the U.S. in the rate of job growth. The mix of jobs added by the top sectors is different for Colorado than the U.S. In addition, many of the jobs being added in the state pay lower than average wages.

Through seven months, the sectors that contributed the greatest number of jobs (top five) account for 70.4% of jobs created in Colorado.

  • Accommodations and Food Services 19.8%
  • Health Care 15.9%
  • Professional, Scientific, and Technical Services 12.0%
  • Construction 11.9%
  • Retail Trade 10.8%.

Through seven months, these same five sectors contributed only 56.4% of the jobs created in the U.S.

  • Accommodations and Food Services 14.1%
  • Health Care 12.6%
  • Professional, Scientific, and Technical Services 9.1%
  • Construction 7.7%
  • Retail Trade 12.8%.

Colorado’s rate of growth for these sectors during the first seven months is faster than the U.S.

  • Accommodations and Food Services, 5.5% vs. 2.8%.
  • Health Care, 4.3% vs. 1.7%.
  • Professional, Scientific, and Technical Services, 4.3% vs. 2.7%.
  • Construction 6.5% vs. 3.2%.
  • Retail Trade 3.0% vs. 2.0%.

For the first seven months, the cumulative total of the Colorado sectors where primary jobs were categorized (manufacturing, information, PST) expanded at a faster rate than the U.S, 2.7% vs. 1.3%.

The following are the average annual private sector wages for the sectors that are adding the most jobs.

  • Accommodations and Food Services $18,808.
  • Health Care, $45,905.
  • Professional, Scientific, and Technical Services, $84,842.
  • Construction, $51,064.
  • Retail Trade $28,159.

Many of the jobs being added in Colorado are low paying jobs.

It is great that the Colorado economy is adding jobs. Time will tell whether the mix of jobs being added will be to Colorado’s benefit or detriment.