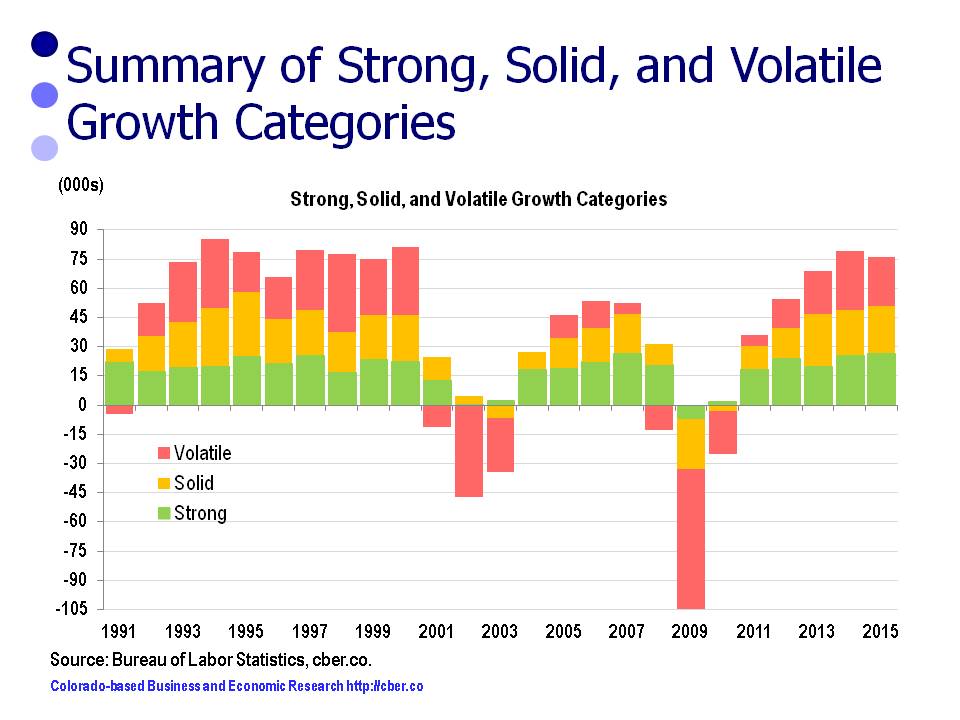
In preparing its annual forecast, cber.co divides the NAICS sectors into three categories. This portfolio approach makes it easy to see that some sectors consistently create jobs at a higher rate of growth, some show solid growth, and others are more volatile. Ultimately, the volatile category tends to have a greater influence on the magnitude of change in total job growth than the sectors with steady growth. In March 2015 BLS released its benchmark revision of the 2014 data. The changes were more significant than usual.
As a result the 2015 cber.co forecast was fine-tuned to have a better understanding of categories and sectors that were driving the economy. This brief discussion highlights the revisions to the 2015 cber.co forecast. This post will evaluate the Volatile Category.
The Volatile Category
Over the past two decades the sectors listed below were the primary source of volatility in total employment.
The sectors are:
- Natural Resources and Mining
- Construction
- Manufacturing
- Transportation, Warehousing, and Utilities
- Employment Services
- Financial Activities
- Information
- Federal Government
Total employment for this category was:
- 1994 625,400 workers, 35.6% of total employment
- 2004 716,000 workers, 32.8% of total employment
- 2014 713,000 workers, 29.0% of total employment
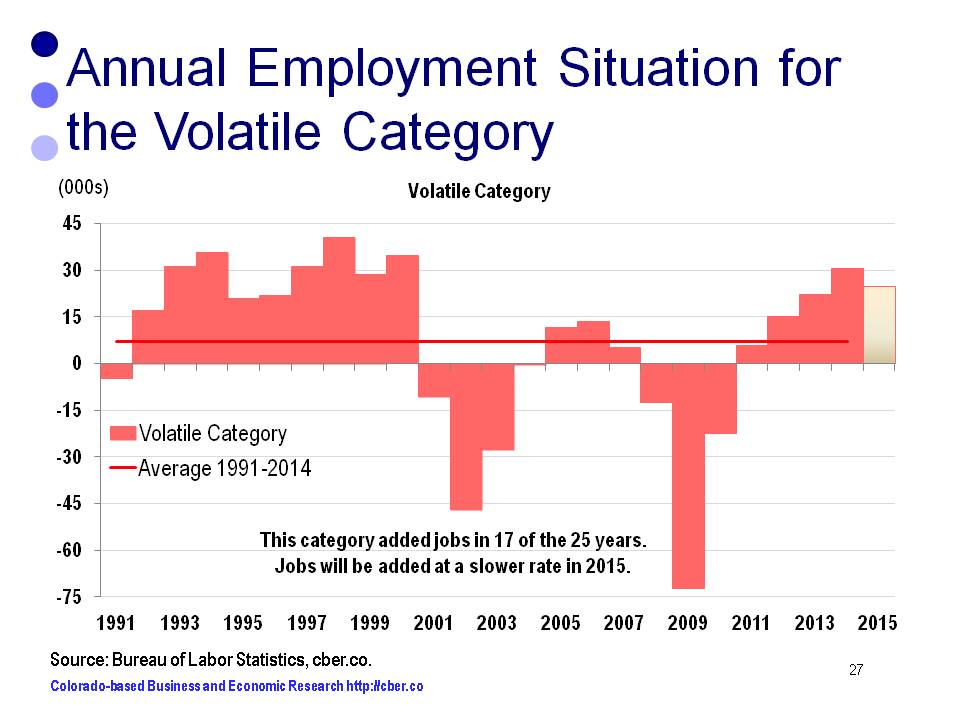
Estimated Job Growth
As can be seen below there is a significant difference between the original estimates for 2014 (January 11) and Benchmark revisions for 2014 (March 27). BLS significantly underestimated growth in this category in 2014.
The original Volatile Category estimates/forecast (January 11 Forecast) was + 23,000 to 27,000 Employees.
- 19,800 jobs added in 2013
- 25,600 jobs added in 2014
- 706,100 employees in 2014
In 2015 between 23,000 and 27,000 jobs will be added, at a rate of 3.3% to 3.7%. This rate of growth is slightly slower than 2014.
The updated Volatile Category estimates/ forecasts, after benchmark revisions (March 27 Forecast) was + 23,000 to 27,000 Employees.
- 22,200 jobs added in 2013
- 30,000 jobs added in 2014
- 713,000 employees in 2014
In 2015, between 23,000 and 27,000 workers will be added at a rate of 3.2% to 3.8%. Despite the significant underestimate in 2014, the forecast for 2015 was unchanged.
The recalibration of the 2015 forecast resulted in the following changes:
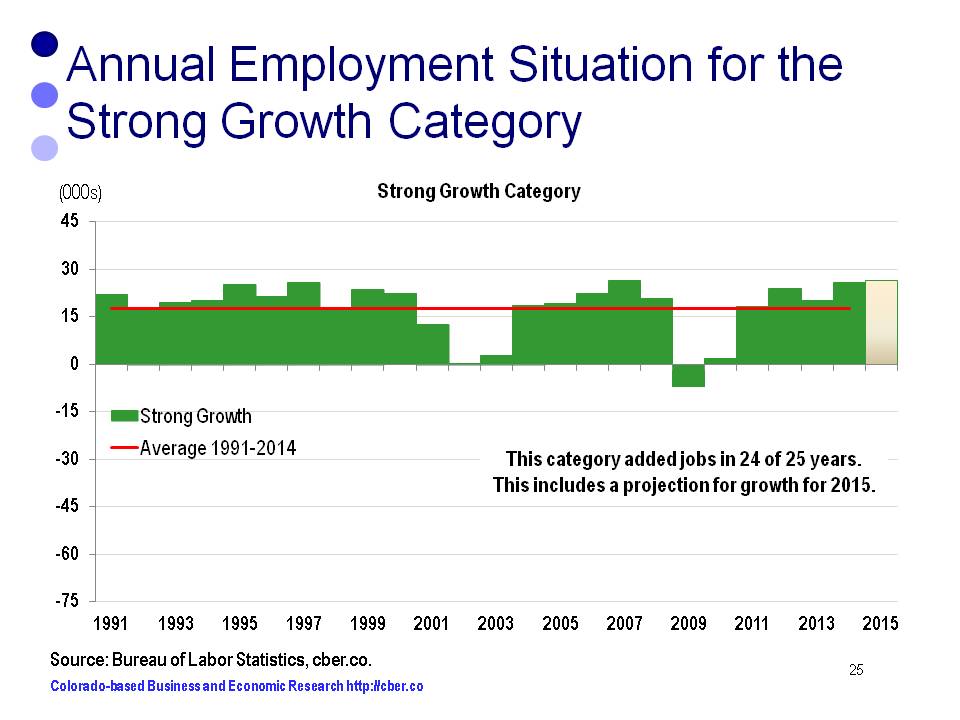
• The Strong Growth Category was revised upward by 4,500.
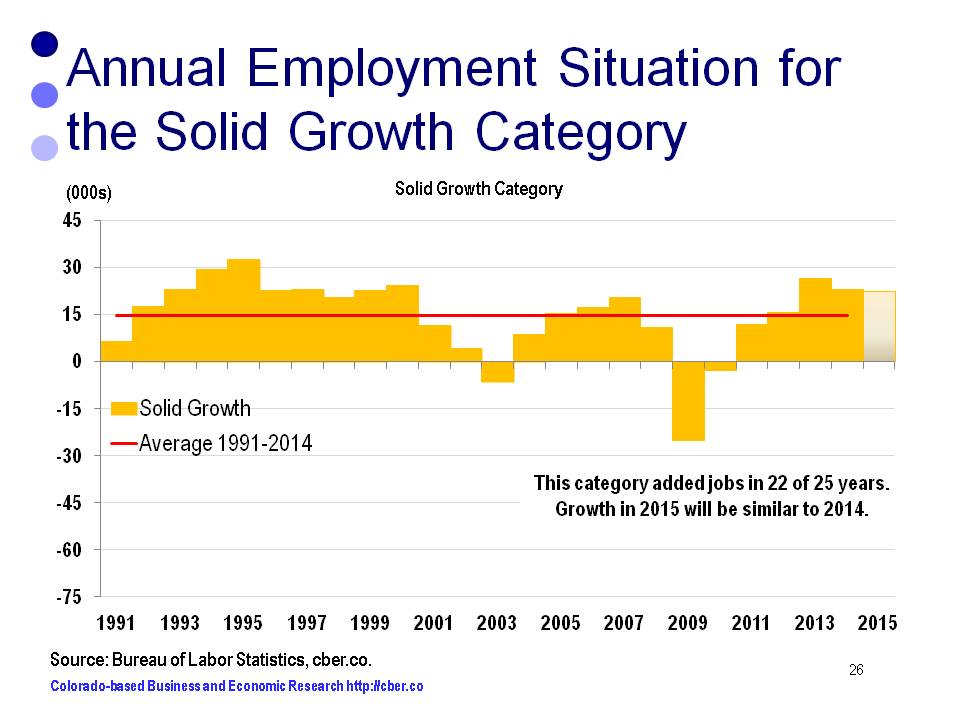
• The Solid Growth Category was revised downward by 1,500.
• The Volatile Category remained unchanged.
• The net change to the 2015 forecast was an upward revision of 3,000; however, the 2015 forecast is for total growth slightly below the 2014 total.
The change in the mix of jobs being added is equally as important as the change in the number of jobs being added. For further information on the cber.co forecasts click here.