Which had a greater impact on U.S. real GDP? Was it the COVID-19 Recession or the Great Recession?
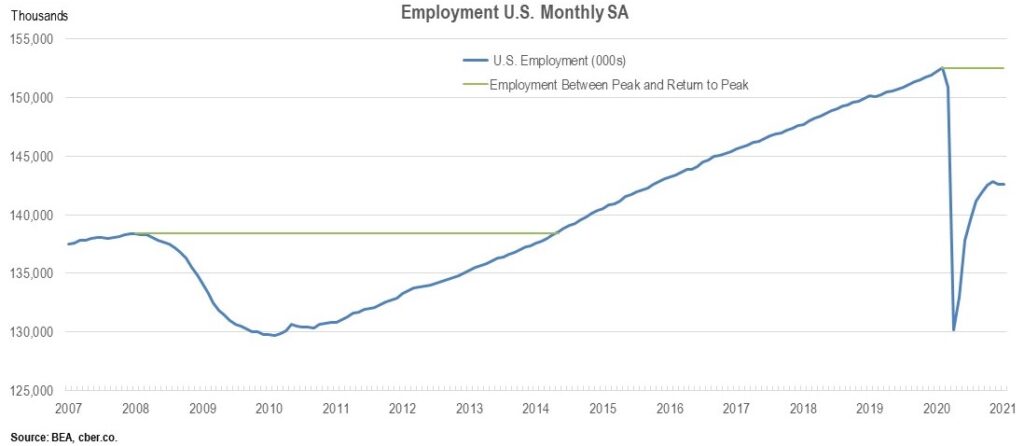
In Q4 2019, the U.S. real GDP peaked. The new year (2020) started on a positive note with solid job growth in January and February. In March COVID-19 was declared a pandemic. Government leaders put lockdowns and restrictions in place that caused employment and real GDP to plummet.
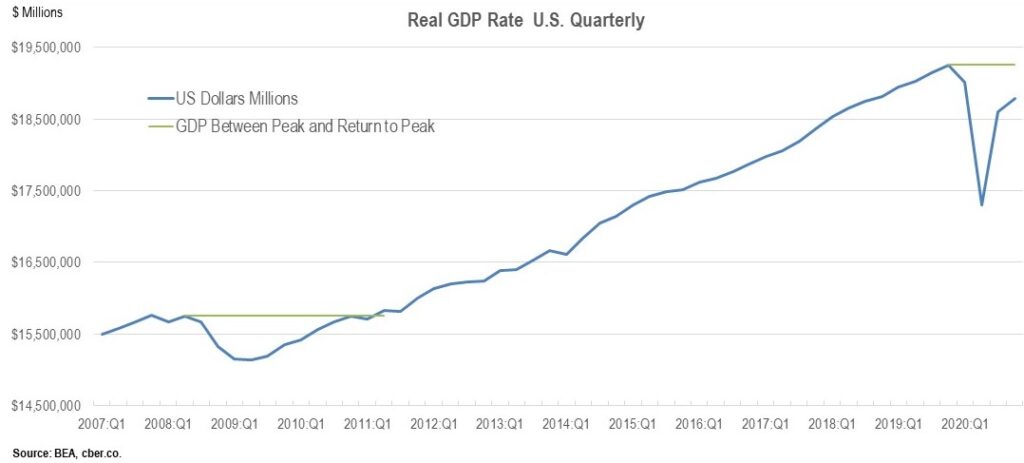
The rate of change in real GDP for Q1 was -5.0%. The Q1 value was 98.7% of the Q4 2019 value.

The trough of the downturn occurred in Q2. The rate of change was -31.4%. The Q2 value was 89.9% of the Q4 2019 value.
In Q3, the number of lockdowns and restrictions was reduced and the recovery began. The change in the real GDP growth rate for Q3 was +33.4%. The Q3 value was 96.6% of the Q4 2019 value.
The rate of growth tapered off in Q4 because there was a resurgence in the virus and some government leaders restored lockdowns and other restrictions. The change in the real GDP growth rate for Q4 was 4.0%. The Q4 value was 97.5% of the Q4 2019 value.
The path of the real GDP value was V-shaped during 2020. It will more closely resemble a checkmark when 2020 and 2021 are combined. The value of real GDP will return to the Q4 2019 level in Q4 2021.
In 2021 real GDP growth will be driven by stimulus funding, which will increase employment and spending. There will be stronger growth in the second half of the year.
Overall, there were be two quarters when the value of real GDP declined and six quarters where it recovered to reach the Q4 2019 value. The total time of the decline and recovery is eight quarters or two-years.
A look at the Great Recession shows real GDP peaked in Q2 2008 and it declined for four quarters. Real GDP increased from Q2 2009 to Q2 2011 (eight quarters), until it returned to the Q2 2008 peak. The overall time of the decline and recovery was 12 quarters or 36 months.
The Great Recession was more shallow; however, the COVID-19 Recession recovered more quickly.
