Colorado Recovery Lagging Other States

Last summer, Colorado was one of the top states in the recovery from the C-19 pandemic. As time has passed, its economic performance has gotten worse.

The most recent release of data from the Bureau of Labor Statistics shows that Colorado lost 20,300 jobs in December, compared to November. December was the second consecutive month that the state lost jobs. 

The unemployment rate jumped to 8.4%. That rate was the 48th highest rate in the country. It was slightly worse than New York but less than California, Nevada, and Hawaii.
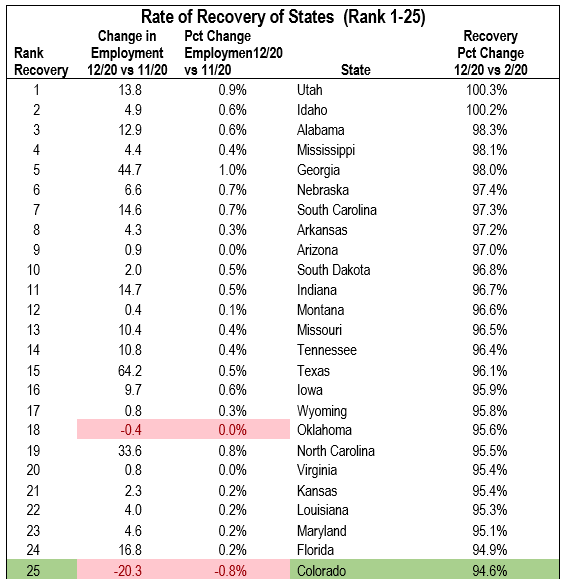
Only 2 states in the top 25 lost jobs in December 2020.

The two charts in this post show the following:

  • Column 1 is the rank of the recovery (column V).
  • Column II is the absolute change in employment from November 2020 to December 2020.
  • Column III is the percentage change in employment from November 2020 to December 2020.
  • Column V is the percentage recovery from February 2020 to December 2020.

Colorado (green) has the 25th lowest percentage of recovery, 94.6%. Two states, Utah and Idaho, have already returned to their employment pre-pandemic employment levels.

The chart above shows that 2 of the 25 states lost jobs between November and December.

The chart below shows that 19 of 26 states lost jobs between November and December.

State and local leaders have struggled to maintain a balance between the number of new C-19 cases and deaths and the health of the economy. Stay tuned.
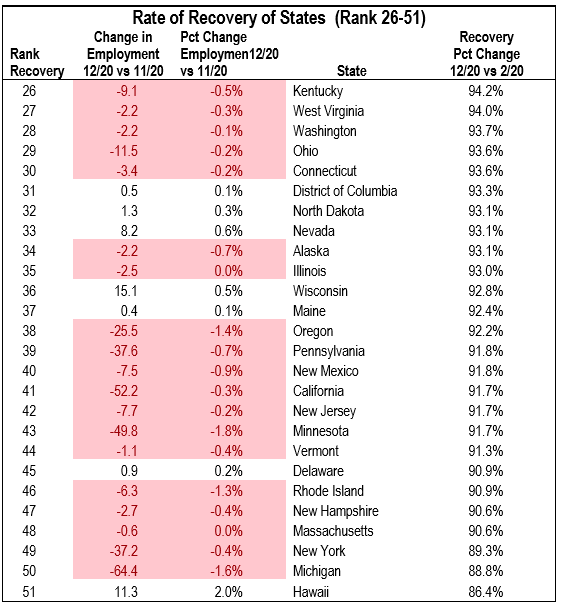
19 of 26 states lost jobs in the 26 to 51 ranking.

2021 Colorado Economic Forecast

The following forecast is from the 2021 cber.co Economic Forecast for the United States and Colorado.

Colorado’s real GDP growth rate for 2021 will be slightly higher than the U.S. rate It will return to its pre-pandemic value in late 2021.

Colorado employment posted declines in Q4 2020. The negative trend will continue in Q1 2021. Employment will return to its 2019 level in 2022.

Colorado’s unemployment rate will be greater than most states because unemployment claims will remain high.

Retail sales will rebound in 2021 as a result of pent-up demand. Sales will level off at pre-pandemic levels in 2022.

In 2021 and 2022, inflation will be slightly higher than the U.S. rate.

This image has an empty alt attribute; its file name is image-1.png

The number of passengers through DIA in 2020 was about half of the 2019 total. Domestic flights will return to their 2019 level in 2023. International flights will return to their pre-pandemic level in 2024.

There was an increase in the number of building permits issued in 2020. There will be more permits in 2021 as the population increases. Also, there is a need for affordable housing in the metro areas.

State regulations and reduced demand caused a decline in oil production in 2020. The production of oil will be flat in 2021 and 2022.

Colorado 2015 Job Growth – 9th Best Year In History of State

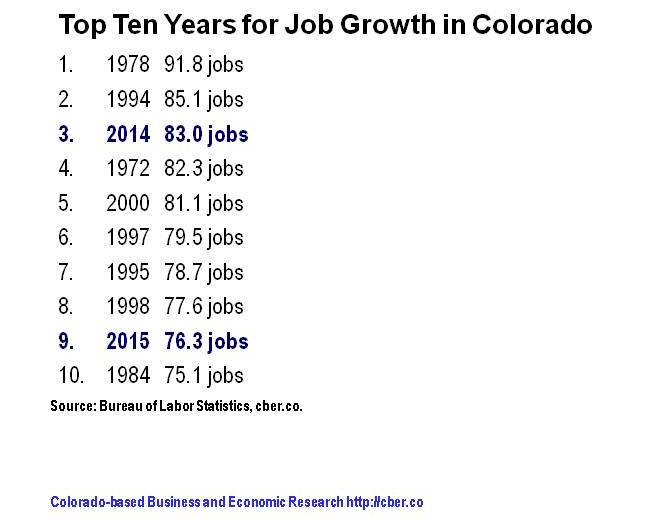
This past week, the Bureau of Labor Statistics (BLS) announced that Colorado job growth for 2014 was revised upwards to 83,000 and 2015 job growth was bumped up to 76,300. The respective rates of Colorado job growth were 3.5% in 2014 and 3.1% in 2015.

The upward benchmark revisions made 2014 the third strongest year of absolute job growth while 2015 was the ninth strongest year. This is the best news for the state since the Broncos won the Super Bowl on February 7th.

During 2014 the BLS monthly estimates reported the Colorado economy was adding jobs at a declining rate. This past year, BLS showed that Colorado was adding jobs at an even faster declining rate than in 2014. Thank goodness the BLS projection models were grossly flawed. the benchmark revisions match the activity that has taken place on the streets for the past two years.

In 2015 the five largest sectors/subsectors were:
• Health Care
• Retail
• Accommodations and Food Services
• Professional, Scientific and Technical Services
• Financial Activities
These five industries accounted for 45.8% of total employment. Total employment for 2015 was 2,541,200.

In 2015, the five largest sectors/subsectors for the number of jobs added were:
• Health Care
• Construction
• Accommodations and Food Services
• Professional, Scientific and Technical Services
• Retail
These five industries accounted for 60% of the jobs added. The job growth for these five industries combined was 4.1% in 2015.

Job growth in 2016 will be solid, but slightly off the pace of 2015. Growth will be slowed by low oil prices, the slow economy in China, and a strong dollar abroad.

For more details check out the review of Colorado 2015 job growth by clicking here. And there is much more. For more details check out the cber.co Colorado Economic 2016 Forecast.

2015 job growth

December Nonfarm Jobs Data for Colorado – Lackluster Growth

Today, BLS released December unemployment and employment data for Colorado. The seasonally adjusted unemployment rate for the state dropped to 3.5%. This is significantly lower than the U.S. rate of 5.0%.

Workers will benefit from lower unemployment rates, but lower rates are generally bad for businesses. In many cases companies are not able to fill critical positions. In turn they are forced to hire unqualified workers, pay overtime, or leave money on the table.

Nationally, 25 states posted declines in their December unemployment rates compared to November. There were increases in 14 states and no change in the rates for 11 states and the District of Columbia.

BLS reported lackluster nonfarm job growth in Colorado in December. This level of growth is in line with the pattern for U.S. seasonally adjusted nonfarm job growth. On a seasonally adjusted basis there were 10,700 more workers in December than November.

To that point, there was strong growth across the country. Nonfarm payroll employment increased in 36 states and the District of Columbia and it decreased in 14 states.

Looking at U.S. job growth on a quarterly basis there was weak employment growth in Q3, but strong growth in Q4. Given this trend nationally, it stands to reason that Colorado is following that same pattern. The data is in line with the level of activity on the streets.

The data indicates that Colorado added about 20,000 jobs in Q4, after no job growth in Q3.

On March 14th BLS will release its employment benchmark data for 2015. That data will more accurately tell the story of 2015 nonfarm job growth in Colorado.

nonfarm job growth


Colorado Unemployment Rate Drops to 3.6%

Earlier today the Bureau of Labor Statistics released employment and unemployment data  Colorado. It was a mixed blessing.

Unemployment

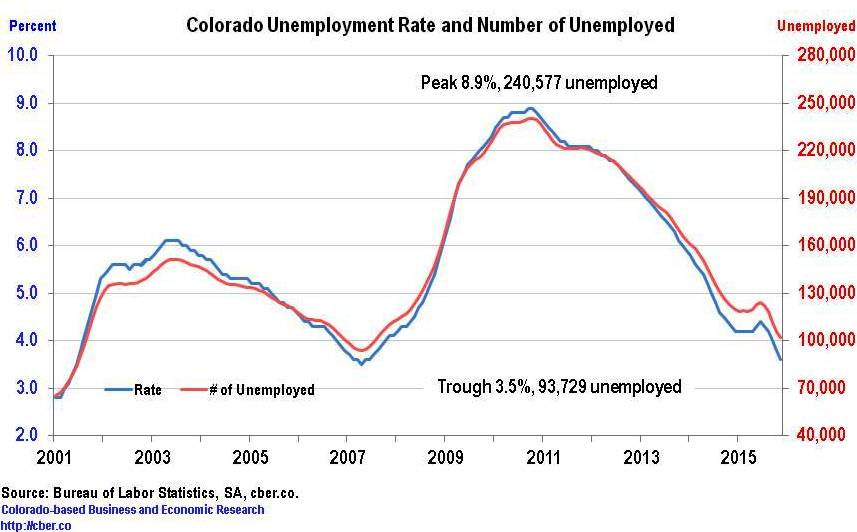
The Colorado unemployment rate for November dropped to 3.6%, down from 3.8% in October and 4.3% a year ago.

Nationally, the unemployment rate declined in 45 states compared to a year ago. By contrast only 27 states have rates lower than October. Colorado’s seasonally adjusted unemployment rate has been at or below 4.2% since December 2014 and there is little room for it to drop much further.

For job hunters this is good news as long as their skills match the available jobs. In addition, there will be upward wage pressure for occupations facing a shortage of qualified workers, such a construction, machining, and technicians.

On the other hand, the lower rate may be bad news for some companies. They may have greater difficulty finding qualified and clean workers. As a result they may have to pay higher wages for skilled positions. In addition, there is greater employee turnover during times of lower unemployment. This may decrease productivity and increase recruitment, hiring, and training costs. These increased costs will lead to lower profit margins and increased prices.

At the end of November there were 102,035 unemployed workers in Colorado. This is only 8,306 greater than the trough in May 2007 and 138,542 less than the peak in October 2010.

unemployment rate

Employment

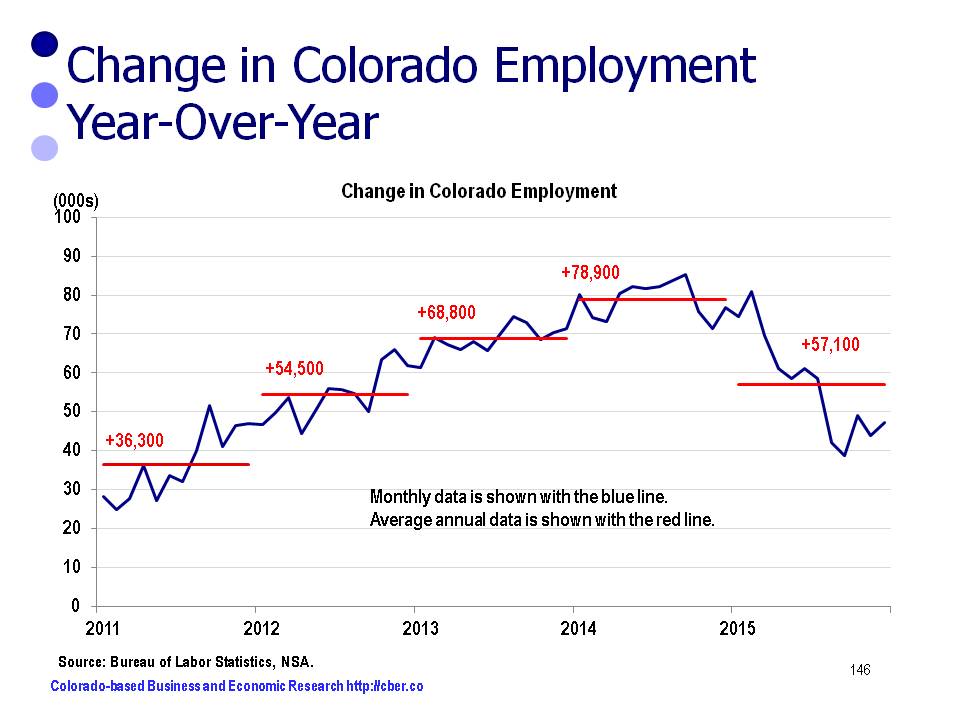
Despite the lower unemployment rate, November wage and salary job growth was lackluster, only 43,600 greater than a year ago. During the first half of 2015 Colorado employment increased at an average monthly rate of about 5,600 jobs. That average has dropped to 3,900 jobs during the second half of the year.

Even with the declining rate of job growth Colorado will add 55,000 to 60,000 jobs this year – prior to BLS benchmark revisions that will be released in March 2016. Those revisions may push 2015 average employment to 70,000+. The leading sectors for job growth are Health Care, Accommodations and Food Services, and Construction.

As the level of job growth has tapered off there has been an increase in the number of discussions about a recession; however; the Fed’s recent decision to hike interest rates suggests the economy is on solid footing and a recession will not occur in the short-term.

Colorado Real GDP Currently Stronger than U.S.

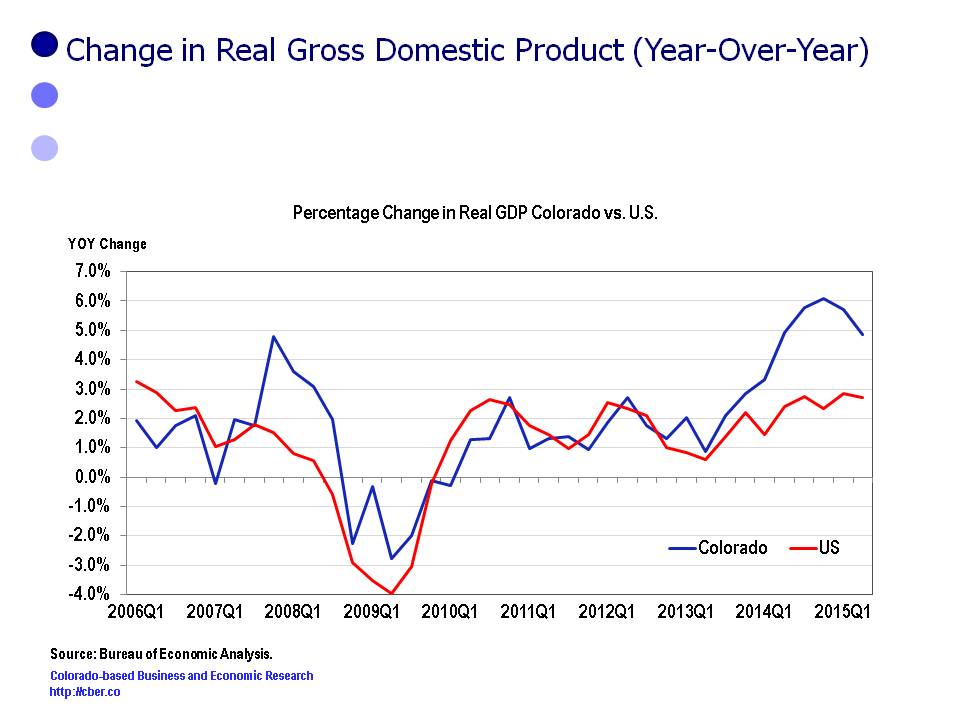
On December 10th, the Bureau of Economic Analysis (BEA) released quarterly GDP data for Colorado (2005 to Q2 2015). The Q2 year-over-year Real GDP for Colorado increased by 4.8% compared to 2.7% for the U.S.

The following trends are evident in the comparison of the year-over-year GDP data for Colorado and the U.S:
• The correlation coefficient between these two variables is .69
• The U.S. was stronger during the period Q1 2006 through Q1 2007.
• Colorado outperformed the U.S. significantly between Q2 2007 and Q4 2009 (This was during the recession).
• The U.S. was stronger coming out of the recession for most of 2010 – from Q1 2010 to Q3 2010.
• For the next two years, from Q4 2010 to Q3 2012 the rates of growth for Colorado and the U.S. were similar.
• From Q4 2012 to the present, the Colorado GDP expanded at a faster rate than the U.S. GDP. Beginning in Q1 2014 the gap between the two rates became greater as a result of the strength of the oil and gas industry in Colorado.
• That gap has since narrowed in 2015 as the price of oil has declined and oil and gas production has fallen off.

Colorado Real GDP


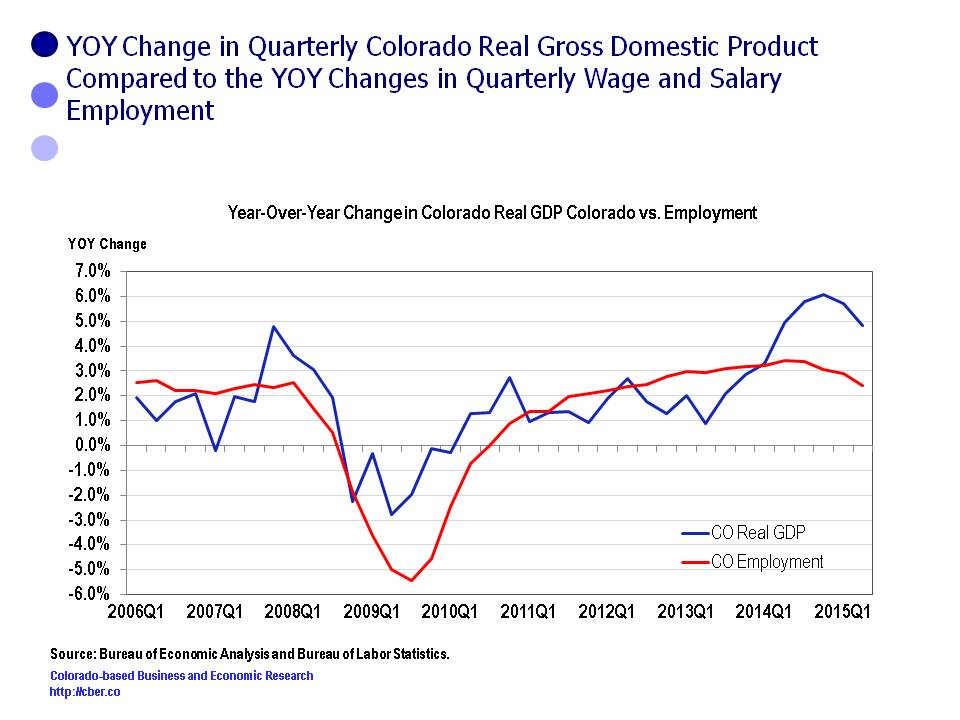
The following trends are evident in the comparison of the year-over-year GDP data for Colorado and the Colorado wage and salary employment:
• The correlation coefficient between these two variables is .72
• Employment grew at a higher rate from Q1 2006 to Q2 2007 than the Real GDP.
• Generally, the Real GDP grew at a greater rate from Q3 2007 to Q2 2011 than employment growth.
• From Q3 2011 to Q1 2014 the rate of growth for employment was generally greater than the Real GDP growth.
• From Q2 2014 to present the Real GDP grew at a greater rate than employment. This was in part largely because of the increase in oil and gas production in Colorado during this period.
• As the price for a barrel has dropped and oil and gas production has fallen off the gap between the two rates has declined. This caused a much greater decline in the growth rate for GDP than employment.

Colorado Real GDP

As can be seen the growth of the Colorado Real GDP and the U.S. Real GDP are closely related. As well, there is a strong relationship between the rate of growth for state Real GDP and employment.

Colorado Employment Increases by 13,000 jobs in October – Really?

On Friday November 20th, the BLS released wage and salary employment data for the states. The seasonally adjusted data indicated that Colorado employment increased by 13,000 jobs last month.

This is in sharp contrast to the previous three months. The data for July showed a gain of 600 jobs; an increase of 1,600 workers was posted in August, and a decline of 1,600 jobs showed up in September.

If these numbers prove to be accurate, it is reasonable to raise the question: Which is the anomaly – the posted employment for July through September or the employment for October?

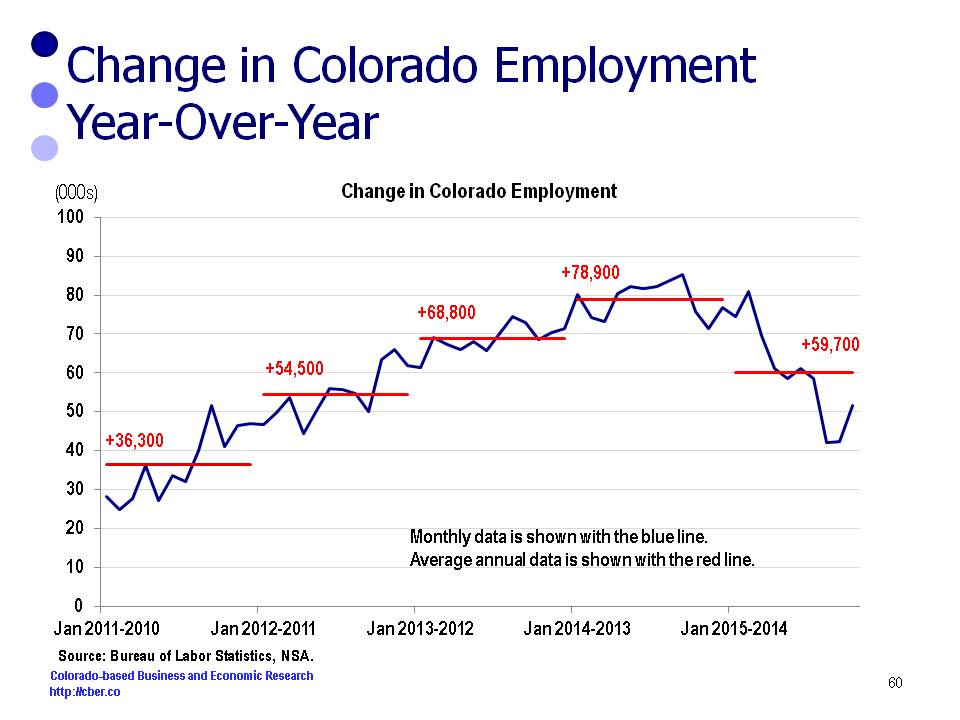
The non-seasonally adjusted data shows the Colorado employment continues to post solid job growth. Approximately 59,700 jobs will be added this year.

Colorado employment

The state’s job growth is led by the health care, construction, and accommodations and food services industries. There are fears that construction growth will be constrained by the lack of trained workers.

In addition, all of the state’s MSAs have shown solid to strong job growth. Local governments are continuing to spend and the state government is offering more tax incentives to out-of-state companies to move to Colorado.

A review of the top news stories for the past month echoes the sentiment of state leaders (Office of state Planning and Budgeting and Colorado Legislative Council) who say that the economy is on solid footing.

A majority of the coverage about the economy is very positive, however, there is one story that is unsettling. Union Pacific is laying off workers in Denver and BNSF is following suit in other states. While there is reason to be concerned about the individuals who are furloughed or laid off, there is greater concern because the railroads are facing decreased demand for shipments (coal, oil, agriculture products, and industrial products). This suggests there may be something fundamentally wrong with the overall economy, i.e. manufacturing may be woefully weak.

Another note of concern, the state of Colorado is expected to take in record levels of revenue, yet it will experience a budget shortfall for a variety of reasons beyond the control of state legislators. Special interest groups are addressing this issue, but there is limited interest in their efforts.

The bottom line is the Colorado economy is on solid footing, at least for the moment.


Q1 2015 Colorado Employment Posts Solid Growth

On April 21, the Bureau of Labor Statistics released its monthly wage and salary employment data for Colorado. Job growth for Q1 2015 was 3.1%, or 74,800 jobs, greater than Q1 2014. The Q1 2015 growth is down slightly from the 2014 annual average of 78,900 jobs; however it is in line with the 2015 cber. co forecast that calls for an increase of 73,000 to 79,000 jobs, or job growth at a rate of 3.0% to 3.2%.

The preliminary March 2015 Colorado employment was 68,900 jobs greater than the March 2014 value. The year-over-previous-year increase for February was 80,800 jobs. It was 74,600 jobs for January.

The lower level of growth in March does not necessarily signify a downward trend. Most likely it is a reflection of volatility related to changes in the extractive industries.

About 67.0% of total jobs added were in the Health Care; Accommodations and Food Services; Construction; Profesional, Scientific, and Technical Services (PST); and Manufacturing sectors.

Approximately 21.3% of all jobs added were in Leisure and Hospitality; however, the BLS estimate model has most likely overstated this YTD contribution.

About 9.9% of total jobs added were in the PST, Manufacturing, and Information sectors. These sectors are the source of primary and advanced technology jobs.

Colorado Employment vs. U.S. Employment

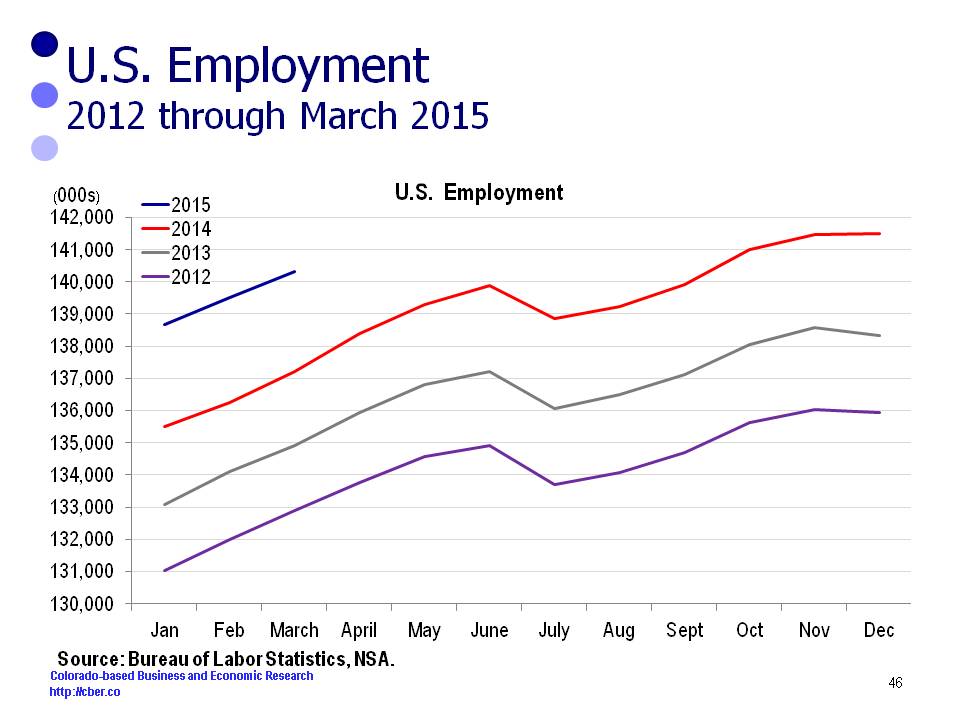
Nationally, average employment for Q1 2015 is about 2,265,133 jobs greater than Q1 2014 employment. While this rate of growth is solid, the Q1 value is less than the average number of jobs added during 2014 (2,313,033). A brutal winter in parts of the country prevented employment and output during the first quarter from being stronger.

The cber.co forecast for U.S. job growth in 2015 is 2,600,000 workers. Stronger job growth is expected in the second half of the year.

us employment Q1 2015

Expect Solid Growth in Colorado Wage and Salary Employment

The U.S. economy remains on solid footing  in anticipation of the upcoming release of BLS Colorado wage and salary employment data.

U.S. Employment and GDP

Earlier this month BLS reported the U.S. added 126,000 jobs in March compared to February. This was the weakest level of month-over-previous-month job growth for the seasonally adjusted data since 2013. Despite the slower rate of growth for March 2015, U.S. employment for March is about 2.29 million jobs greater than March 2014..

Currently, Colorado wage and salary employment is about 1.8% of the U.S. total. About 2.8% of U.S. job growth can be attributed to Colorado.

Most economists think U.S. Real GDP growth will be in the neighborhood of 2.5% to 3.0% this year. This past week The Conference Board bumped its 2015 projection for the U.S. output growth up to 2.9% based on projections for stronger personal consumption. This is notable given their conservative estimates over the past ten years. Meanwhile, other economists have bumped their forecasts down to the range of 2.5% to 3.0%

Stronger output growth should translate into a greater number of wage and salary workers. In other words, the slower rate of U.S. job growth in March appears to be a glitch rather than the start of a downward trend. The strong rate of U.S. job and output growth will ensure that in the short term Colorado with continue to add jobs at a rate similar to the past twelve months.

U.S. and Colorado Unemployment Rates

In March the U.S. unemployment rate remained steady at 5.5%, but down from 6.6% a year ago.

The U.S. Congressional Budget Office has indicated the natural rate of unemployment is currently 5.2%. The natural rate is the point of equilibrium or the rate at which an economy will operate most efficiently.

When the unemployment rate drops below the natural rate there will be upward wage pressures and companies will be challenged to find qualified workers. The economy will operate inefficiently for different reasons than when the rate of unemployment is above the natural rate.

In Colorado, the February unemployment rate of 4.2% was well below the U.S. rate. Some Colorado industries are currently experiencing symptoms of an economy that is operating below the natural rate of unemployment. They are experiencing difficulty finding qualified workers in select occupations. In addition, there are upward wage pressures in industries such as construction and agriculture. Anecdotal evidence suggests some companies are not able to find workers even when they pay higher wages.

The state’s rate of unemployment is expected to remain below 4.5% in the near-term, although there are concerns the layoffs caused by lower oil prices will cause an increase in the unemployment rate. At the state level the direct impact of oil and gas layoffs may not have a major impact on total state employment and unemployment data, but it will definitely affect regions where the oil and gas industry has played a significant role in the economy, such as Weld and Garfield counties.

Expect continued solid growth in Colorado wage and salary employment in the short-term.

2015 cber.co Forecast – Fine Tuning the Volatile Category

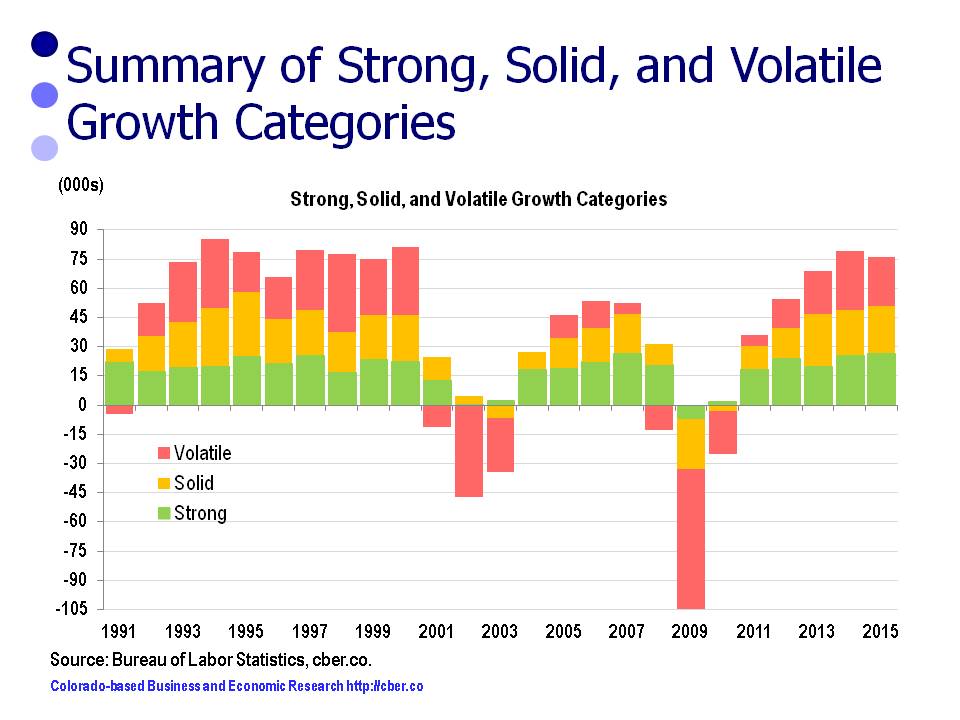
In preparing its annual forecast, cber.co divides the NAICS sectors into three categories. This portfolio approach makes it easy to see that some sectors consistently create jobs at a higher rate of growth, some show solid growth, and others are more volatile. Ultimately, the volatile category tends to have a greater influence on the magnitude of change in total job growth than the sectors with steady growth. In March 2015 BLS released its benchmark revision of the 2014 data. The changes were more significant than usual.

As a result  the 2015 cber.co forecast was fine-tuned to have a better understanding of categories and sectors that were driving the economy. This brief discussion highlights the revisions to the 2015 cber.co forecast. This post will evaluate the Volatile Category.

The Volatile Category

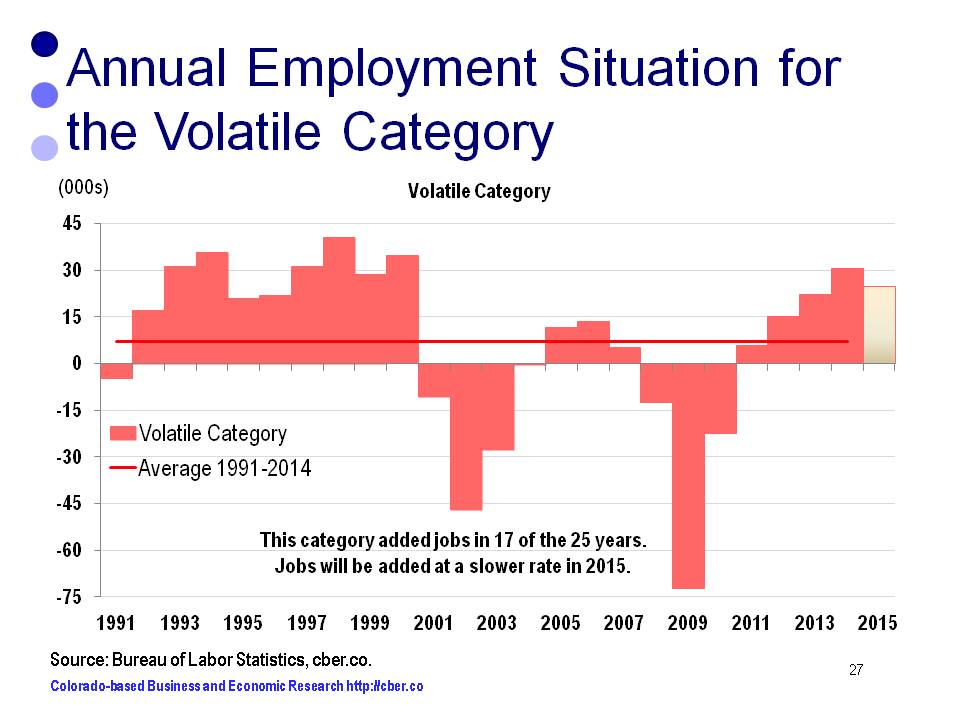
Over the past two decades the sectors listed below were the primary source of volatility in total employment.

The sectors are:

  • Natural Resources and Mining
  • Construction
  • Manufacturing
  • Transportation, Warehousing, and Utilities
  • Employment Services
  • Financial Activities
  • Information
  • Federal Government

Total employment for this category was:

  • 1994  625,400 workers, 35.6% of total employment
  • 2004  716,000 workers, 32.8% of total employment
  • 2014  713,000 workers, 29.0% of total employment

2015 cber.co forecast

Estimated Job Growth

As can be seen below there is a significant difference between the original estimates for 2014 (January 11) and Benchmark revisions for 2014 (March 27). BLS significantly underestimated growth in this category in 2014.

The original Volatile Category estimates/forecast (January 11 Forecast) was + 23,000 to 27,000 Employees.

  • 19,800 jobs added in 2013
  • 25,600 jobs added in 2014
  • 706,100 employees in 2014

In 2015 between 23,000 and 27,000 jobs will be added, at a rate of 3.3% to 3.7%. This rate of growth is slightly slower than 2014.

The updated Volatile Category estimates/ forecasts, after benchmark revisions (March 27 Forecast) was + 23,000 to 27,000 Employees.

  • 22,200 jobs added in 2013
  • 30,000 jobs added in 2014
  • 713,000 employees in 2014

In 2015, between 23,000 and 27,000 workers will be added at a rate of 3.2% to 3.8%. Despite the significant underestimate in 2014, the forecast for 2015 was unchanged.

The recalibration of the 2015 forecast resulted in the following changes:
• The Strong Growth Category was revised upward by 4,500.
• The Solid Growth Category was revised downward by 1,500.
• The Volatile Category remained unchanged.
• The net change to the 2015 forecast was an upward revision of 3,000; however, the 2015 forecast is for total growth slightly below the 2014 total.

The change in the mix of jobs being added is equally as important as the change in the number of jobs being added. For further information on the cber.co forecasts click here.

2015 cber.co forecast