The primary focus of most state economic forecasts is to project total state employment.
Over the years cber.co has worked on various Colorado economic forecasts – some were multi-year projections, others were one-year annual totals, and some projected sector totals that were added to derive the state total. The latter approach introduced numerous variables for error.
cber.co feels the most accurate forecast is achieved by projecting total employment based on projections for three categories of sectors. Sectors are grouped into three categories based on their past performance.
Projections for the categories and overall employment are based on trends, feedback from business leaders, economic developers, and other economists. The sum of these categories is then used to estimate overall total employment.
Minor adjustments are made and final forecasts are produced for three scenarios. The most likely scenario is used as the final cber.co forecast. This final step helps create a better understanding of upside and downside risk associated with the forecast.
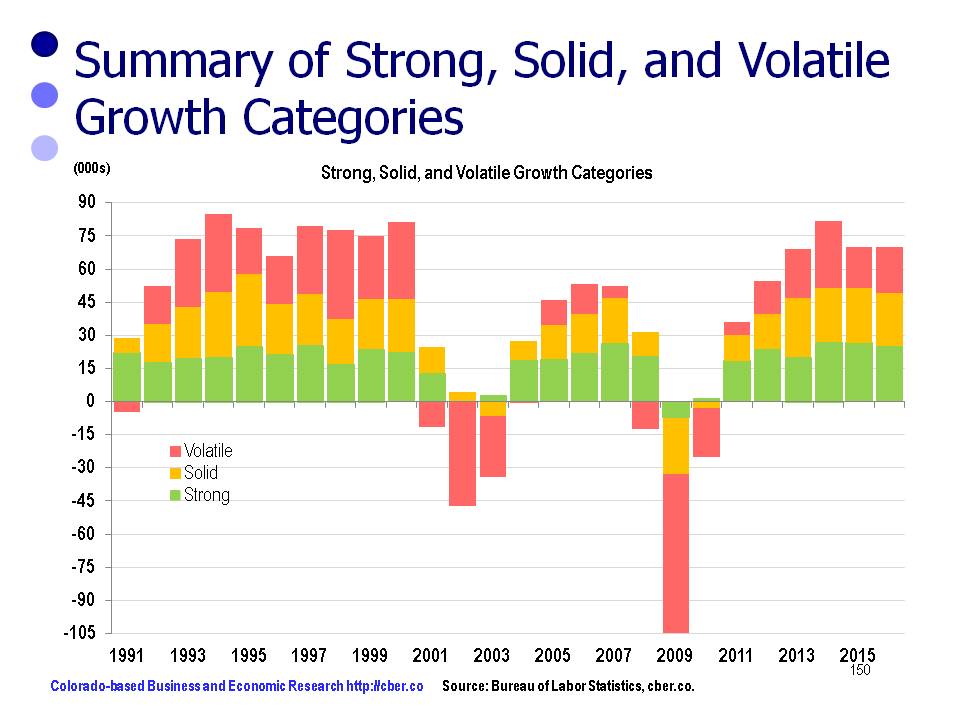
This portfolio approach has made it easy to see that some sectors consistently create jobs at a higher rate of growth, some show solid growth, and others are more volatile. Ultimately, the volatile category tends to have a greater influence on the change in total job growth than the sectors with steady growth.
The most difficult challenge in producing the 2016 forecast was to estimate the 2015 data. The methodology used by BLS to produce the preliminary nonfarm data was flawed. Having said that, the growth of the Strong, Solid, and Volatile Growth Categories will be similar to 2015; however, the total will be slightly less.
The Strong Growth Category of sectors (green) has performed consistently over time. The category added jobs as expected in 2015. Sectors in this category include:
• Professional, Scientific, and Technical Services
• Management of Companies and Enterprises
• Administrative – Business to Business (Not Employment Services)
• Private Education
• Health Care
• Arts, Entertainment, and Recreation
• Other Services.
Recent and projected employment changes for the Strong Growth Category follow:
• 2012 24,000
• 2013 20,100
• 2014 26,900
• 2015 26,700
• 2016 24,000 to 26,000
The 2016 projected rate of growth will be 2.9% to 3.2%, similar to the last two years.
Over time, the Solid Growth Category of sectors (yellow) has been more volatile than the Strong Growth Category and it has grown at a slower pace. In 2015, this category performed as expected. Sectors in this category include:
• Wholesale Trade
• Retail Trade
• State (Not Higher Education)
• Higher Education
• Local (Not K-12 Education)
• K-12 Education
• Accommodations and Food Services
Recent and projected employment changes for the Solid Growth Category follow:
• 2012 15,600
• 2013 26,600
• 2014 24,500
• 2015 24,700
• 2016 23,000 to 25,000
The 2016 projected rate of growth will be 2.3% to 2.5%, similar to the past two years.
Finally, the Volatile Category of sectors (red) was a significant source of growth in 2013 and 2014, but the number of jobs added in 2015 fell off significantly. Sectors in this category include:
• Natural Resources and Mining
• Construction
• Manufacturing
• Transportation, Warehousing, and Utilities
• Employment Services
• Financial Activities
• Information
• Federal Government
Recent and projected employment changes for the Volatile Category follow:
• 2012 15,100
• 2013 22,300
• 2014 30,400
• 2015 21,000
• 2016 20,000 to 22,000.
The 2016 projected rate of growth will be 2.7% to 3.0%, similar to 2015.
The 2016 cber.co Colorado economic forecast portends the state will add 67,000 to 73,000 workers and job growth will be 2.7% to 2.9%.
For additional information about the 2016 cber.co Colorado Economic Forecast click here.
