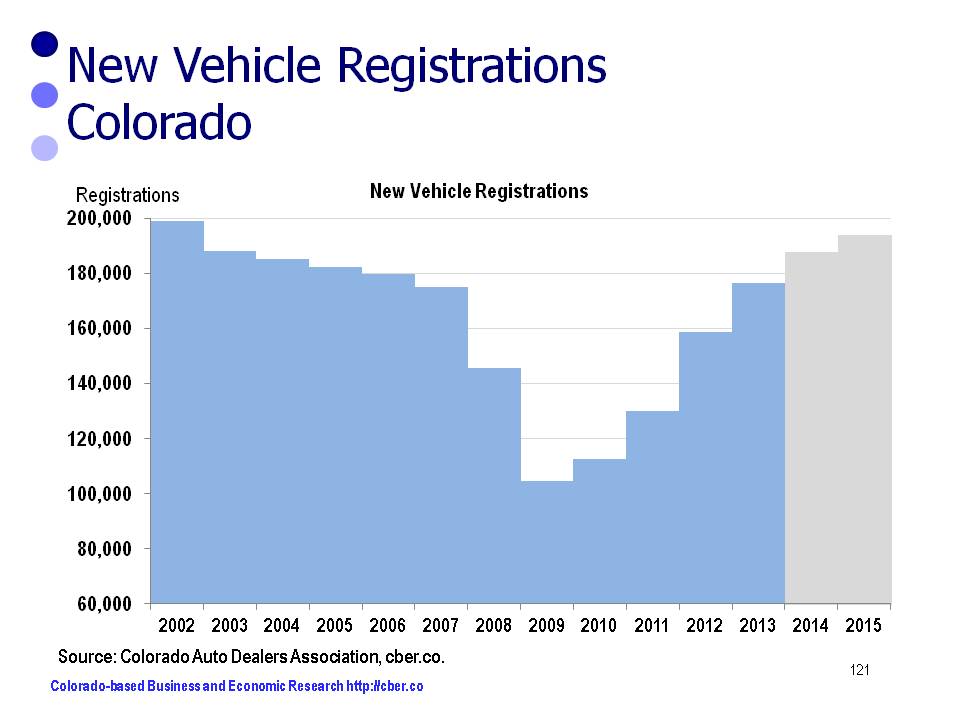
Colorado New Car Registrations Top Record in 2015

Colorado auto dealers had a banner year in 2015 reaching a record 203,471 new car registrations. This topped the previous high of 198,910 in 2002. Auto sales were driven by low gasoline prices, easy access to credit and low interest rates. In addition, Colorado experienced strong net migration and solid employment growth in 2015.

After peaking in 2002, the number of new registrations gradually tapered off until 2007. At that point they plummeted to 104,687 in 2009.

The number of new car registrations has almost doubled between 2009 and 2015.

Colorado New Car Registrations

About 35% of the 2015 new registrations were light trucks and 65% were autos. Light truck new registrations increased by 15.3% compared to only 3.5% for cars.

Category 2014 2015 % Change
Total 188,416 203,471 8.0%
Cars 73,112 70,561 3.5%
Light Trucks 115,304 "132 910" 15.3%

Almost 45% of the 2015 new registrations were for Japanese brands and 39% were for the top three Detriot brands. Slightly more than 10% were European brands and the remaining 6% were Korean brands.

The new registrations for Detroit and European brands increased by almost 10%, while the Japanese brands increased by slightly more than 7.4%. There was a decline in the number of new registrations for the Korean Brands.

Category 2014 2015 % Change
Detroit Three Brands 71,962 79,113 9.9%
European Brands 19,450 21,293 9.5%
Japanese Brands 84,896 91,154 7.4%
Korean Brands 12,108 11,911 -1.6%

The vehicle segments with the largest gains in market share, 2015 vs. 2014, were compact and compact luxury SUVs. The largest losers were standard mid-size cars and sub-compact cars.

Winners – 2015 vs. 2014

Category Change in Market Share (points)
Compact SUV 1.4
Compact luxury SUV 0.9
Compact pickup 0.8
Full size pickup 0.7
Full size crossover SUV 0.4
Full size van 0.2
Full size luxury SUV 0.1
Mid-size crossover SUV 0.1
Minivan 0.1

Losers – 2015 vs. 2014

Category Change in Market Share (points)
Sub-compact car -1.5%
Standard mid-sized care -1.5%
Entry car -0.7%
Large mid-size car -0.3%
Luxury car -0.3%
Mid-sized luxury SUV -0.2%
Sport-compact car -0.1%

The categories where there was no change in leadership were:
• Near luxury car
• Full-size SUV
• Mid-size SUV
• Sports car

If the economy stays healthy, car sales will likely show record growth in new car registrations again in 2016.

The source for the data in this post is the Colorado Auto Dealers Association.

The Economic Impact of the Colorado Retail Trade Industry

This post highlights the economic impact of the Colorado retail trade industry on the economies of Colorado and its twelve major metro counties: Adams, Arapahoe, Boulder, Broomfield, Denver, Douglas, El Paso, Jefferson, Larimer, Mesa, Pueblo, and Weld. It was prepared for the Economic Development Council of Colorado in the Spring of 2015.

Retail Trade is classified in the NAICS 44-45 category. The Retail Trade categories used in this report and their IMPLAN sector numbers are listed below. As can be seen Retail Trade includes everybody from American Furniture Warehouse to Burritos to Go in Broomfield.

320 Retail Stores – Motor vehicle and parts
321 Retail Stores – Furniture and home furnishings
322 Retail Stores – Electronics and appliances
323 Retail Stores – Building material and garden supply
324 Retail Stores – Food and beverage
325 Retail Stores – Health and personal care
326 Retail Stores – Gasoline stations
327 Retail Stores – Clothing and clothing accessories
328 Retail Stores – Sporting goods, hobby, book and music
329 Retail Stores – General merchandise
330 Retail Stores – Miscellaneous
331 Retail Nonstores – Direct and electronic sales

economic impact of the colorado retail trade industry

The key employment findings of the report are:
• There are 309,924 direct employees in the industry, including sole proprietors. This is 9.6% of total state employment.
• Overall, there are 439,315 total (direct, indirect, and induced) employees supported by the Colorado Retail Trade Industry.
• The counties with the greatest number of Direct Retail Trade employees are El Paso, Arapahoe, Denver, and Jefferson.

The key output findings of the report are:
• Average GRP per employee for Colorado is $90,658. Average Retail Direct GRP per employee is $68,404.
• The Retail Trade Sector contributes about $21.2 billion, or 7.2%, to the Direct Colorado GRP, $293 billion.
• Overall, the Retail Trade Sector supports $38.3 billion in GRP, or economic activity.
• The counties with the greatest Direct Retail Output are Arapahoe, El Paso, and Denver.
• The counties with the greatest Direct GRP per Direct Employee are Denver, Arapahoe, Boulder.

The key wage findings of the report are:
• The total direct wages are $10.1 billion, or 5.6% of total wages. Average Direct Retail Wages are lower than the average for all industries.
• Overall, the retail trade industry supports total wages of $16.6 billion.
• The counties with the highest average annual wages for Direct Retail are Denver, Arapahoe, and Jefferson.

Other key points follow:
• The Retail Trade Sector is a major employer in Colorado.
• The Bureau of Labor Statistics reports that Colorado has 175,355 establishments. There are 17,035 establishments in the Retail Trade Sector. This is 9.7% of total employment.
• Average wages and output are below the average for other industries.
• It is difficult for states to develop a competency in the Retail Trade sector even though many states and municipalities rely on retail sales taxes to fund their operations. The Colorado Retail Trade Sector has a location quotient slightly less than 1.0.

For a copy of the report click here.

Colorado New Vehicle Registrations Trend Upward

One of many signs of a solid Colorado economy is the growth in the number of new vehicle registrations. Increased registrations are usually a function of a growing population and solid job growth.

New registrations are also stimulated by low interest rates and higher consumer confidence. As well, lower gas prices may fuel the sales of models that have lower gas mileage, such as large pickups or four-wheel drive vehicles.

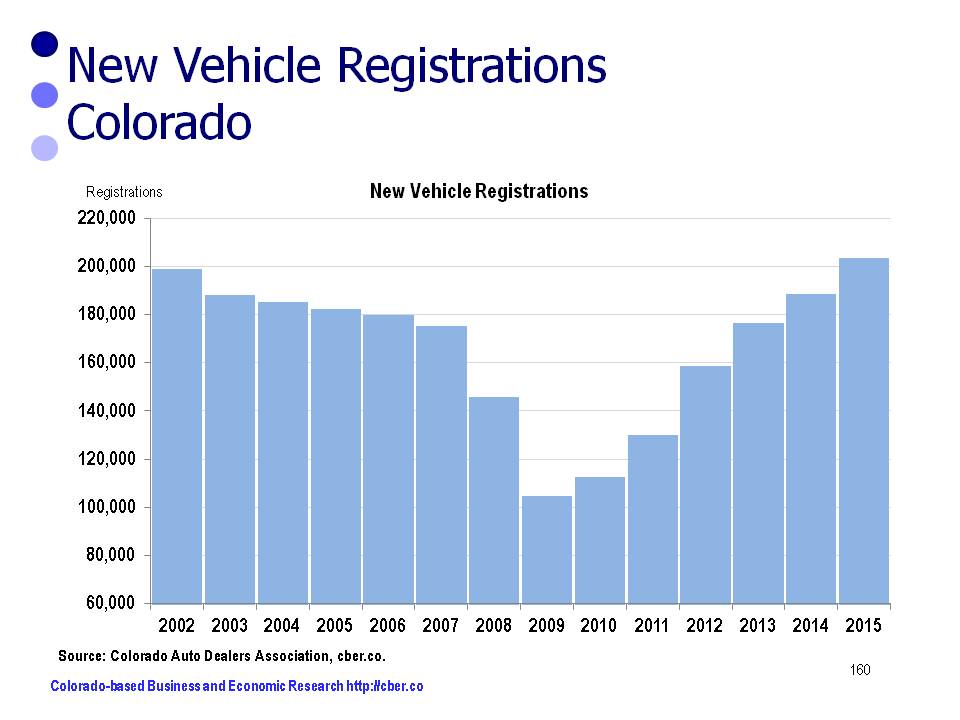
The number of new vehicle registrations in Colorado decreased from 198,910 in 2002 to 104,687 in 2009. Even though there was a steady increase in the state population, back-to-back recessions caused the sharp decline in registrations.

A solid recovery began in 2010 followed by double digit growth in 2011, 2012, and 2013. In 2013 there were 176,433 new vehicle registrations.

The estimated rate of growth will slow to 6.5% in2014 with 187,901 registrations. In 2015 there will be a 3.2% growth rate to 194,000 registrations. The “slowdown” in the rate of growth will occur as sales will increase at a more sustainable rate. In addition, uncertainty in the extractive industries will cause some consumers to be more cautious.

new vehicle registrations

Holiday Retail Sales will be Strong – Grinch to Visit Elsewhere

noGrinchnoThe outlook for holiday retail sales is upbeat. It is doubtful the Grinch will be visiting Colorado this Christmas season. Most likely he will be in parts of Europe, Japan, and Mexico where the economy is not as strong.

The National Retail Federation expects holiday sales to increase by 4.1% this November and December compared to a 3.1% increase last year. Over the past 10 years, average holiday growth has been about 2.9%. In other words, lower unemployment rates and an improved economy means retail trade sales this holiday season will be above average.

Sales in November and December (excluding autos, gasoline, and restaurant sales) represent about 19.2% of the annual total. Nationally, up to 800,000 workers will be hired on a seasonal basis for November and December.  Online sales will increase by 8% to 11%.

The optimistic expectations for national retail sales bode well for Colorado. The Colorado Legislative Council and the Office of State Planning and Budgeting expect Colorado’s 2014 annual retail sales to be 6.0% greater than last year. Given the strength of the state economy, holiday sales should easily exceed the national projected growth rate of 4.1% and may exceed the 6.0% projection for the year.

Colorado average retail trade employment in November and December is about 10,000 workers greater than the average for the other 10 months of the year. A similar increase in retail employment should be expected in 2014.

Over the past decade consumers have become accustomed to deep discounting during the holiday season. Despite an outlook for a brisk holiday season, there will likely be a sufficient number of markdowns and bargain basement deals. As the t-shirts on consumers in the local mall say, “Stay Calm and Shop On” or is it “Stay Calm and Shop Online.”

Happy shopping!

Slow Retail Trade Recovery Reflects Problems Elsewhere

Retail trade sales are critical to state and local governments because taxes from sales provide significant revenue. In the case of local governments, sales tax revenue may account for two-thirds of total funding.

The chart (below) shows cumulative retail trade sales from 2008 through the first four months of 2012. The chart shows how sales dropped off in 2009 and 2010, but returned to 2008 levels in 2011. The data is not adjusted for inflation, so the recovered is slightly lengthier than shown in the chart. (The CPI for Colorado for these years is 3.9% for 2008; -0.6% for 2009; 1.9% for 2010; 3.7% for 2011, and 2.5% is estimated for 2012.)

Retail trade data for the first four months of 2012 show that sales are about 2.2% ahead of the 2008 four-month level and 7.7% above the 2011 four-month level. If the latter growth rate is maintained for the final eight months of the year, retail trade sales will exceed $71 million in 2012.

For additional details on the economy click here or go to https://cber.co/

©Copyright 2011 by CBER.

Warmer Weather – A Source of Job Creation?

Recently, a local economist hypothesized that the recent strength of the Colorado economy was correlated with a warmer winter. The rationale for this hypothesis was that warmer weather may have benefitted outdoor sports such as golf courses, biking, rollerblading, and so forth. In addition, the economist surmised that retail sales would be stronger because warmer weather was more conducive to shopping and increased construction activity.

On one hand, the warmer weather theory sounded plausible because the weather “seemed” milder this winter, but on the other hand it sounded like it was full of hot air.

Premise 1 – The winter was warmer.
If heating degree days are the defining factor for how cold a winter is, then the period October 2011 through March 2012 was negligibly colder than the prior year. For this six month period, the most recent October, December, and February were colder, the two Novembers were similar, and January and March were warmer this year. (A larger number means it is colder, more heat is needed to heat a building).

October 2010         174 heating degree days
November 2010     645 heating degree days
December 2010     789 heating degree days
January 2011          925 heating degree days
February 2011        863 heating degree days
March 2011             513 heating degree days
Total                      3,909 heating degree days

October 2011          312 heating degree days
November 2011      636 heating degree days
December 2011  1,058 heating degree days
January 2012           763 heating degree days
February 2012         935 heating degree days
March 2012              364 heating degree days
Total                       4,068 heating degree days

Possibly it seemed warmer, because there didn’t seem to be snow on the ground that often. A comparison of snowfall for the metro area shows that there was 2.5 times as much snow this past winter as the prior year.

October 2010         none
November 2010    1.5 inches
December 2010    3.3 inches
January 2011         8.0 inches
February 2011       5.3 inches
March 2011            2.5 inches
Total                      20.6 inches

October 2011         8.5 inches
November 2011    4.5 inches
December 2011 16.5 inches
January 2012        4.9 inches
February 2012    20.2 inches
March 2012         none
Total                     54.6 inches

It is truly a shocker to learn that the past winter was actually colder and wetter than the previous year. The timing of the storms, the lack of wind, or some other factor must have created the perception that it was warmer this past winter.

Even with greater snowfall in the metro area, snowpack is below average and 95% of Colorado is reportedly in drought conditions. Two significant forest fires have occurred and summer hasn’t arrived.

Conclusion: Premise 1 is FALSE.

Premise 2 – The warm weather resulted in increased participation for local sporting activities.
There is no easy way to prove this. HOWEVER, the lack of snow in the ski country, at the right times, was in part responsible for diminished lift ticket sales – a decrease of more than 7%. Ouch that hurts! Not only did the lack of snow hurt ski business it will play havoc with rafting businesses this summer.

Conclusion: #2 Possibly true in the metro areas, FALSE in ski areas.

Premise 3 – Warm weather means stronger retail sales.
This is an interesting concept that is difficult to prove. Cold and snowy weather on key shopping days have reduced retail sales during past Christmas shopping seasons, but there is no evidence that warmer weather has increased trade sales. Retail sales are noticeably higher compared to a year ago, but that is attributed to more people working than last year at this time. And in some cases, sales are higher because retailers have finally been able to raise prices. Sales may be higher in the metro areas, but they are probably below expectations in the ski country because of reduced traffic.

Conclusion: #3 – Possibly true in the metro area, FALSE in ski areas.

Premise 4 – Warm weather means increased construction activity.
For the six month period October to March there were 114,500 construction workers this year versus 113,300 last year. Last June, the Construction sector finally bottomed out from the 2007 recession and has been slowly adding jobs since. The big boost of construction jobs in January is more likely a result of improved economic conditions than warmer weather.

Conclusion:#4 – Inconclusive.

One of the fun things about economics is dissecting “grassy knoll” or “warmer weather” theories to see if they are true, partially true, or false. In this case, it is highly improbable that the “warmer” weather was a source of net job creation. The gains in revenue at Denver golf courses, bike shops, and shopping malls were offset by losses on the ski slopes and sales in mountain t-shirt shops, hotels, and restaurants. The warmer weather will also result in a dismal rafting season and increased costs for fighting forest fires.

For a more complete update on the recovery of the Colorado economy, go to https://cber.co/.

©Copyright 2011 by CBER.
Will the Grinch Dictate Retail Sales this Holiday Season?

It is the time of the year when retail stores pull out their Christmas goods and decorations in anticipation of the upcoming holiday season. At the same time, trade associations and economists dust off their Grinchmeters to project consumer’s willingness to share in the spirit of giving.

Recently, the National Retail Federation (NRF) released their forecast stating that 2011 holiday sales will post a 2.8% increase over last year and the total will reach $465.8 billion. While the increase is weak compared to last year’s increase of 5.6%, it is comparable to the average for the past 10 years. Nationally, retailers are expected to hire a half million seasonal workers this season.

The following factors may point to a better than average season.
• There have been 14 back-to-back months of increased retail sales and momentum is established.
• More people are working than a year ago.
• There is a lower level of household debt, although a portion of that decline is a result of foreclosures.
• The Grinch may get lost this Christmas season.

On the other hand, the following factors may cause sales to be average or worse.
• Lack of consumer confidence.
• Lack of confidence by business leaders.
• Higher inflation, particularly higher gas and food prices.
• Lack of wage and job growth.
• A return of extreme volatility in the stock market.
• Uncertainty associated with the 2012 elections.
• Consumer shopping patterns have been altered.
o Consumers are spending less time in stores, which reduces impulse sales.
o Increased Internet sales.
o Consumers have been trained by retailers to expect sales or heavy discounting.
o Consumers have learned that lower levels of gift giving are acceptable.
o Some consumers have chosen to give gift cards rather than purchase a gift.
• In an article by the New York Times (A Contradiction in the Cargo), the volume(August imports) at the country’s 5 busiest container ports are flat or below the same period in 2010.
o Los Angeles, down 5.75%
o Long Beach, down 14.2% from August 2010; a decline of 15% is projected for September.
o Savannah, GA, down 4%.
o Oakland, down 0.9%
o New-New Jersey, imports were flat.
Fewer imports may signal that retailers are projecting only modest gains in sales this season.

In short, it will be a challenging season for retailers, but not necessarily a buyer’s season for consumers.

Note: The NRF defines “the holiday season” as November and December. Sales generated during these two months are often a significant portion of the annual total for many businesses. The NRF also states that retail sales include most traditional retail categories – discounters, department stores, grocery stores, and specialty stores. Automotive dealers, gas stations, and restaurants are not included.

©Copyright 2011 by CBER.

10 Years After 9/11 – Discounted and Marked Down

The Retail Sector is a mixed blessing for Colorado. On one hand it is one of the larger sectors, providing jobs for a number of people. As well, retail sales taxes are source of revenue for municipalities and state government. In fact, taxes generated from retail sales are so important that some municipalities are strategically zoned so their borders are lined with retail facilities. It is their intent to prevent leakage from their area and increase sales (and taxes) from neighboring cities and counties.

The retail sector did not fare well during the Lost Decade.

In 2000, Colorado retail employment was 245,200. Ten years later, it was 235,900, or a decline of 9,400 jobs. In 2010, the Retail Sector accounted for 10.6% of total state workers.

During this same period, retail trade sales increased from $52.2 billion in 2000 to $61.1 billion in 2010. It should be noted that sales peaked at $67.3 billion in 2007 before plummeting in 2008. They bottomed out at $58.5 billion in 2009. While sales post an increase of $8.9 billion over this 10-year period, the gain is not adjusted for inflation.

The annualized rate of growth for sales is 1.6%. The annualized rate of growth for Colorado inflation was 2.0%. Not only did the sector lose employment during the Lost Decade, there was a decrease in sales adjusted for inflation.

In short, the Lost Decade has been difficult for both retailers and the government organizations that rely on sales tax revenues to support their operations.

©Copyright 2011 by CBER.