Which has the Top Economy – Colorado, Utah, Washington?

There are frequent references in the local media about how Colorado is one of the top state economies in the country. And it is!

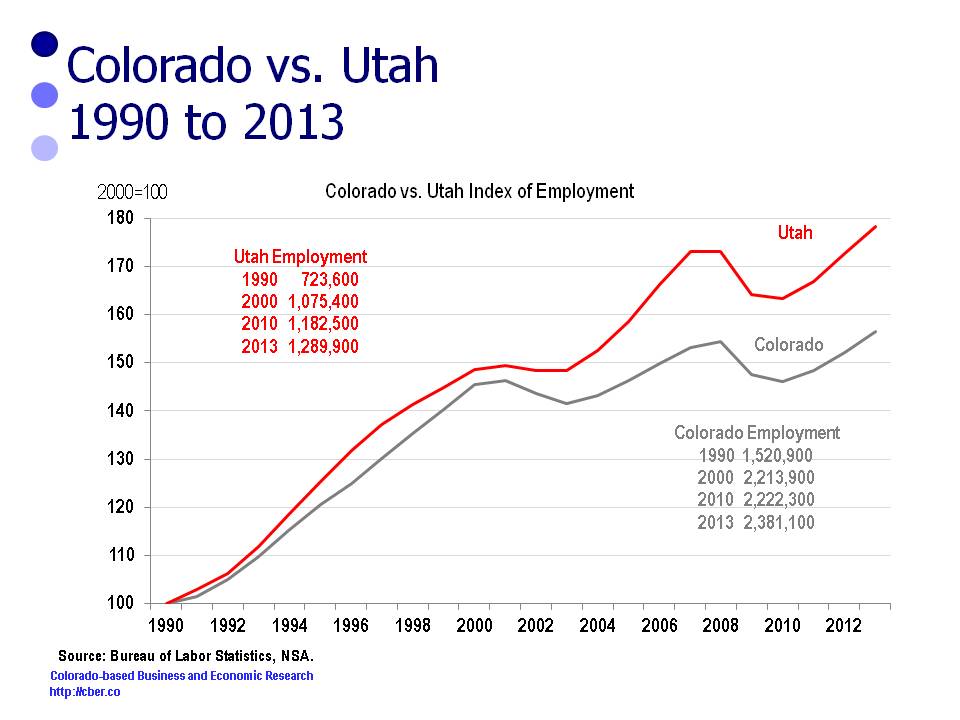
There are many metrics that can be used to compare state economies. The two best metrics are the growth rates for Real GDP and employment. In this post we look at these metrics from 2005 to the present for Colorado, Utah, Washington and the U.S.
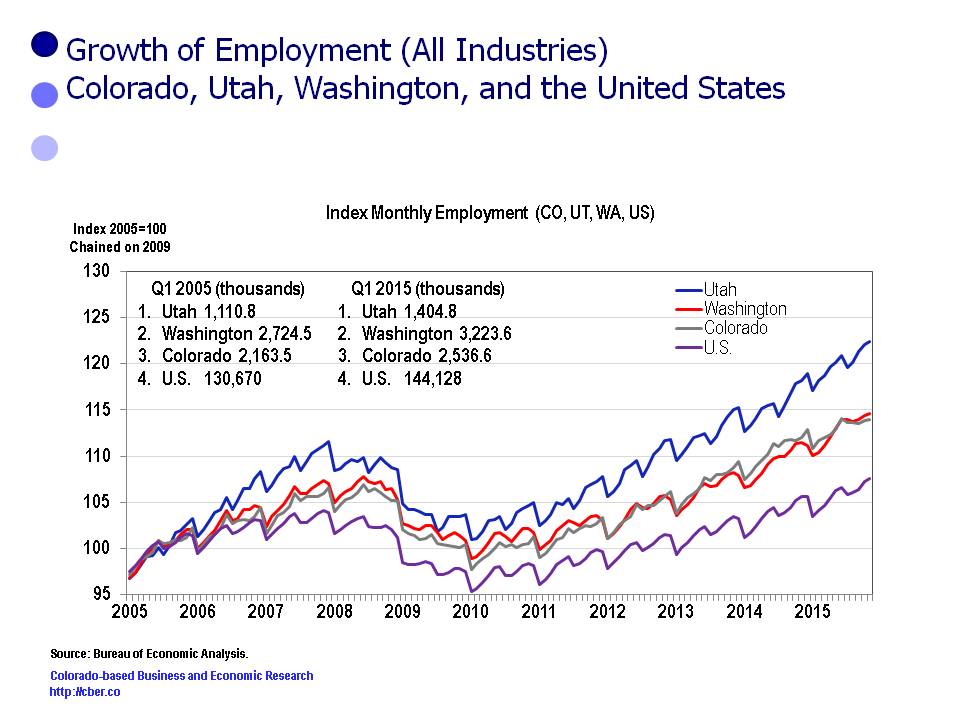
Employment
• Washington has the greatest number of employees, followed by Colorado.
• Utah had the highest rate of employment growth of the three states. Colorado and Washington have grown at similar rates; however, Washington’s rate of growth has been off a larger base of employment.
• Employment for all three states has grown at a faster rate than the U.S. That rate of growth has accelerated since 2010 for all three states.
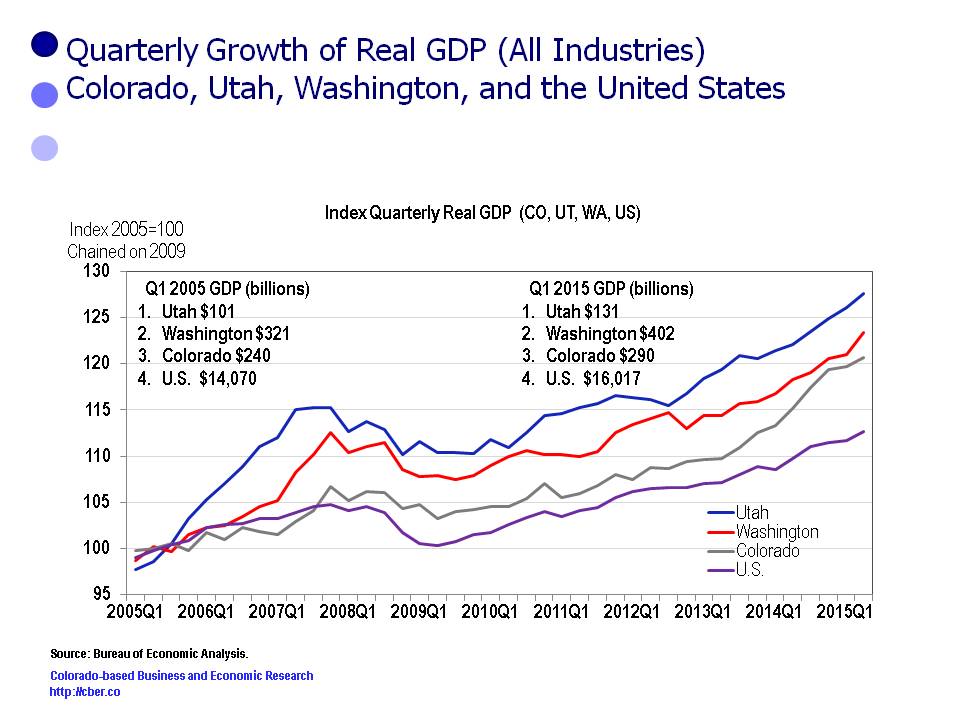
Colorado Utah Washington

Real GDP
• Washington has the largest GDP, followed by Colorado.
• The Real GDP for all three states has grown at a higher rate than the U.S.
• Utah had the fastest rate of Real GDP growth from 2005 to present followed by Washington. Colorado is third.
• Since the end of the recession the GDP for all three states has grown at a faster rate than the United States. Colorado had the fastest rate of Real GDP growth from 2013 to present because of the rapid growth in the extractive industries. That rate of growth is likely to decrease in 2015 and beyond as a result of challenges facing the oil and gas industry caused by lower oil prices.

Colorado Utah Washington

Based on these metrics Washington has the largest economy and Utah is growing at a faster rate than the other two states. The strengths of the economies in Utah, Washington, and Colorado make them great places to live, work, and play. Here’s to a prosperous year for all three states in 2016.

Utah Job Growth Outpacing Colorado

Colorado’s wage and salary employment is about twice the size of Utah’s wage and salary employment. In some state rankings, it has been reported that Utah is adding workers at a faster rate than Colorado.

Since 1990, Utah wage and salary employment has grown at a faster rate than Colorado, although the two states grew at a similar rate during the 1990s.

A review of the following six industries shows that Utah has increased at a faster relative rate than Colorado between 1990 and 2013:
• Construction
• Manufacturing
• Tourism
• Information
• Professional and Business Services
• Financial Activities

The following factors contribute to Utah’s faster rate of growth:
• Utah was showcased around the world for the 2002 Olympics.
• Utah has many of the same assets that Colorado has – quality of life, scenery, tourism, solid higher education.
• Because its rate of growth is calculated off a smaller base, Utah is likely to have a higher rate of growth. That statement is not intended to detract from Utah’s appeal as a place to live, work, and play.

It is common to rank and compare the performance of states. The most important take-away from this comparison is the fact that Colorado and Utah are both popular strong performing states.

Colorado vs. Utah Job Growth


Colorado’s Manufacturing Output Similar to Arizona, Kansas, and Utah

Manufacturing is important to the Colorado economy because it is a primary job creator – it brings in investment from outside the state, it creates jobs with higher than average wages, and the industry often has a deeper local supply chain than other industries. In 2012, the most current data available, Colorado manufacturing output totaled $19.99 billion and was 8.4% of private sector output (BEA).

Colorado is proud to have manufacturing competencies in some high-tech areas and food and beverage and state economic development officials have focused their support on the select sectors where they have strength or potential strength.

In 2012, Colorado was ranked 29th for total manufacturing output. States with similar levels of output include Arizona, Kansas, Utah, Maryland, and Oklahoma.


State Output (millions) Percent Cumulative Percent
California $213,257 11.4% 11.4%
Texas $210,968 11.3% 22.7%
Illinois $92,383 4.9% 27.7%
North Carolina $88,252 4.7% 32.4%
Ohio $87,174 4.7% 37.1%
Indiana $84,150 4.5% 41.6%
Pennsylvania $70,634 3.8% 45.4%
Michigan $66,230 3.5% 48.9%
New York $63,088 3.4% 52.3%
Oregon $55,158 3.0% 55.2%
Louisiana $55,097 3.0% 58.2%
Wisconsin $49,981 2.7% 60.9%
Georgia $48,599 2.6% 63.5%
Washington $46,507 2.5% 66.0%
Massachusetts $41,629 2.2% 68.2%
Tennessee $41,411 2.2% 70.4%
Minnesota $40,441 2.2% 72.6%
Virginia $40,116 2.1% 74.7%
New Jersey $38,199 2.0% 76.8%
Florida $37,023 2.0% 78.8%
Missouri $32,275 1.7% 80.5%
Alabama $30,001 1.6% 82.1%
Kentucky $29,746 1.6% 83.7%
South Carolina $28,708 1.5% 85.2%
Iowa $25,406 1.4% 86.6%
Connecticut $24,079 1.3% 87.9%
Arizona $21,934 1.2% 89.1%
Kansas $20,503 1.1% 90.2%
Colorado $19,992 1.1% 91.2%
Utah $19,184 1.0% 92.3%
Maryland $18,657 1.0% 93.3%
Oklahoma $17,497 0.9% 94.2%
Arkansas $15,604 0.8% 95.0%
Mississippi $15,254 0.8% 95.8%
Nebraska $12,484 0.7% 96.5%
New Hampshire $7,657 0.4% 96.9%
Idaho $7,556 0.4% 97.3%
West Virginia $6,223 0.3% 97.7%
New Mexico $5,805 0.3% 98.0%
Nevada $5,504 0.3% 98.3%
Maine $5,497 0.3% 98.6%
Delaware $4,393 0.2% 98.8%
South Dakota $4,008 0.2% 99.0%
Rhode Island $3,919 0.2% 99.2%
Vermont $3,150 0.2% 99.4%
North Dakota $3,037 0.2% 99.6%
Montana $2,860 0.2% 99.7%
Wyoming $2,269 0.1% 99.8%
Alaska $1,671 0.1% 99.9%
Hawaii $1,274 0.1% 100.0%
District of Columbia $256 0.0% 100.0%
Total $1,866,700 100.0%

Milken Report Shows Solid Economic Performance in Four Corner States

The Milken Institute recently released Best-Performing Cities 2012-Where America’s Jobs are Created and Sustained. Coloradans will be pleased to note that Fort Collins was ranked 12th and Boulder was ranked 15th in 2011. As well, Denver-Aurora-Broomfield was 30th, Greeley was 42nd and Colorado Springs was 57th. Pueblo was ranked 33rd and Grand Junction 50th for small MSAs. Since the ratings began in 1999, the Denver MSA has never been in the top 20.

The rankings are based on an index that measures growth in jobs and high tech output from 2006 to 2011. Technology output and wages and salaries are tracked for 2005 to 2010. Five-year ranges account for fluctuation in business cycles. The latest year’s growth from these five-year ranges is also included. The high-tech concentration and the number of high tech industries with a location quotient greater than one for 2011 are also included. Finally, the change in employment for May 2011 to May 2012 is included to capture momentum. This index measures the performance of the country’s MSAs coming out of the recession into 2012.

Overall, the report shows that Silicon Valley is back, Texas remains strong, tech centers have rebounded (Texas, North Carolina, Washington D.C. Utah, and Massachusetts), and Utah is the top state in the Mountain region.

1    San Jose-Sunnyvale-Santa Clara, CA

2    Austin-Round Rock-San Marcos, TX

3    Raleigh-Cary, NC

4    Houston-Sugar Land-Baytown, TX

5    Washington-Arlington-Alexandria, DC-VA-MD-WV

6    Salt Lake City, UT

7    Provo-Orem, UT

8    Cambridge-Newton-Framingham, MA

9    Charleston-North Charleston-Summerville, SC

10    Fort Worth-Arlington, TX

11    New York-White Plains-Wayne, NY-NJ

12    Fort Collins-Loveland, CO

13    Seattle-Bellevue-Everett, WA

14    Dallas-Plano-Irving, TX

15    Boulder, CO

16    Kennewick-Pasco-Richland, WA

17    Peabody, MA

18    El Paso, TX

19    Bakersfield-Delano, CA

20    Lubbock, TX

21    Durham-Chapel Hill, NC

22    San Antonio-New Braunfels, TX

23    Portland-Vancouver-Hillsboro, OR-WA

24    Lafayette, LA

25    Knoxville, TN

In addition to the report, the website provides a historic perspective showing the evolution of the top 20 cities for 1999 to 2011. In the table below, the year represents the year of the data, not the year of the report. Results for the Four Corners states show that the Denver MSA was never in the top 20 and Utah’s MSAs  outshined those in Colorado. The data makes the case that the four states represent a region with solid economic performance.


©Copyright 2011 by CBER.