COVID-19 cases per 100,000 – U.S. vs Colorado

The Opportunity Insights project is tracking the recovery of the U.S. economy from COVID-19-19. The following data is through January 12, 2021.

There were 44.4 COVID-19 cases per 100,000 in Colorado and 75.9 cases per 100,000.

The Colorado rate is trending down while the U.S. rate is trending up. The light grey lines in the background represent other states. The rate for Colorado is appears to be lower than most states.

Colorado has paid a steep price economically for having lower COVID-19 rates per 100,000. The state was ranked 48th in December for the worst unemployment rate in the nation.

States with the lowest rates (per 100,000 people) include Hawaii, 13.8, and Vermont, 25.2 States with the highest rates include Arizona, 130.0, and California, 110.0.

COVID-19 Colorado vs. U.S.

Lower Gasoline Prices Have Minimal Impact

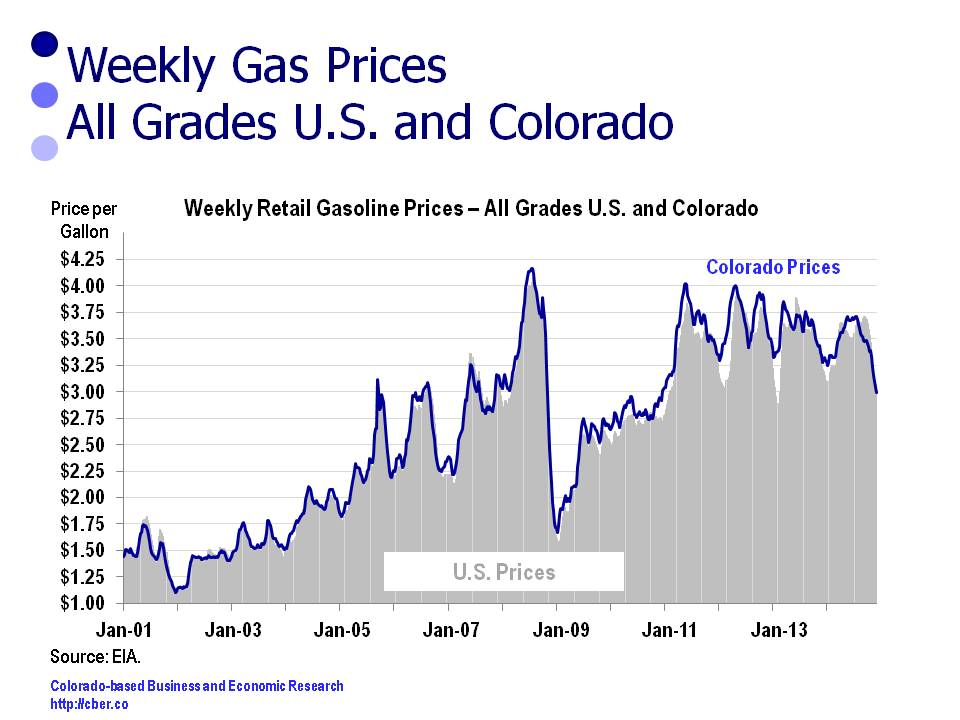
Since the second quarter of 2012, the price of gasoline has slowly declined in the U.S. and Colorado.

At this point, the impact in total gasoline prices for the year is primarily psychological even though prices have dropped below $3.00 per gallon in some locations. The difference in total prices paid for 2014 compared to last year are negligible.

The Good News – At some point lower gas prices may increase discretionary income for consumers. At the moment that is not likely because inflation has driven other costs higher, especially housing costs.

The Not So Good News – Typically, the impact of lower oil and gasoline prices on the state is negative. In other words, consumers will benefit; however, state coffers will not be as full because tax collections will be lower.
gasoline prices


Holiday Retail Sales will be Strong – Grinch to Visit Elsewhere

noGrinchnoThe outlook for holiday retail sales is upbeat. It is doubtful the Grinch will be visiting Colorado this Christmas season. Most likely he will be in parts of Europe, Japan, and Mexico where the economy is not as strong.

The National Retail Federation expects holiday sales to increase by 4.1% this November and December compared to a 3.1% increase last year. Over the past 10 years, average holiday growth has been about 2.9%. In other words, lower unemployment rates and an improved economy means retail trade sales this holiday season will be above average.

Sales in November and December (excluding autos, gasoline, and restaurant sales) represent about 19.2% of the annual total. Nationally, up to 800,000 workers will be hired on a seasonal basis for November and December.  Online sales will increase by 8% to 11%.

The optimistic expectations for national retail sales bode well for Colorado. The Colorado Legislative Council and the Office of State Planning and Budgeting expect Colorado’s 2014 annual retail sales to be 6.0% greater than last year. Given the strength of the state economy, holiday sales should easily exceed the national projected growth rate of 4.1% and may exceed the 6.0% projection for the year.

Colorado average retail trade employment in November and December is about 10,000 workers greater than the average for the other 10 months of the year. A similar increase in retail employment should be expected in 2014.

Over the past decade consumers have become accustomed to deep discounting during the holiday season. Despite an outlook for a brisk holiday season, there will likely be a sufficient number of markdowns and bargain basement deals. As the t-shirts on consumers in the local mall say, “Stay Calm and Shop On” or is it “Stay Calm and Shop Online.”

Happy shopping!

Relief at the Pump – Coloradans Saved $56 in 2013!

Back in the day… a Hershey’s candy bar cost a nickel and a person needed a dime to get a Coke from the vending machine. (Diet Coke didn’t exist). Nickels and dimes had value back in the day.

And…it cost $.21 for a gallon of gasoline. Not only that, an attendant filled up the car, checked the oil, and washed the windows. Back in the day a car was taken to a service station, not a gas station.

Given that perspective, the current relief at the pump is still painful.

As we ring out the old year and ring in the new it is now possible to compare the annual costs of gas for Colorado and the U.S. This calculation assumes that 15 gallons of gas were purchased each week at the average price for all blends. The comparison follows:

  • Colorado
    • The 2013 cost was $2,706.
    • The 2012 cost was $2,762.

It cost $56 less to purchase gas in Colorado during 2013 than 2012.

  • United States
    • The 2013 cost was $2,782.
    • The 2012 cost was $2,874.

It cost $92 less to purchase gas in the U.S. during 2013 than 2012.

In 2013 it cost $76 less to purchase gas in Colorado than the U.S.

How is that for relief at the pump?

If you are a Coloradan, how did you spend the $56 dollars you saved in 2013?
©Copyright 2011 by CBER.

Pain at the Pump – Will it be Less in 2013?

Since 2009 Americans have felt the pain at the pump. The angst for Coloradans has been slightly less.

For the past 52 weeks, the average cost to purchase 15 gallons of gas per week was $2,760. Believe it or not, this was about $1 more than the previous 52 weeks, not adjusted for inflation.

As well, the cost for Coloradans was about $111 less than the U.S. total for the past 52 weeks.

Sticker shock wasn’t as bad as it was two years ago. This is good news for consumers, but not so good news for the companies who rely on higher oil prices and governments who rely on severance and other taxes for revenue.


©Copyright 2011 by CBER.

Will Colorado Output Continue to Expand as Slower Rate than U.S.?

Between 1997 and 2012, the Private Sector Real GDP and job growth for Colorado outpaced the nation.  For this period, data released by the Bureau of Economic Analysis and the Bureau of Labor Statistics shows:

  • The annualized rate of growth for U.S. Private Sector Real GDP (sum of all states) was 2.3% and private sector wage and salary employment expanded at a rate of 0.5%.
  • The compound growth rate for Colorado Private Sector Real GDP was 3.1% and private sector nonfarm jobs grew at a rate of 0.9%.

More recently, the data tells a different story.  Colorado did not fare as well as the nation between 2009 and 2012.  While the rate of job growth was similar, U.S. output expanded at a faster rate.

  • The annualized rate of growth for U.S. Private Sector Real GDP (sum of all states) was 2.5% and private sector wage and salary employment expanded at a rate of 1.1%.
  • The compound growth rate for Colorado Private Sector Real GDP was 2.2% and private sector nonfarm jobs grew at a rate of 1.1%.

Time will tell whether the Colorado output will continue to grow at a slower rate than the U.S. or if this is a short-term variance that will reverse itself in 2013 or 2014.

Private Sector  Real GDP
©Copyright 2011 by CBER.

State Per Capita Real GDP Increased by 1.1% Since 1997

There are many data sets that can be used to evaluate the performance of the state and national economy. One of those metrics is Per Capita Real GDP. This measure is derived by dividing real output by the population.

For the period 1997 to 2012, Per Capita Real GDP for Colorado and the U.S. grew at essentially the same rate, 1.11% and 1.13% respectively.

Within that period there were some differences:

  •  Between 1997 and 2001 the Per Capita Real GDP for Colorado increased at an annualized rate of  3.88% compared to 2.49% for the U.S.
  •  Between 2001 and 2012 the Per Capita Real GDP for Colorado increased at an annualized rate of  0.13% compared to 0.64% for the U.S.
  • Between 2009 and 2012 the Per Capita Real GDP for Colorado grew at an annualized rate of 0.58% compared to 1.39% for the U.S.

During the final years of the go-go 90s, Per Capita Real GDP for the state increased at a faster rate than the nation.  Since the 2001 recession, the nation has outpaced the state.

©Copyright 2011 by CBER.