U.S. Job Market Remains on Solid Ground

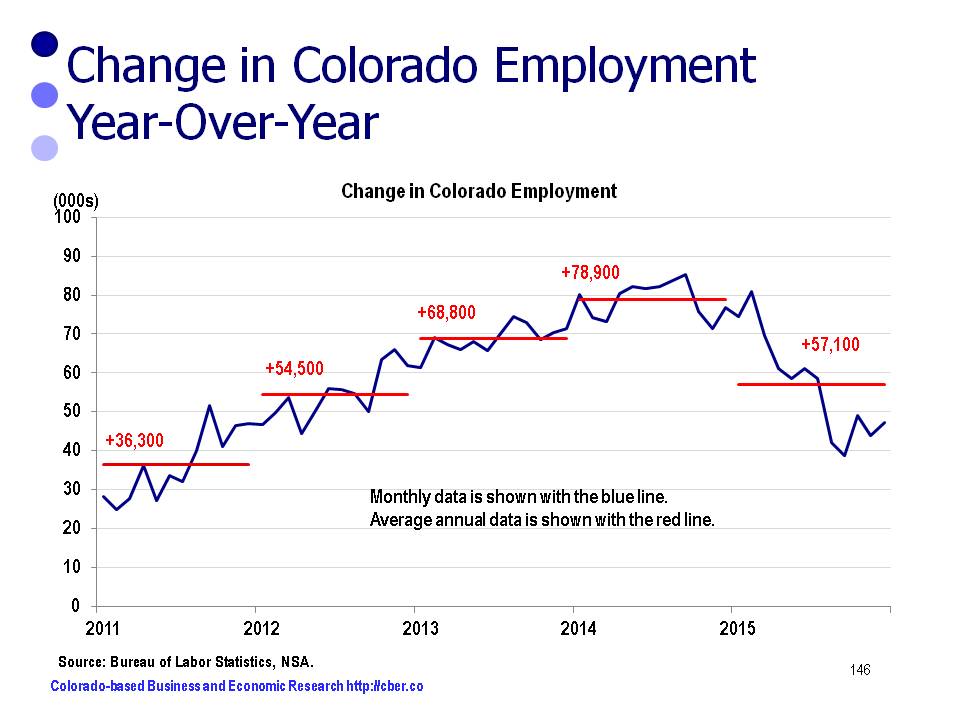
Despite the gloom and doom of the new year, there is reason to feel good about the U.S. job market.

The news from the dark side is that oil prices are down, the equity markets are volatile, it is an election year, and there is uncertainty about the global economy….There are always headwinds.

On the sunny side of the street, there is plenty of upside:
• Unemployment is 4.9%.
• About 10 million jobs were added in the last four years (2012 to 2015).
• Weekly initial jobless claims have been below 300,000 for about a year.
• The recent growth in wages exceeds the rate of inflation.
• Low gasoline prices have fueled greater saving and consumption.

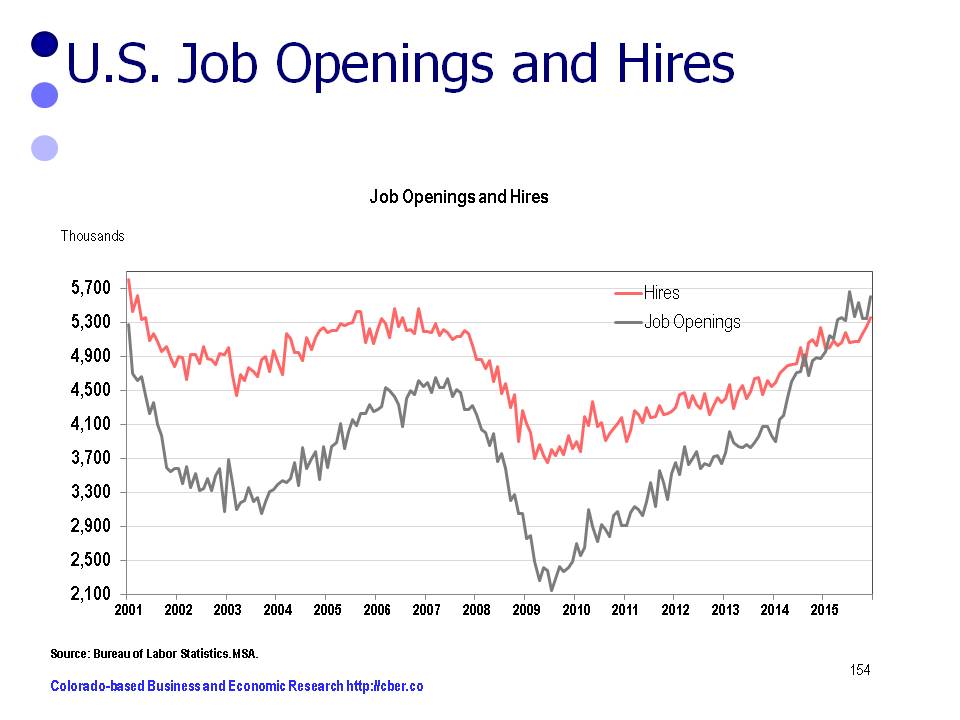
Another data series that points to a solid U.S. job market is the Job Openings and Labor Turnover Survey (JOLTS). This infrequency cited database tracks job openings, hires, and separations. They are defined by the BLS as follows:
• Job Openings – All positions that are not filled on the last business day of the month.
• Hires – All additions to the payroll during the month.
• Separations – all employees separated from the payroll during the months.

During periods of economic growth, the number of openings (grey) and hires (red) increases. When the growth of the economy slows as it did in 2001 and 2008 there is a decline in the number of openings and hires. At present both openings and hires are trending upwards.

U.S. Job Market

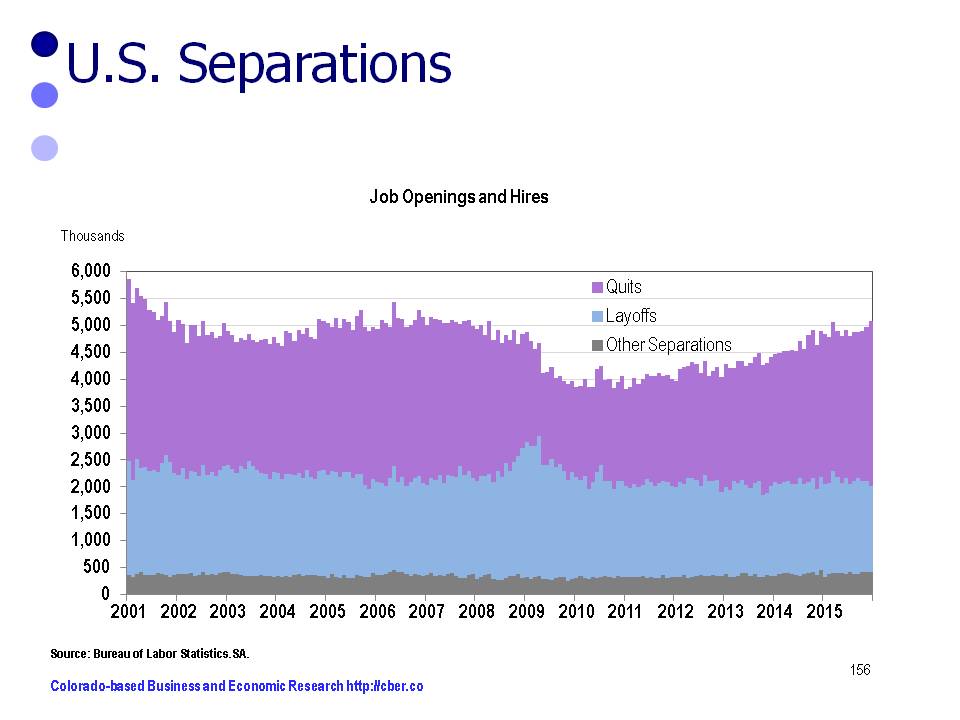
A closer look at separations shows there are positive trends in its three series (other, quits, layoffs). These series are defined as follows:

• Other Separations – retirements; transfers to other locations; deaths; or separations due to employee disability.
• Quits – Employees who leave a company voluntarily.
• Layoffs and Discharges – Involuntary separations initiated by the employer.

Currently, other separations (grey) are flat, layoffs (blue) and discharges are flat or trending downward, and quits (purple) are increasing. These are indicators of a healthy economy.

separations

As mentioned earlier, the number of hires moves in conjunction with the performance of the economy. During 2008 and 2009 the number of hires declined sharply. At the same time, the number of separations (grey) declined at a much slower rate, i.e. the number of layoffs increased significantly. The result is the massive job losses associated with the Great Recession.

U.S. Job Market

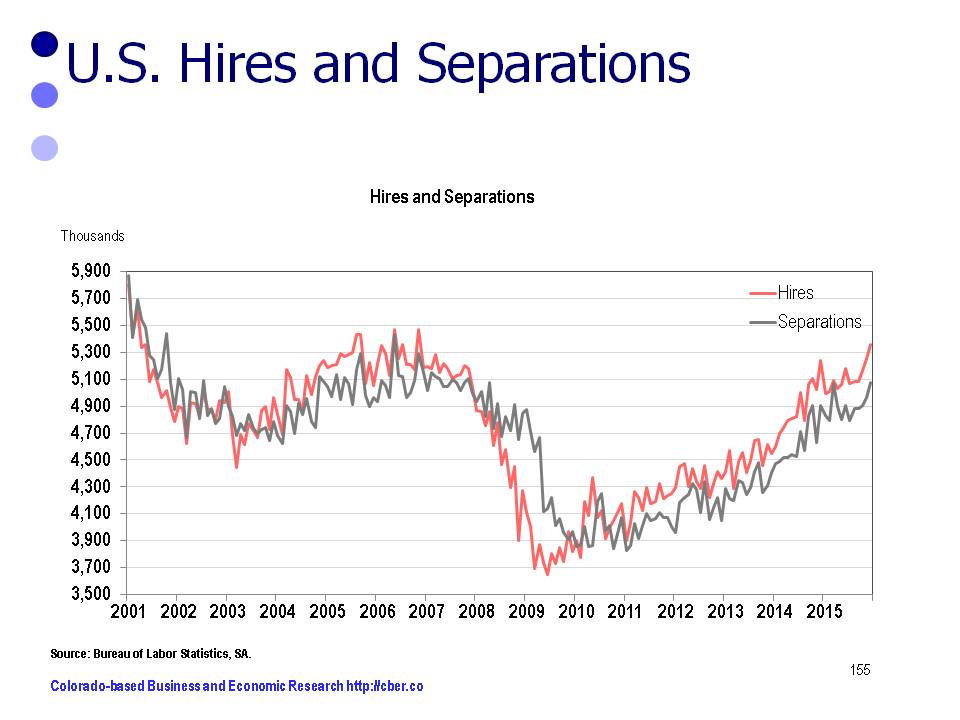
Since 2010, both hires and separations have trended upwards. As there are more job hires, more people quit their jobs to take positions with other companies.

The bottom line – the U.S. job market appears to be on solid footing for the moment.

December Nonfarm Jobs Data for Colorado – Lackluster Growth

Today, BLS released December unemployment and employment data for Colorado. The seasonally adjusted unemployment rate for the state dropped to 3.5%. This is significantly lower than the U.S. rate of 5.0%.

Workers will benefit from lower unemployment rates, but lower rates are generally bad for businesses. In many cases companies are not able to fill critical positions. In turn they are forced to hire unqualified workers, pay overtime, or leave money on the table.

Nationally, 25 states posted declines in their December unemployment rates compared to November. There were increases in 14 states and no change in the rates for 11 states and the District of Columbia.

BLS reported lackluster nonfarm job growth in Colorado in December. This level of growth is in line with the pattern for U.S. seasonally adjusted nonfarm job growth. On a seasonally adjusted basis there were 10,700 more workers in December than November.

To that point, there was strong growth across the country. Nonfarm payroll employment increased in 36 states and the District of Columbia and it decreased in 14 states.

Looking at U.S. job growth on a quarterly basis there was weak employment growth in Q3, but strong growth in Q4. Given this trend nationally, it stands to reason that Colorado is following that same pattern. The data is in line with the level of activity on the streets.

The data indicates that Colorado added about 20,000 jobs in Q4, after no job growth in Q3.

On March 14th BLS will release its employment benchmark data for 2015. That data will more accurately tell the story of 2015 nonfarm job growth in Colorado.

nonfarm job growth


2014 Unemployment Rate – Challenges and Positives for 2015

On March 4, the Bureau of Labor Statistics released its annual unemployment data for Colorado. The 2014 unemployment rate for Colorado was 5.0%, down from 6.8% in 2013. The average number of unemployed decreased from 189,023 in 2013 to 141,387 in 2014.

With that as a background, some of the challenges and positives facing the economy are listed below.

Employment in Colorado has increased at a modest and manageable rate for the last two years. A similar level of growth is expected in 2015, but there will be some challenges.
• The decline in the price of oil has begun to hit Colorado producers. The breakeven point for the Niobrara is in the $65 to $70 range. Several companies have announced significant layoffs.
• In addition to the drop in the price of oil, demand for Colorado coal declined in 2014. Coal is a major driver of several rural economies throughout the state. With the decline in demand, many communities are fine tuning their economic development strategies to diversify their economies.
• Colorado’s rate of inflation is more than a point higher than the rate for the U.S. (The Denver-Boulder-Greeley index is used as a proxy for the state). Last year it was 1.6% for the U.S., while it was 2.8% for Colorado. The rapidly appreciating prices of housing in Denver and many parts of the state are largely responsible for the gap in inflation between the state and the nation.
• Rising home prices are a two-edged sword. They benefit the home owners but may be detrimental to prospective buyers. In parts of the Front Range, there is solid demand and low inventories for certain types of housing, particularly at the lower end. Affordable and attainable housing are in high demand.

On the other hand the state has many positives:
• Nationally, jobs are being added at rate that is accelerating slightly. That bodes well for Colorado.
• The decline in oil and gas prices has increased disposable income slightly, about $50 for 2014 and $500 to $700 for 2015.
• Rising home prices will be beneficial to Colorado. Homeowners are more confident if they feel the value of their home is increasing. As a result they may spend more. Rising property values directly benefit the coffers of local governments and school districts.
• After a slowdown in 2014, Wall Street is enjoying a bull market. This in turn creates wealth and increases greater consumer and business confidence.
• Unemployment is expected to remain below 5.0% throughout 2015. As a result wage pressures will become a bigger issue in more occupations and industries. This is great for workers, particularly if their increases exceed Colorado’s rate of inflation (2.8% in 2014). Wage increases that exceed the rate of inflation will serve as a form of stimulus to the economy because workers will have greater confidence and more to spend. In turn, education and state and local government will be able to more fully fund programs that have been underfunded in the past.
• Because the decline in the price of oil is a global issue, oil and gas employees may not be able to move to other states or countries to find work. With the Colorado unemployment in the range of 4.0% some of these workers may be able to stay in-state and work in construction, manufacturing or other positions.
• Colorado has experienced another first-rate ski season, with an added benefit of hosting the 2015 FIS Alpine World Ski Championships in Vail. The event showcased the state to 700 athletes from more than 70 nations.
• The spring snow storms significantly increased snowpack levels in many parts of the state; however, additional snow is needed. Water in critical for all aspects of Colorado’s economy. While the snow is often viewed as an inconvenience to those along the Front Range, it is essential to have good snow pack in our mountains and counties where agriculture dominates the local economy.
• The sectors that have driven the economy over the past two years are construction; healthcare; accommodations and food services; retail trade; and professional, scientific, and technical services (PST). These sectors are expected to account for about 60% of the job growth in the state in 2015. There will admittedly be challenges in the extractive industries; however, they will have a minor impact on the growth of the state’s top five sectors for job growth.

As Colorado addresses these challenges and positives, job growth in 2015 is expected to be at or slightly less than the rate for 2014.

cber.co Colorado Economic Forecast for 2014 – 68,000 to 74,000 Jobs to be Added

In 2013 the state experienced natural disasters and self-inflicted political wounds, yet Colorado employment grew at a faster than expected rate. The cber.co economic forecast points to continued expansion  for 2014.

On a Positive Note…

  • The state population grew at a higher rate than expected in 2013. Stronger growth is on tap for 2014.
  • The story is the same for employment. In 2013, the state added approximately 68,000 workers and will add another 68,000 to 74,000 in 2014. This represents job growth in the rage of 2.9% to 3.1%.
  • Unemployment will continue to decline, and will be in the range of 5.5% to 5.8% at the end of 2014.
  • In 2013 consumers were delighted that gasoline prices declined. At the moment there is no reason to believe they will rise precipitously (knock on wood).
  • Colorado new car registrations have risen steadily for the period 2010 to 2013. A decline is unlikely in 2014.
  • Colorado’s general fund, particularly sales and income taxes, has been a benefactor of increased population, employment, and wages. Likewise the revenue for city and county governments has improved.

Some Mixed News…

  • Per Capita Personal Income will increase by 3.7% in 2014.  This is slightly less than the rate of growth for the U.S. Over the past two decades the gap between the U.S. PCPI and the state PCPI has closed significantly.
  • In 2014, Colorado inflation will be 3.0%, well above the rate for the U.S.
  • In Colorado, housing prices have increased at a faster rate than the nation. That is great news for home owners, but not so good news for people wanting to enter the housing market.
  • The Construction Sector is slowly improving.  Increased building activity supports growth in multiple sectors and causes greater congestion on the highways. For some, the latter is not desirable.
  • Although the state returned to 2008 peak employment, it will be a long time before the state returns to the 2007 peak number of establishments.

Looking ahead, the economy will build on the foundation established in 2013. Hopefully the state’s leadership will be less dysfunctional.

Click here to review the cber.co forecast and other economic reports.

cber.co forecast

©Copyright 2011 by CBER.

Surprise – U.S. Employment up by 200,000/month from August to September

On November 8th the Bureau of Labor Statistics reported the U.S. employment was up by 204,000 in the month of October. This was a shock to many, particularly given the weak ADP numbers published in late October.

The BLS delivered a second surprise by bumping up the net jobs added for August and September. Unfortunately, the number of unemployed in October was only 44,000 less than August, and the unemployment rate, 7.3%, was the same for both months.

For the first 10 months of 2013, U.S. employment increased at an average rate of 186,300 jobs per month. This is above the monthly average for 2012 (185,000) and 2011 (175,000).

U.S. job growth was strong in the first quarter of 2013, but the increases became more tepid as the year progressed. Average job growth for the past three months is slightly above 200,000. The December release will show the extent to which Congress’ game of chicken with the Federal budget derailed this momentum.

U.S. Employment Situation

©Copyright 2011 by CBER.

U.S. Job Recovery Slower than Colorado

Coloradans breathed a sigh of relief when the BLS released June data showing the state’s wage and salary employment finally returned to the 2008 peak. (For more information about the Colorado situation, click here.)

Nationally, it is a much different story. The U.S. is still about a year away from returning to the 2008 job peak.

U.S. employment topped out at 138.1 million in January 2008. By February 2010, the number of wage and salary jobs had plunged to 129.3 million, a decrease of 8.8 million workers.

At the end of July 2013, 6.7 million jobs had been added since the trough and employment had reached 136.0 million. Slightly more than 2.0 million jobs are needed to reach the pre-recession peak, or about 77% of the jobs have been recovered.

Over the past year, jobs have been added at a rate of about 190,000 per month. If they continue to be added at that rate, it will take another 10 months (May 2014) before the pre-recession peak is reached.

As a result of the Great Recession, the number of unemployed workers jumped from 7.7 million in January 2008 to 15.4 million in October 2010, i.e. the number of unemployed workers doubled. Since October 2010, the number of unemployed has declined to 11.5 million, a decrease of only 3.9 million.

For many Americans, the recovery from the Great Recession has been painful. For another group, the recovery will never happen.

©Copyright 2011 by CBER.

CDLE’s Monthly Unemployment Data Misses the Mark in 2012

Last year, did it  seem like the Colorado unemployment rate didn’t match what was happening on the streets?

For the most part, the initial data, which is used in the monthly CDLE media blitz, told a much different story from the unheralded benchmark revisions released in March. In fact, the correlation coefficient between the initial release data and the March benchmark data is .44. This means there is a relationship between the two data sets, but it is not strong.

The initial data indicated that unemployment rate was flat at 7.8% for the first quarter, had four months of increases up to 8.3%, then five months of declines.

On the other hand, the benchmarked revisions started at 8.3% and dropped in February to 8.2%. The rate stayed at that level until June, when it declined for the last 6 months of the year.  The benchmarked data ended the year at 7.5% compared to 7.6% for the initial data.

Good data is most valuable during times when the economy is the most volatile. The unemployment rate published by the Colorado Department of Labor failed to meet that critical need in 2012.


©Copyright 2011 by CBER.

U.S. Unemployment is on the Decline, but not for all Occupations

There is good news on the unemployment front – the rate and number of unemployed workers continues to decline.

There are 2.0 million unemployed workers in occupations with unemployment rates below the natural rate (4.5% to 5.0%). Many of these occupations require a college degree.  The two-digit Standard Occupational Code (SOC) precedes each category
33 Protective service                       4.1%
19 Life sciences                               4.0%
11 Management                               4.0%
25 Education                                     3.8%
17 Architecture & engineering       3.8%
13 Business & finance                   3.7%
15 Computer & math                       3.5%
21 Community & social services  3.5%
23 Legal                                             3.1%
29 Healthcare practitioners            2.5%

There are 2.4 million unemployed workers in occupations with unemployment rates between the natural rate and the U.S. average (7.8%).  Some of these occupations require some form of higher education.
27 Arts & design                                7.8%
43 Office support                               7.6%
31 Healthcare support                      7.3%
49 Installation & maintenance        6.0%

There are 6.9 million unemployed workers in occupations with unemployment rates above the U.S. average.  Most of these occupations don’t require higher education.
45 Farming, fishing, & forestry       16.1%
47 Construction & extraction          15.8%
37 Building maintenance                13.3%
35 Food preparation                         11.0%
53 Transportation                             10.9%
39 Personal care & service               9.2%
51 Production                                       9.1%
41 Sales & related                              8.2%

In many cases, there is a clear mismatch of worker skills and company needs. In part, this has exacerbated the length of the recovery.

©Copyright 2011 by CBER.

Stagnancy in the Size of the Colorado Labor Force – The Lost Decade and Beyond

In a previous post, the topic of discussion was the stagnancy of the labor force during the 1980s (click here). In that case the size of the labor force was flat for about five years because of a regional recession, weak wage and salary job growth, and negative net migration. This post will look at the size of the labor force during the Great Recession and beyond.

Local Area Unemployment Statistics (LAUS) are available for Colorado beginning in 1976. Since then, the month-over-prior month labor force increased about 87% of the time (383 of 442 months). In a vibrant economy, periodic ups and downs are expected, but increases in the size of the labor force are generally the rule of the thumb.

Between April 2000 and October 2012 there were 30 months with decreases in the month-over-prior month size of the labor force. In January 2008 there were 2,722,015 workers. By April 2009 the number had risen to 2,758,468 workers.

During the past 42 months, there were 19 month-over-prior month declines. There were 2,725,803 workers in the October 2012 labor force. This was 32,665 fewer than the level in April 2009 and essentially the same as January 2008.

Next, we will look at three data sets for the period: Wage and Salary job growth, Net migration, and the Unemployment Rate.

For the years, 2009-2012, wage and salary job growth was devastating, with back-to-back net job losses in 2009 and 2010. The net change in wage and salary jobs follows:
• 2008 19,000
• 2009 -104,700
• 2010 -23,300
• 2011  33,000
• 2012 est  45,000

Unlike the 1980s, when the state experienced negative net migration, there has been solid positive net migration, i.e. more people moved into the state than out of it. The net migration follows:
• 2008 45,000
• 2009 36,300
• 2010 37,000
• 2011 34,900
• 2012 est 36,800

For this period the unemployment rate varied from 4.8% to 8.0%. While the monthly rate has dropped from a high of 9.0% in 2010, the 2012 annual rate remains the same as it was in 2009.
• 2008 4.8%
• 2009 8.1%
• 2010 8.9%
• 2011 8.3%
• 2012 8.0%

For all intensive purposes, the size of the labor force will be about the same as it was at the end of 2009 and the number of employed and unemployed workers will be similar.

• The 33,000 wage and salary jobs added in 2011 lowered the unemployment rate by 0.6% points, yet growth of 45,000 jobs in 2012 will lower it by 0.3% points.
• For the period 2008 to 2012, total net migration was 190,000; approximately 125,000 of these individuals are 16-65 years old.

This raises a series of questions:
• How many people have become contract or 1099 workers? How many have become sole proprietors and owned family businesses? How many people are working temporary jobs? Will they still work in this capacity when the economy recovers or will they take wage and salary jobs?
• How many workers have stopped working who don’t show up in the data?
• What are the in migrants doing? Did they take jobs that Colorado residents might have taken? Are they working in other capacities?
• How many families with dual incomes now only have one income?
• Have the published unemployment numbers been manipulated to meet political agendas?

There seem to be more questions than answers and the numbers do not seem to reconcile. As grave as the employment situation has been, it appears that the unemployment rate may be inaccurate and may have understated the magnitude of the problem.


©Copyright 2011 by CBER.

Stagnancy in the Size of the Colorado Labor Force – 1980s

The unemployment rate is one of the most popular, but overrated statistics for measuring the performance of the economy. It is such a crude measurement of economic performance that the state’s labor economist was recently quoted in the media as saying that it shouldn’t be taken at face value.

The calculation of the unemployment rate is simple. The number of unemployed workers is added to the number of employed workers (wage and salary, sole proprietors, and others) and that equals the size of the labor force. The unemployment rate is simply the number of unemployed workers divided by the size of the labor force.

In other words, the size of the labor force is a key component in determining the accuracy of the unemployment rate. This brings us to the topic of this post – the size of the labor force.

Local Area Unemployment Statistics (LAUS) are available for Colorado beginning in 1976. Since then, month-over-prior month labor force increased about 87% of the time (383 of 442 months). In a vibrant economy, periodic ups and downs are expected, but increases in the size of the labor force are generally the rule of the thumb.

There are two periods when the size of the labor force did not increase, during the 1980s and the late 2000s. The following analysis looks a period during the 1980s.

Between September 1984 through April 1989 the size of the labor force declined in 29 of 53 months.

In August 1984 the size of the labor force, as measured by LAUS data,  was 1,719,239. It declined sharply in 1985, bounced back for most of 1986, and fell sharply in 1987. It remained flat for much of 1988 and into the first part of 1989. In June of 1989, the labor force was reported at 1,719,824. From that point, it continued to grow.

Next, we will look at three data sets for the period: Wage and Salary job growth, Net migration, and the unemployment rate.

During this period, Wage and Salary (CES)  job growth was weak, with net job losses in 1987. The net change in wage and salary jobs follows:
• 1984   75,100
• 1985   16,400
• 1986  -10,400
• 1987       4,300
• 1988    23,500
• 1989    46,200
• 1990    38,600

The CES and LAUS series are different measures of employment, but they should tell a similar story about changes in employment.

During this period the state experienced negative net migration, i.e. more people moved out of the state than into the state. The net migration follows:
• 1984      2,782
• 1985      5,172
• 1986     -5,270
• 1987   -13,997
• 1988   -24,280
• 1989   -18,752
• 1990   -12,964

For this period the unemployment rate varied from 5.4% to 7.5%. It remained at a higher than normal level because unemployed workers were able to move outside the region and find work. The annual unemployment rates for this period were:
• 1984   5.4%
• 1985   6.0%
• 1986   7.5%
• 1987   7.5%
• 1988   6.4%
• 1989   5.6%
• 1990   5.1%

The labor force was stagnant for about five years for the following reasons:
• There was a regional recession
• Weak wage and salary job growth
• Negative net migration.

A similar stagnancy in the size of the labor force occurred during the 2000s. It is more difficult to understand and will be discussed in a later post (click here).


©Copyright 2011 by CBER.