James Carville coined the phrase, “It’s the Economy, stupid” to remind voters in the 1992 presidential campaign about the importance of the economy when casting their ballot.
For many years prior to 1992, members of the executive and legislative branches realized they had a better chance of getting re-elected if they influenced fiscal policy (taxes, incentives, wage and job increases, etc.) to create the perception their leadership was responsible for a healthy economy.
As a result of their manipulation, four-year stock market cycles evolved. The cycle assumes companies, and thus investments, have a stronger performance in the second half of a president’s term and a weaker performance in the first half.
This short analysis looks at the performance of the Standard & Poor’s 500 Index (S&P 500) for the presidential terms from 1952 to 2016. Obviously the period 2013 to 2016 is still in progress; however, a case can be made that the current bull market will not follow the above mentioned trends.
Fifteen stock market cycles were evaluated. The average time from peak to peak was 1,534 days or 4.2 years and the average time from trough to trough was 1,509 days or 4.1 years.
The two tables that follow look at the peaks and troughs and the year they occurred for each of the presidential terms.
The first table looks at the peaks.
• Year 1 – 3 peaks.
• Year 2 – 3 peaks.
• Year 3 – 2 peaks.
• Year 4 – 7 peaks.
Sixty percent of the peaks occurred during the second half of the presidential term.
| Presidential Term | Date | S&P | Change Up | Annualized % Change Up | # of Days Up | Year Up |
|---|---|---|---|---|---|---|
| 1953-1956 | 9/14/1953 | 22.71 | ||||
| 8/3/1956 | 49.64 | 26.93 | 31.10% | 1,054 | Year 4 | |
| 1957-1960 | 10/22/1957 | 38.98 | ||||
| 1961-1964 | 12/12/1961 | 72.64 | 33.66 | 16.20% | 1,512 | Year 1 |
| 6/26/1962 | 52.32 | |||||
| 1965-1968 | 2/9/1966 | 94.06 | 41.74 | 17.60% | 1,324 | Year 1 |
| 10/7/1966 | 73.2 | |||||
| 11/29/1968 | 108.37 | 35.17 | 20.00% | 784 | Year 4 | |
| 1969-1972 | 5/26/1970 | 69.29 | ||||
| 1973-1976 | 1/11/1973 | 120.24 | 50.95 | 23.30% | 961 | Year 2 |
| 10/3/1974 | 62.28 | |||||
| 9/21/1976 | 107.83 | 45.55 | 32.10% | 719 | Year 4 | |
| 1977-1980 | 3/6/1978 | 86.9 | ||||
| 11/28/1980 | 140.52 | 53.62 | 19.20% | 998 | Year 4 | |
| 1981-1984 | 8/12/1982 | 102.42 | ||||
| 1985-1988 | 8/25/1987 | 336.77 | 234.35 | 26.60% | 1,839 | Year 3 |
| 12/4/1987 | 223.92 | |||||
| 1989-1992 | 7/16/1990 | 368.95 | 145.03 | 21.00% | 955 | Year 1 |
| 10/11/1990 | 295.46 | |||||
| 1993-1996 | 2/2/1994 | 482 | 186.54 | 15.90% | 1,210 | Year 2 |
| 4/4/1994 | 438.92 | |||||
| 1997-2000 | 7/17/1998 | 1,186.75 | 747.83 | 26.10% | 1,565 | Year 4 |
| 8/31/1998 | 957.28 | |||||
| 3/24/2000 | 1,527.45 | 570.17 | 34.80% | 571 | Year 4 | |
| 2001-2004 | 10/9/2002 | 776.76 | ||||
| 2005-2008 | 5/19/2008 | 1,426.63 | 649.87 | 11.40% | 2,049 | Year 4 |
| 2009-2012 | 3/9/2009 | 676.53 | ||||
| 11/3/2010 | 1,363.61 | 687.08 | 52.70% | 604 | Year 2 | |
| 8/2/2011 | 1,099.23 | |||||
| 2013-2016 | 5/21/2015 | 2,130.82 | 1,031.59 | 19.00% | 1,388 | Year 3 |
The second table looks at the troughs..
• Year 1 – 3 troughs.
• Year 2 – 10 troughs.
• Year 3 – 2 troughs.
• Year 4 – 0 troughs.
About 87% of the troughs occurred during the first half of the presidential term. This suggests that fiscal policy in the third or fourth year of a presidential term may have prevented or postponed economic weakness for that year, but it mostly likely have kicked the can forward to the first half of the subsequent presidential term. In some cases pushing the weakness forward had a detrimental impact on the economy.
| Presidential Term | Date | S&P | Change Down | Annualized % Change Up | # of Days Down | Year Down | |
|---|---|---|---|---|---|---|---|
| 1953-1956 | 9/14/1953 | 22.71 | Year 1 | ||||
| 8/3/1956 | 49.64 | ||||||
| 1957-1960 | 10/22/1957 | 38.98 | -10.66 | -18.00% | 445 | Year 1 | |
| 1961-1964 | 12/12/1961 | 72.64 | |||||
| 6/26/1962 | 52.32 | -20.32 | -45.70% | 196 | Year 2 | ||
| 1965-1968 | 2/9/1966 | 94.06 | |||||
| 10/7/1966 | 73.2 | -20.86 | -31.70% | 240 | Year 2 | ||
| 11/29/1968 | 108.37 | ||||||
| 1969-1972 | 5/26/1970 | 69.29 | -39.08 | -26.00% | 543 | Year 2 | |
| 1973-1976 | 1/11/1973 | 120.24 | |||||
| 10/3/1974 | 62.28 | -57.96 | -31.70% | 630 | Year 2 | ||
| 9/21/1976 | 107.83 | ||||||
| 1977-1980 | 3/6/1978 | 86.9 | -20.93 | -13.80% | 531 | Year 2 | |
| 11/28/1980 | 140.52 | ||||||
| 1981-1984 | 8/12/1982 | 102.42 | -38.1 | -16.90% | 622 | Year 2 | |
| 1985-1988 | 8/25/1987 | 336.77 | |||||
| 12/4/1987 | 223.92 | -112.85 | -77.10% | 101 | Year 3 | ||
| 1989-1992 | 7/16/1990 | 368.95 | |||||
| 10/11/1990 | 295.46 | -73.49 | -60.60% | 87 | Year 2 | ||
| 1993-1996 | 2/2/1994 | 482 | |||||
| 4/4/1994 | 438.92 | -43.08 | -42.90% | 61 | Year 2 | ||
| 1997-2000 | 7/17/1998 | 1,186.75 | |||||
| 8/31/1998 | 957.28 | -229.47 | -82.50% | 45 | Year 2 | ||
| 3/24/2000 | 1,527.45 | ||||||
| 2001-2004 | 10/9/2002 | 776.76 | -750.69 | -23.30% | 929 | Year 2 | |
| 2005-2008 | 5/19/2008 | 1,426.63 | |||||
| 2009-2012 | 3/9/2009 | 676.53 | -750.1 | -60.40% | 294 | Year 1 | |
| 11/3/2010 | 1,363.61 | ||||||
| 8/2/2011 | 1,099.23 | -264.38 | -25.10% | 272 | Year 3 | ||
| 2013-2016 | 5/21/2015 | 2,130.82 |
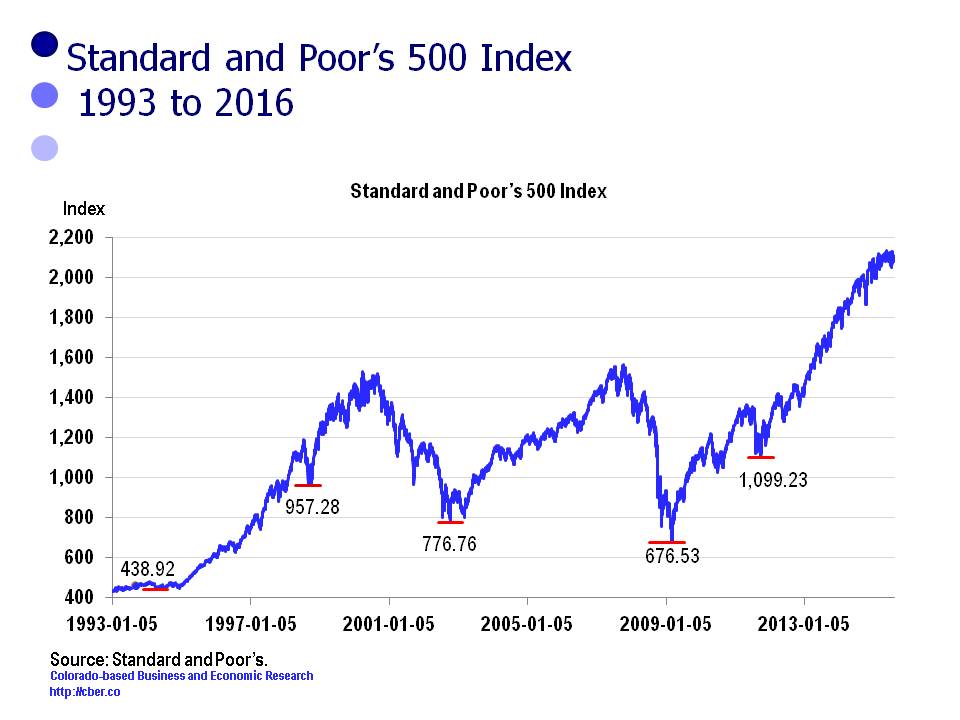
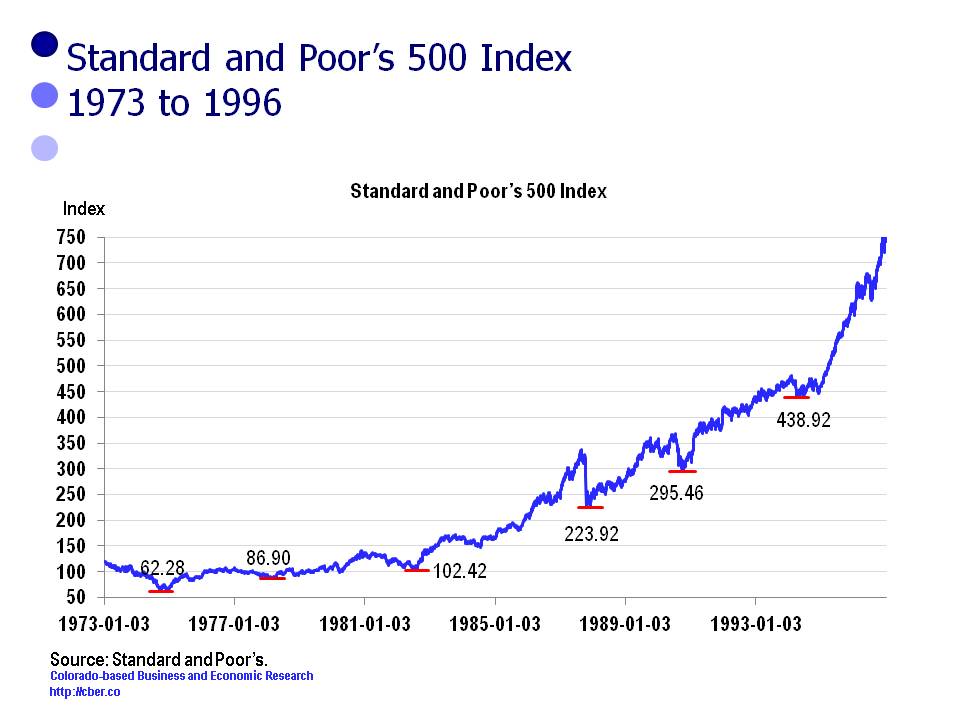
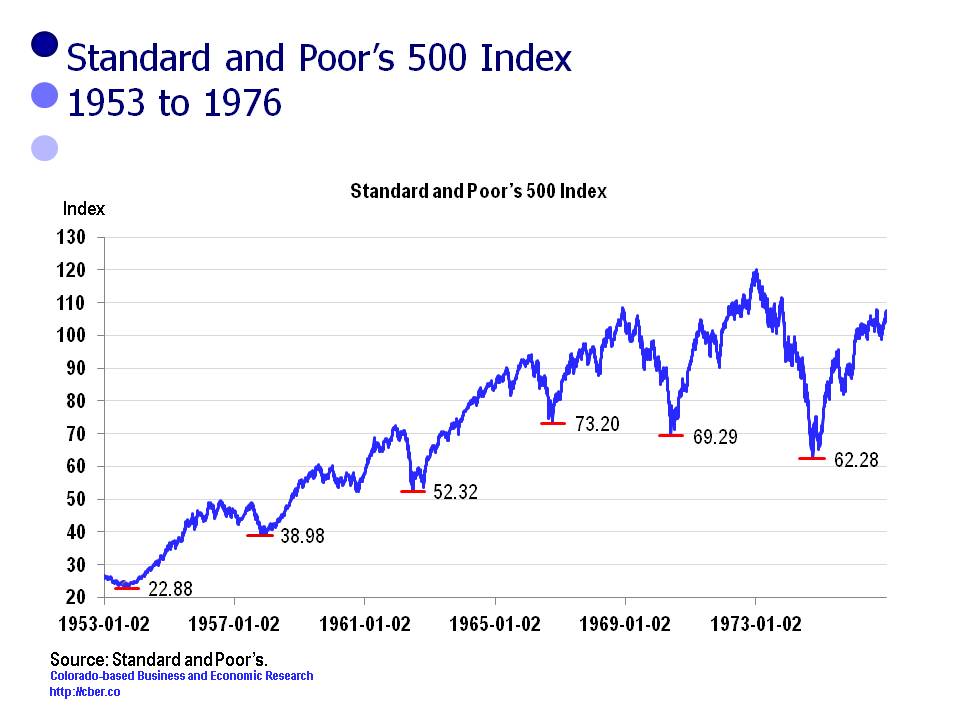
The following three charts show the daily performance of the S&P 500 for 1953 to 1976, 1973 to 1996, and 1993 to 2016.
The average number of days for periods of growth were longer than the downturns, 1,169 days compared to 357 days. The moral of the story is that growth occurs steadily over time, but losses are usually quick and painful.
In addition, the average increase in the S&P 500 was 300 points during positive cycles, compared to 173 points for the down cycles.
The most severe absolute decline in the S&P 500 ended on March 9, 2009 when the index closed at 676.53. Over the previous 294 days the index plummeted 750.10 points, an annualized change of -60.4%.
The current bull market will most likely be the strongest for the period 1952-2016. The bull market that started on March 9, 2009 was also notable. It ended on November 3, 2010 when the S&P 500 closed at 1,363.61. Over 604 days the index recaptured 687.08 points that it had lost, an annualized gain of 52.7%.


