When Can We Expect the Next Recession?

The National Bureau of Economic Research (NBER) officially tracks the performance of the U.S. economy for the purpose of identifying the timing of the troughs and peaks, which determine when recessions occur.  Specifically, NBER identifies:
• The length of the contraction, peak to trough.
• The length of the expansion, trough to peak.
• The length of the cycle, peak to peak.
• The length of the cycle, trough to trough.

They don’t predict when the next recession will occur. Instead, they will announce when the most recent recession has started and ended after-the-fact.

The following table shows NBER data since the end of World War II.

1-Peak 2- Trough 3-Contraction- Peak to Trough 4-Expansion- Trough to Peak 5-Cycle- Peak to Peak 6-Cycle-Trough to Trough
November 1948(IV) October 1949 (IV) 11 37 48 45
July 1953(II) May 1954 (II) 10 45 55 56
August 1957(III) April 1958 (II) 8 39 47 49
April 1960(II) February 1961 (I) 10 24 34 32
December 1969(IV) November 1970 (IV) 11 106 117 116
November 1973(IV) March 1975 (I) 16 36 52 47
January 1980(I) July 1980 (III) 6 58 64 74
July 1981(III) November 1982 (IV) 16 12 28 18
July 1990(III) March 1991(I) 8 92 100 108
March 2001(I) November 2001 (IV) 8 120 128 128
December 2007 (IV) June 2009 (II) 18 73 91 81

Note: Column 5 is the sum of column 3 and column 4 of the same line. Column 6 is the sum of column 3 of the previous line and column 4 of the same line.

In addition, the contraction and expansion data is shown in the following chart.

The next recession

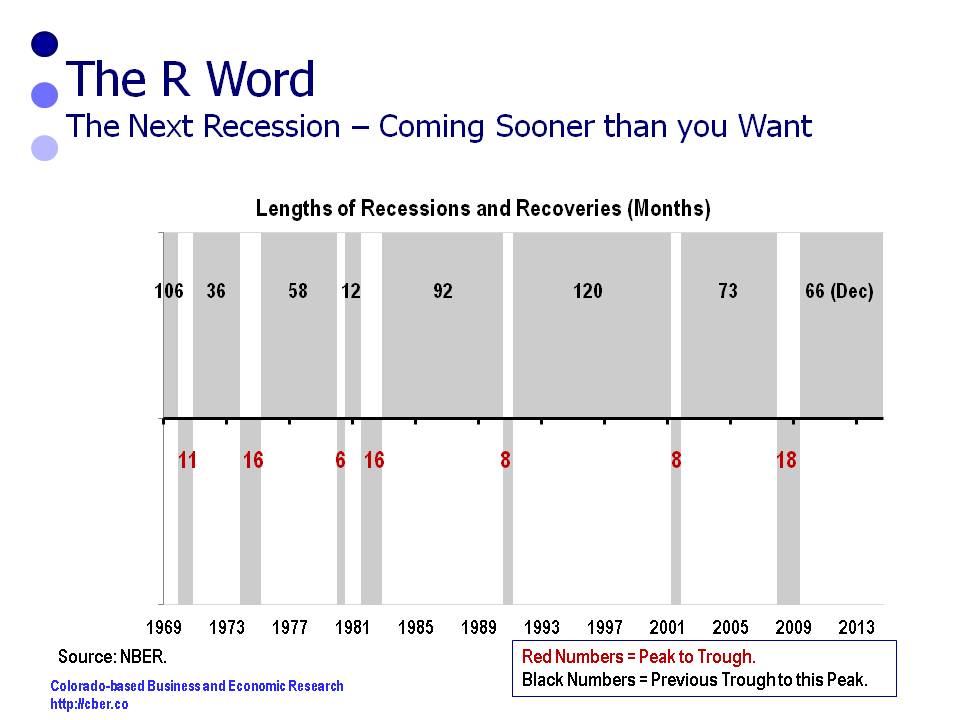
So, when is the next recession?

Recessions are not determined by mathematical equations or charts, rather they are determined by economic conditions that cause the business cycle to move up and down. Since the end of World War II, the length of the shortest business cycle is 18 months (peak from previous peak) and the length of the longest business cycle is 128 months.

Today the U.S. is somewhere in between the shortest and the longest time frame for a business cycle.

The most recent peak was in December 2007. Seven years, or 84 months have passed since the last peak.

The most recent trough was June 2009. Six and a half years, or 66 months have passed since the last trough.

If the length of current and future business cycles is similar to the length of past business cycles, then it is likely the U.S. will see the next recession before the end of Governor Hickenlooper’s term in office.

While it is possible for the next recession to occur prior to the 2016 election, both parties are incented to take every possible step to prevent that from happening.

When is the next recession? Stay tuned!


The Lost Decade – Colorado Sheds A Quarter Million Jobs As a Result of Recessions

This topic is being revisited (last discussed October 1, 2010). In early March, the Bureau of Labor Statistics released benchmark revisions for the Current Employment Statistics (CES) series for 2009 and 2010.

The Lost Decade (January 2001 through December, 2010)

  • Two recessions
  • 69 months of job gains
  • 51 months of job losses
  • Net loss 28,800 jobs over ten years

Now that the revised data is in, the employment pattern for the 10 years ending this past December is clear: DOWN, UP, DOWN, UP.

The recession, as defined by NBER, is irrelevant.

DOWN

The employment situation started off bad in January 2001. And it stayed bad for 30 months (this includes the 2001 recession).

NOTE: More jobs were lost in the 22 months in the months before and after the recession, as defined by NBER than during the 8 months of the recession (March through October 2001).

Net job losses (from peak to trough) -103,600.

UP

Beginning in July 2003, employment turned positive. Steady gains occurred over the next 58 months.

NOTE: Colorado was late entering the Great Recession (December 2007 through May 2009). The state posted net job gains of 11,600 during the first 5 months.

Net job gains (from trough to peak) +214,900.

DOWN

NOTE: During the last 13 months of the Great Recession, the state lost 109,500 net jobs.

The trend of monthly losses began in May 2008 and continued for 21 months, 8 months past the end of the recession.

Net job losses (from peak to trough) –151,100.

UP

Employment turned positive in February 2010 and posted slight gains for the remaining 11 months in 2010.

Net job gains (from trough to peak) +10,900.

NET LOSS 28,900 JOBS FOR THE TEN YEARS 2001 through 2010!


©Copyright 2011 by CBER.

Net Job Losses Occur Beyond the Official “End” of Recession

On September 20, 2010, the Business Cycle Dating Committee of the National Bureau of Economic Research (NBER) issued a press release that said, “The committee determined that a trough in business activity occurred in the U.S. economy in June 2009. The trough marks the end of the recession that began in December 2007 and the beginning of an expansion. The recession lasted 18 months, which makes it the longest of any recession since World War II. Previously the longest postwar recessions were those of 1973-75 and 1981-82, both of which lasted 16 months.”

Did you breathe a sigh of relief when you first heard that news?

Because the criteria for determining a recession includes a variety of factors, it is possible for a downturn to continue to take a toll beyond the trough. That was certainly the case with Colorado employment in the past two recessions.

Seasonally adjusted employment data for the 2007 recession show that Colorado experienced net job losses of 113,800 workers, from peak to trough. Between July 2009 and August 2010, job losses have occurred in 10 of 13 months. Post-trough job losses have totaled 41,800 workers to-date and may go higher.

By comparison, the 2001 recession lasted from March to November. During that period, net job losses were 42,500 employees. Post-trough declines occurred in 15 of 20 months and totaled 60,600 workers.

In summary, there was a drop of over 100,000 jobs associated with the 2001 recession; to-date over 155,000 employees have been shed as a result of the 2007 recession. That is a significant decrease for a state that employs 2.2 million workers.

Looking forward, we can only hope that the expansion cited by the NBER is strong enough to include employment growth for Colorado in 2011.

©Copyright 2011 by CBER.