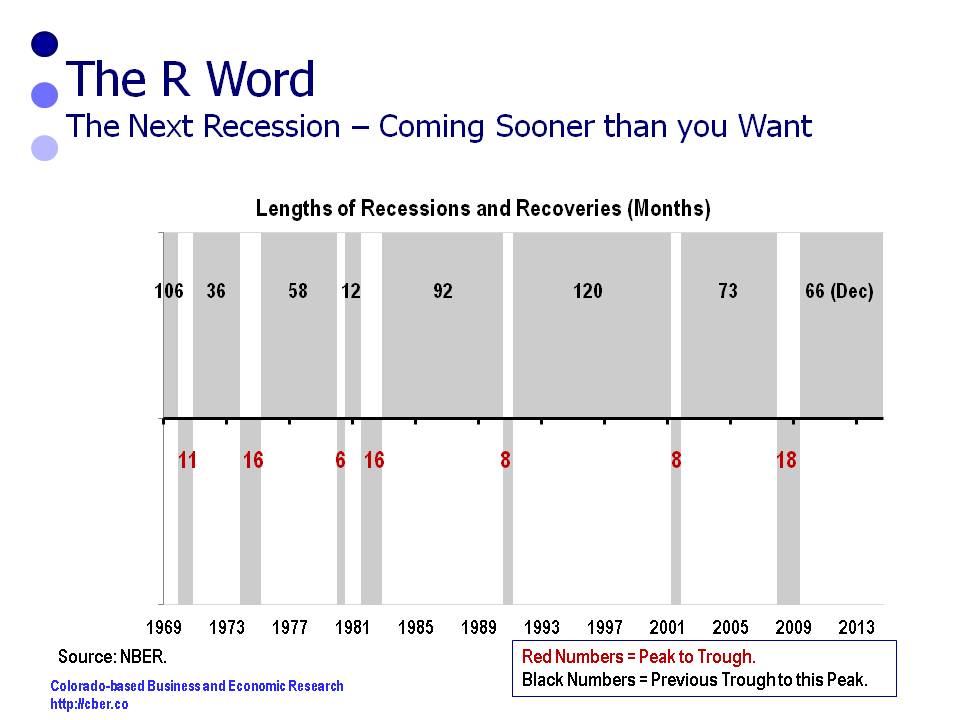
The National Bureau of Economic Research (NBER) officially tracks the performance of the U.S. economy for the purpose of identifying the timing of the troughs and peaks, which determine when recessions occur. Specifically, NBER identifies:
• The length of the contraction, peak to trough.
• The length of the expansion, trough to peak.
• The length of the cycle, peak to peak.
• The length of the cycle, trough to trough.
They don’t predict when the next recession will occur. Instead, they will announce when the most recent recession has started and ended after-the-fact.
The following table shows NBER data since the end of World War II.
| 1-Peak | 2- Trough | 3-Contraction- Peak to Trough | 4-Expansion- Trough to Peak | 5-Cycle- Peak to Peak | 6-Cycle-Trough to Trough |
|---|---|---|---|---|---|
| November 1948(IV) | October 1949 (IV) | 11 | 37 | 48 | 45 |
| July 1953(II) | May 1954 (II) | 10 | 45 | 55 | 56 |
| August 1957(III) | April 1958 (II) | 8 | 39 | 47 | 49 |
| April 1960(II) | February 1961 (I) | 10 | 24 | 34 | 32 |
| December 1969(IV) | November 1970 (IV) | 11 | 106 | 117 | 116 |
| November 1973(IV) | March 1975 (I) | 16 | 36 | 52 | 47 |
| January 1980(I) | July 1980 (III) | 6 | 58 | 64 | 74 |
| July 1981(III) | November 1982 (IV) | 16 | 12 | 28 | 18 |
| July 1990(III) | March 1991(I) | 8 | 92 | 100 | 108 |
| March 2001(I) | November 2001 (IV) | 8 | 120 | 128 | 128 |
| December 2007 (IV) | June 2009 (II) | 18 | 73 | 91 | 81 |
Note: Column 5 is the sum of column 3 and column 4 of the same line. Column 6 is the sum of column 3 of the previous line and column 4 of the same line.
In addition, the contraction and expansion data is shown in the following chart.
So, when is the next recession?
Recessions are not determined by mathematical equations or charts, rather they are determined by economic conditions that cause the business cycle to move up and down. Since the end of World War II, the length of the shortest business cycle is 18 months (peak from previous peak) and the length of the longest business cycle is 128 months.
Today the U.S. is somewhere in between the shortest and the longest time frame for a business cycle.
The most recent peak was in December 2007. Seven years, or 84 months have passed since the last peak.
The most recent trough was June 2009. Six and a half years, or 66 months have passed since the last trough.
If the length of current and future business cycles is similar to the length of past business cycles, then it is likely the U.S. will see the next recession before the end of Governor Hickenlooper’s term in office.
While it is possible for the next recession to occur prior to the 2016 election, both parties are incented to take every possible step to prevent that from happening.
When is the next recession? Stay tuned!


