Colorado’s Employment Situation After Ten Months

After ten months, enough of the year has passed that Colorado’s employment situation for 2014 is virtually set. This post looks at overall and regional job growth, drivers of the regional economies, and industries that dominate state job growth.

Job Growth (Overall)
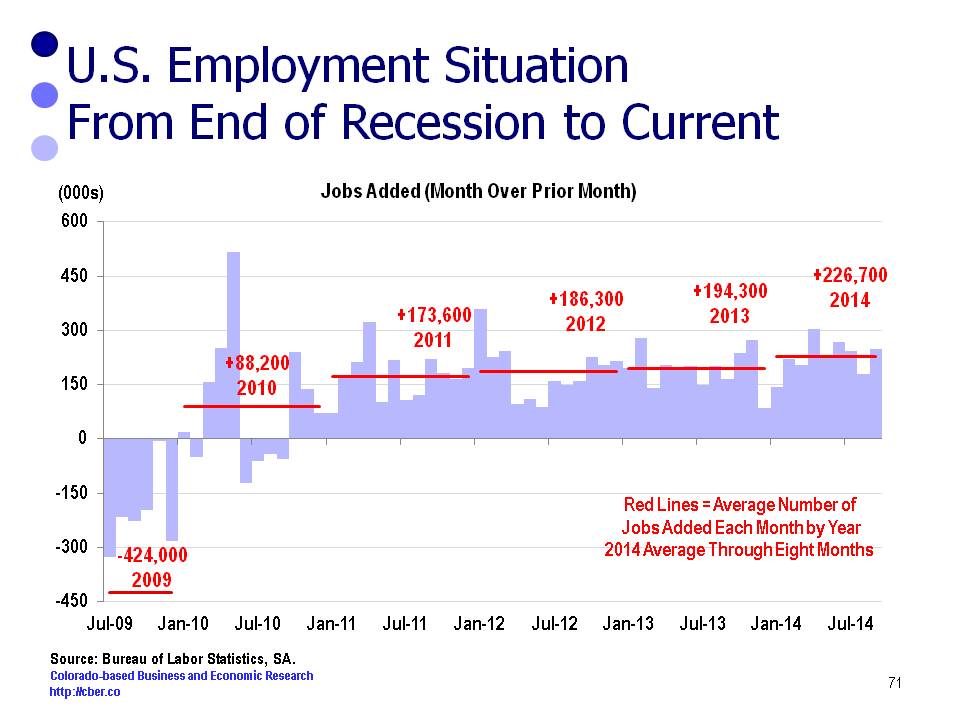
After BLS makes their March 2015 revisions the wage and salary employment will show that Colorado added at least 70,000 jobs this year. That is job growth of at least 2.9%.

Job Growth (Regional)
About 81% of Colorado’s job growth occurs in Colorado’s seven metro areas (listed below). The industry composition and the economies in these seven metro areas are distinct. As a result they have grown at different rates.

The estimated rates of job growth through ten months are:
• Greeley 5.0%
• Boulder 3.1%
• Fort Collins 2.8%
• Denver 2.8%
• Pueblo 1.8%
• Grand Junction 0.9%
• Colorado Springs 0.8%

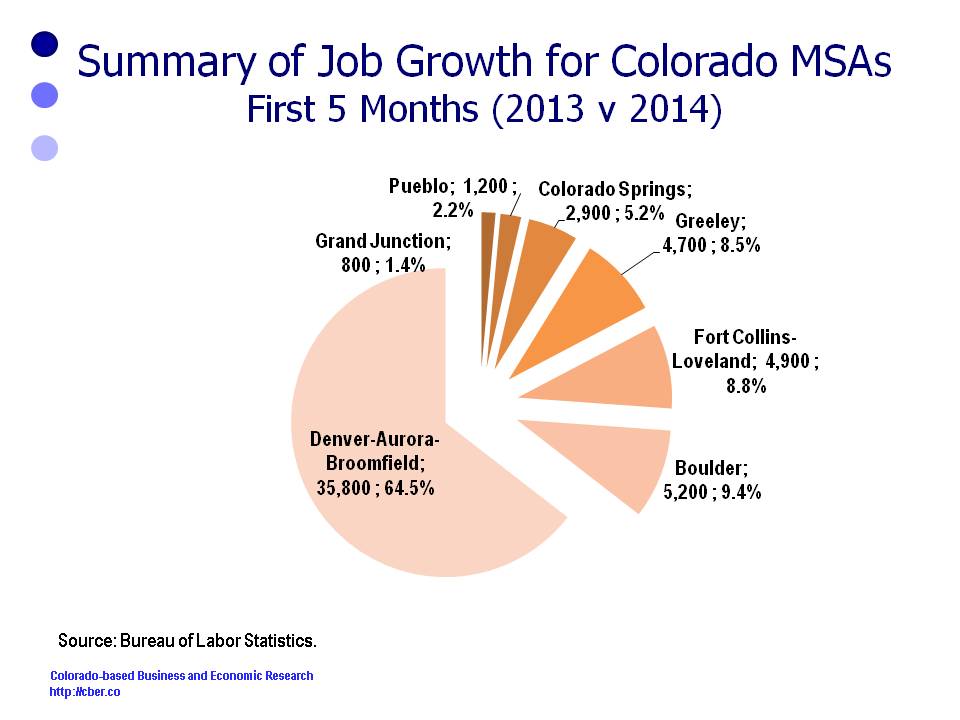
During this period the percentage of job growth in the MSAs was:
• Denver added 67.4% of the MSA jobs.
• Boulder added 10.0%.
• Combined, the Northern Colorado MSAs added 16.0% of all jobs (Greeley 8.5% and Fort Collins 7.5%).
• Colorado Springs added 3.6% of the MSA jobs.
• Pueblo added 2.1%.
• Grand Junction added almost 1%.

Drivers of Regional Economies
The economies of Colorado’s seven metro areas are very distinct as evidenced by the industries driving their economy.
• Greeley has been driven by the extractive industries and Vestas.
• Fort Collins has been driven by the high-tech industry, CSU, and spillover from the extractive industries.
• Boulder has posted gains as a result of the high-tech industry, and CU employment.
• Denver’s economy is more balanced than the smaller economies. Interestingly enough, it has grown at a slower rate in 2014 than 2013.
• Pueblo has benefitted from Vestas.
• Grand Junction has struggled to recover from the most recent “oil shale bust”.
• Colorado Springs is still feeling the pain from the exit of Intel. In addition, the wildfires during the summers of 2012 and 2013 played havoc with the economy. The local economy is very dependent on the military and defense funding for local businesses. These industries are typically more volatile than the overall economy.

Industries Dominating State Job Growth
• Throughout 2014, job growth across the state has been led by the following  sectors
o Accommodations and Food Services (AFS)
o Health Care
o Professional, Scientific, and Technical Services (PST)
o Construction
o Retail
These five sectors account for about 71% of total job growth in the state.

Colorado’s Diversity of Job Growth

cber.co tracks changes in employment for 23 sectors of the Colorado economy. Part of that tracking includes a two-step process for measuring Colorado’s diversity of job growth.

The first step is to identify the number of sectors that are adding jobs. For the last three years the data shows:
• In 2012 19 sectors added jobs
• In 2013 19 sectors added jobs
• In 2014 18 sectors will add jobs (estimate).

As a point of reference, a comparison can be made to the following years:
• In 1993 22 sectors added jobs
• In 1998 22 sectors added jobs
• In 2002 13 sectors added jobs
• in 2003 10 sectors added jobs
• in 2009 8 sectors added jobs
• In 2010 10 sectors added jobs.
This shows that during the best of times, some sectors lose jobs. As well, it illustrates that during the worst of times, there are sectors adding jobs.

Another way to look at the data is to calculate the percent of employment in sectors where jobs are being added. For the last three years the data shows:
• In 2012 the sectors that added jobs had 88.5% of total employment.
• In 2013 the sectors that added jobs had 89.2% of total employment.
• In 2014 the sectors that added jobs had 85.4% of total employment (estimate).
The 2014 percentage might increase when the BLS revises 2014 data in March 2015.

As a point of reference, a comparison can be made to the following years:
• In 1993 the sectors that added jobs had 99.1% of total employment.
• In 1998 the sectors that added jobs had 99.6% of total employment.
• In 2002 the sectors that added jobs had 49.4% of total employment.
• In 2003 the sectors that added jobs had 36.7% of total employment.
• In 2009 the sectors that added jobs had 27.3% of total employment.
• In 2010 the sectors that added jobs had 33.2% of total employment.

The data shows that since 2012 Colorado’s job growth has been diverse and solid.

diversity of job growth


U.S. and Colorado Unemployment Rates Continue to Decline

Nationally, the unemployment rate has dropped below 6.0%, to 5.9% and the number of unemployed is now below 9.3 million. While this decline is a positive sign, the number of unemployed remains about 2.5 million above the low point in the second half of 2006.

The BLS tracks the unemployment rate in 22 occupations. Ten of those occupations have unemployment rates below the natural rate of unemployment (5.0%).

Most likely there is upward pressure on wages in these occupations at a national level, as well as in Colorado.

Occupation Unemployment Rate
Legal occupations 2.2%
Management occupations 2.3%
Architecture and engineering occupations 2.4%
Healthcare practitioner and technical occupations 2.4%
Business and financial operations occupations 2.7%
Computer and mathematical occupations 2.8%
Life, physical, and social science occupations 2.8%
Community and social service occupations 3.3%
Education, training, and library occupations, 3.3%
Installation, maintenance, and repair occupations 3.4%
Healthcare support occupations 4.9%

Of the above occupations, the ones most critical to Colorado are:
• Architecture and engineering occupations
• Healthcare practitioner and technical occupations
• Computer and mathematical occupations
• Healthcare support occupations

Although the U.S. unemployment rate is approaching the natural rate of unemployment (5.0%), there is limited upward pressure on wages across the nation. This is reflected in the National Association of Business Economists October Survey, which indicated that in Q3 2014, 24% of the respondent firms raised their wages and salaries, about half the percentage that raised their wages in Q2. If there was a potential for upwards wage pressures earlier in the year, those pressures have eased significantly.

The Colorado unemployment rate, 4.7%, and the number of unemployed, 131,348, continues to decline.

Even though the unemployment rate is near the natural rate of unemployment there appears to be minimal upward pressure on wages, except in a few categories of occupations such as specialized high -tech jobs, computer related occupations, and healthcare. In addition, wage pressures may be felt in geographic areas, such as Weld County, where the extractive industries are booming.

In 2009 the average annual wages for all occupations in Colorado, as measure by the QCEW data, was $46,861. By 2013, average annual wages had increased to $50,873, an annualized rate of growth of 2.1%.

Unfortunately, during that same period, the Consumer Price Index for the Denver-Boulder-Greeley area increased at an annualized rate of 2.6%. In other words pay increases did not keep up with increases in the cost of living. This year inflation is projected to increase at a higher rate than the gain in total wages.

On average, Colorado employment is 65,200 greater for the first 9 months of 2014 than the same period in 2013. That total will likely be revised upwards when the BLS benchmarks the CES data series in March 2015.

Looking ahead for the remainder of the year, the tourism; construction; health care; and professional, scientific, and technical services sectors will continue to be the primary sources of growth. Although, the extractive industries are small they are the source of greater indirect job growth and significant output growth.

BLS August Jobs Numbers Revised Upward

Last month the Bureau of Labor Statistics delivered a Labor Day surprise when its monthly employment situation press release stated the U.S. had only added 142,000 jobs in August. This month the BLS reversed their bombshell announcement; they revised the August jobs numbers from +142,000 to +180,000 and July was revised from +212,000 to +243,000. In other words, their previous estimates for these two months missed their mark by 69,000.

Total nonfarm payroll employment increased by 248,000 in September. For the month job growth was led by professional and business services, retail trade, and health care.

These increases in wage and salary employment were accompanied by a decline in unemployment to 5.9%. The number of unemployed persons decreased to 9.3 million (That is still a lot of people). Compared to a year ago, the unemployment rate and the number of unemployed persons were down by 1.3 percentage points and 1.9 million, respectively.

In addition, the number of long-term unemployed (LTE) was remained at 3,000,000 people. The LTE are those jobless for 27 weeks or more and they account for 31.9% of the unemployed.

The outlook remains positive for the U.S. and Colorado through the end of the year.

August Jobs numbers

Utah Job Growth Outpacing Colorado

Colorado’s wage and salary employment is about twice the size of Utah’s wage and salary employment. In some state rankings, it has been reported that Utah is adding workers at a faster rate than Colorado.

Since 1990, Utah wage and salary employment has grown at a faster rate than Colorado, although the two states grew at a similar rate during the 1990s.

A review of the following six industries shows that Utah has increased at a faster relative rate than Colorado between 1990 and 2013:
• Construction
• Manufacturing
• Tourism
• Information
• Professional and Business Services
• Financial Activities

The following factors contribute to Utah’s faster rate of growth:
• Utah was showcased around the world for the 2002 Olympics.
• Utah has many of the same assets that Colorado has – quality of life, scenery, tourism, solid higher education.
• Because its rate of growth is calculated off a smaller base, Utah is likely to have a higher rate of growth. That statement is not intended to detract from Utah’s appeal as a place to live, work, and play.

It is common to rank and compare the performance of states. The most important take-away from this comparison is the fact that Colorado and Utah are both popular strong performing states.

Colorado vs. Utah Job Growth


Northern Colorado Leads MSA Job Growth

The Northern Colorado Metropolitan Statistical Areas (MSAs) are leading job growth for Colorado. Through five months of 2014, the leaders in MSA job growth were Greeley and Fort Collins.

The MSA job growth rates for five months follow:

  • Greeley 5.4%
  • Fort Collins 3.5%
  • Boulder 3.1%
  • Denver 2.8%
  • Pueblo 2.1%
  • Grand Junction 1.4%
  • Colorado Springs 1.2%

The rate of growth for the state was 2.9%.

The MSA job growth for five months follows:

  • Denver 35,800
  • Boulder 5,200
  • Fort Collins 4,900
  • Greeley 4,700
  • Colorado Springs 2,900
  • Pueblo 1,200
  • Grand Junction 800.

For the first five months of 2014 Colorado added about 67,100 workers compared to the same period in 2013. About 11,600 were outside the seven MSAs.

As expected Denver added the greatest number of jobs. The percentage of MSA job growth follows:

  • Denver 64.5%
  • Boulder 9.4%
  • Fort Collins 8.8%
  • Greeley 8.5%
  • Colorado Springs 5.2%
  • Pueblo 2.2%
  • Grand Junction 1.4%

Combined, the Northern Colorado MSAs added 17.3% of all jobs. The state’s seven MSAs accounted for about 83% of total job growth in the state for this period.

Though most of the state’s land mass is rural, most of the job growth is in the seven MSAs.

MSA Job Growth for Colorado


Denver Accounted for 70% of State’s Job Growth in 2013

In 2013, 68,100 jobs were added, an increase of 2.9% compared to 2012.  By comparison the annualized rate of the state’s job growth was 2.0% for 1990 to 2013.

Just over 70% of the jobs added were in the Denver MSA.

Between 1900 and 2013, Denver (1.8%) and Pueblo (1.3%) added jobs at annualized rates below the average for the state (2.0%). The other five MSAs added jobs at faster rates than the state:

  • Greeley, 2.9%.
  • Fort Collins, 2.6%.
  • Grand Junction, 2.4%.
  • Colorado Springs, 2.2%.
  • Boulder, 2.1%.

The Denver and Boulder MSAs had growth patterns similar to the state, while the growth patterns for the other 5 MSAs were different. For example, the Greeley and Mesa MSAs patterns were different because of oil and gas activity.

The recovery from the Great Recession was led by Fort Collins and Greeley, followed by Boulder and Denver – then Pueblo. Grand Junction and Colorado Springs have not returned to 2008 peak employment.


State's job growth for 2013 by MSA
Seventy percent of states’ job growth in Denver MSA.

©Copyright 2011 by CBER.

Colorado Added 68,100 Jobs in 2013

The Bureau of Labor Statistics recently released the preliminary employment revisions for 2013. The data showed that Colorado added 68,100 jobs in 2013, an increase of 2.9% compared to 2012.

  • Growth was led by Construction; Accommodations and Food Services; and Professional, Scientific, and Technical Services (PST).
  • None of the Supersectors lost jobs in 2013.
  • Several organizations were reclassified in the NAICS system during the year. They were moved from private health care and local government sectors to state government. This created artificial or structural levels of change for these 3 sectors.

The number of jobs added in 2013 was the 11th strongest year the state in terms of absolute job growth; however, it was only the 39th best year in terms of relative job growth.

After declines in employment in 2009 and 2010, Colorado added:

  •  36,300 jobs in 2011.
  •  54,400 jobs in 2012.
  •  68,100 jobs in 2013.

Job growth is expected to continue in 2014 at a rate similar to last year.


©Copyright 2011 by CBER.

ADP Report – Mid-Size Companies Adding The Most Jobs

ADP announced that the U.S. private sector added 175,000 jobs in January. The data shows mid-size companies adding the most jobs.

Since the official end of the Great Recession the ADP data shows the private sector has added 7,418,000 jobs.

The number of jobs added by company size category follows.

1 to 19 employees

  • 1,477,000 jobs added.
  • 19.9% of total jobs added.
  • 25.9% of private sector jobs.
  • 5.2% growth since the end of the recession.
    (See chart below for jobs added since the end of the recession).

20 to 49 employees

  • 1,191,000 jobs added.
  • 16.1% of total jobs added.
  • 15.9% of private sector jobs.
  • 7.0% growth since the end of the recession.

50 to 499 employees

  • 2,674,000 jobs added.
  • 36.0% of total jobs added.
  • 35.6% of private sector jobs.
  • 7.0% growth since the end of the recession.

500 to 999 employees

  • 474,000 jobs added.
  • 6.4% of total jobs added.
  • 6.9% of private sector jobs.
  • 6.4% growth since the end of the recession.

1,000+ employees

  • 1,602,000 jobs added.
  • 21.6% of total jobs added.
  • 15.8% of private sector jobs.
  • 9.7% growth since the end of the recession.

Jobs have been added across all size categories. The data show the following:

  • Well-established large companies (1,000+ workers) have added jobs at the fastest rate, 9.7%.
  • The 50 to 499 category has added the highest percentage of jobs 36.0%.
  • The 50 to 499 category is the largest category, 35.6% of private sector jobs.
  •  The 50 to 499 category has added the greatest number of jobs, almost 2.7 million.

The most encouraging news is the recent increase in the growth of smaller companies.
Mid-size companies adding the most jobs

©Copyright 2011 by CBER.

cber.co Colorado Economic Forecast for 2014 – 68,000 to 74,000 Jobs to be Added

In 2013 the state experienced natural disasters and self-inflicted political wounds, yet Colorado employment grew at a faster than expected rate. The cber.co economic forecast points to continued expansion  for 2014.

On a Positive Note…

  • The state population grew at a higher rate than expected in 2013. Stronger growth is on tap for 2014.
  • The story is the same for employment. In 2013, the state added approximately 68,000 workers and will add another 68,000 to 74,000 in 2014. This represents job growth in the rage of 2.9% to 3.1%.
  • Unemployment will continue to decline, and will be in the range of 5.5% to 5.8% at the end of 2014.
  • In 2013 consumers were delighted that gasoline prices declined. At the moment there is no reason to believe they will rise precipitously (knock on wood).
  • Colorado new car registrations have risen steadily for the period 2010 to 2013. A decline is unlikely in 2014.
  • Colorado’s general fund, particularly sales and income taxes, has been a benefactor of increased population, employment, and wages. Likewise the revenue for city and county governments has improved.

Some Mixed News…

  • Per Capita Personal Income will increase by 3.7% in 2014.  This is slightly less than the rate of growth for the U.S. Over the past two decades the gap between the U.S. PCPI and the state PCPI has closed significantly.
  • In 2014, Colorado inflation will be 3.0%, well above the rate for the U.S.
  • In Colorado, housing prices have increased at a faster rate than the nation. That is great news for home owners, but not so good news for people wanting to enter the housing market.
  • The Construction Sector is slowly improving.  Increased building activity supports growth in multiple sectors and causes greater congestion on the highways. For some, the latter is not desirable.
  • Although the state returned to 2008 peak employment, it will be a long time before the state returns to the 2007 peak number of establishments.

Looking ahead, the economy will build on the foundation established in 2013. Hopefully the state’s leadership will be less dysfunctional.

Click here to review the cber.co forecast and other economic reports.

cber.co forecast

©Copyright 2011 by CBER.