U.S. Job Growth Remains Strong

On August 7th, the Bureau of Labor Statistics released its monthly update for U.S. nonfarm payroll employment. The number of jobs increased by 215,000 in July and U.S. job growth falls in the solid-to-strong category.

The areas with the largest increases were retail trade, health care, professional and technical services, and financial activities.

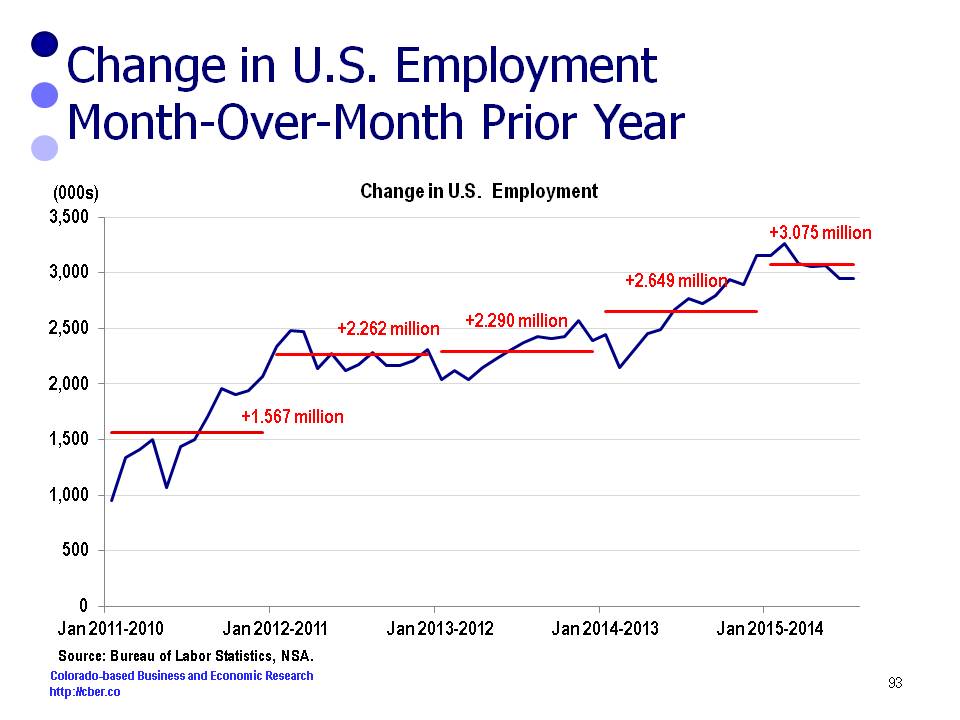
Average U.S. employment for the first seven months of 2015 is 3.1 million greater than the same period in 2014. That is about 256,000 net new jobs per month.

If job gains continue at the current pace, average annual wage and salary employment for 2015 will be about 142 million. As a point of reference, the 2015 population will be about 322 million.

Throughout 2015, U.S. employment has continued to post steady gains (month-over-month prior year) although there has been a slight downward trend since the change in employment peaked in February.

This downward trend is thought to be normal volatility and not a cause for concern. Even with the decrease, the number of jobs added this year will be well above the 2014 total.

All eyes are on the Fed and how they will interpret the latest news from BLS. They would like to see strong job and wage growth before they start raising interest rates; however it is most essential for them to see sustained, solid U.S. job growth. Unfortunately, for workers wage growth is less critical.

The consensus among most economists is that gradual rate hikes will begin in September.

The bottom line – the Fed will raise interest rates and U.S. employment will increase by 3.1 million this year. At this point, both are positive signs for the U.S. economy.

U.S. Job Growth


Where is the Automobile Industry Really Headed?

American voters should be required to read the 1954 best seller by Darrell Huff, How to Lie with Statistics. The book illustrates how data used by political leaders, economists, and business leaders represent their viewpoints. At times, a single set of data may tell different, but accurate stories about the subject matter.

This was the case in President Obama’s State of the Union speech on February 12 when he stated “We buy more American cars than we have in five years”.  A review of the data tells at least three different  stories (you may find additional interpretations of the data).

1. In February 2008, light truck and auto sales were 15,459,000 and interest rates were 7.27%. Total sales for December 2012 were 15,325,000 and January was slightly lower 15,200,000.  After plummeting, light truck and auto sales have returned to levels of five years ago.

2. In February 2009, sales had plummeted to 9,021,000 with interest rates of 6.92%.  For the period 1980 to 2012, this is the lowest level of sales since December 1981. That month sales were 8,849,000 and interest rates were 17.36%. Since late 2001, there has been heavy stimulation in the market causing sales to be “stolen from the future.” This includes zero percent and other creative financing programs as well as Cash for Clunkers. Given the level of past stimulation, a case can be made that the recent increased growth in auto sales is partly a function of altered consumption patterns and may not be sustainable.

3. Current light truck and auto sales are comparable to December of 1985, when 15,387,000 vehicles were sold and interest rates were 12.39%. Interest rates have dropped steadily since the high in December 1981 to 4.82% at the end of 2012. Given the current level of interest rates and the likelihood  they will increase, a case can be made that additional stimulation is unlikely to occur from low interest rates.

The President was correct in his statement (#1 above). While his positive interpretation of the data was appropriate for the occasion, it is possible that the growth of the auto industry will not be the topic of future State of the Union speeches.

Note: monthly light truck and auto sales are seasonally adjusted and annualized.


Copyright 2011 by CBER.

10 Years After 9/11 – Interest Rates and Equity Markets

In 2000, the national economy had been on a run that lasted about eight years. Interest rates were reasonable and the equity and housing markets were on an upward trend that seemed like it would never end.

Then 2001 and 9/11 hit!

The following comparisons show differences in key interest rates for December 2000 and December 2010:

Fed Funds Rate
Dec 2000 month-end 6.40%
Dec 2010 month-end .18%

30-year Fixed Rate Mortgage Fannie Mae
Dec 2000 month-end 7.41%
Dec 2010 month-end 4.47%

30-year FRM Fannie Mae FHA/VA
Dec 2000 month-end 7.20%
Dec 2010 month-end 5.06%

The following comparisons show differences in the equity markets for the same period.

S&P 500 Composite
Dec 2000 month-end 1,320,28
Dec 2010 month-end 1,257.64

DJIA (30 industrials)
Dec 2000 month-end 10,786.85
Dec 2010 month-end 11,577.51

Nasdaq Composite
Dec 2000 month-end 2,657.81
Dec 2010 month-end 2,631.56

Not only did the Lost Decade show a lack of gains in employment, it showed losses a lack of gains in financial
markets. (Source: FreeLunch.com)

©Copyright 2011 by CBER.