Economic Impact of Colorado Mining Employment is Significant

In October, the Bureau of Labor Statistics reported the Colorado Mining Sector employed about 35,000 workers, or about 1.4% of the state’s 2,534,600 wage and salary employees.

In 2014 the GDP for the Colorado Mining Sector was $19 billion, or 6.2% of the 2014 Colorado GDP. More importantly, the Mining Sector accounted for about 18.2% of the growth in the state’s GDP.

In a nutshell, mining employment is a small portion of total employment in Colorado. On the other hand, the industry makes a major contribution to the GDP.

The Oil and Gas Industry accounts for about 75% of the employment and GDP total.

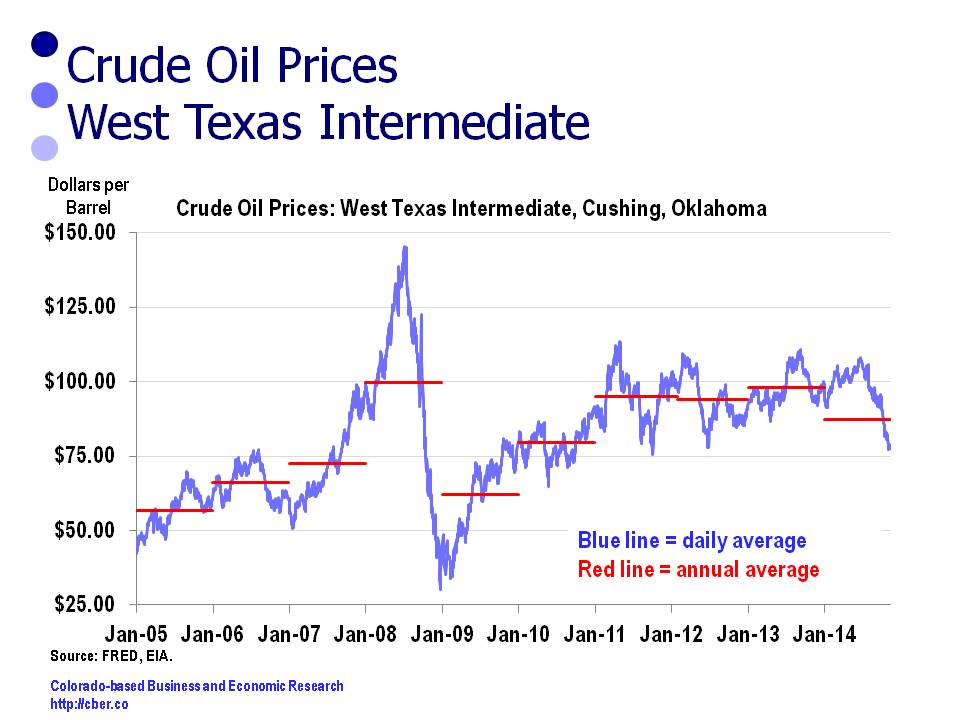
With that as a background, it is easy to see why state leaders were concerned when the price for a barrel of oil plummeted to below $40 per barrel in a matter of months.

To make matters worse, the Bureau of Labor Statistics may have overstated employment in the Oil and Gas industry by as much as 4,000 workers. In other words, the data for the state does not appear to have measured the direct, indirect, and induced impact of lower employment caused by lower prices for a barrel of oil.

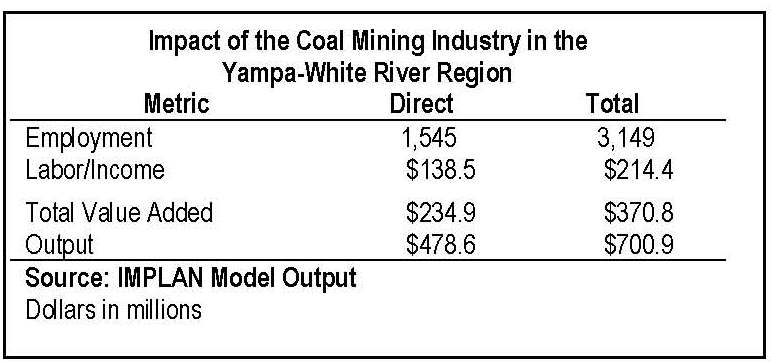
A quick analysis using IMPLAN shows the loss of 3,200 oil and gas workers and 800 support workers would result in a loss of $4.2 billion in economic activity and a total loss of 12,486 jobs. The direct average annual wages for the oil and gas industry are $96,425 and the direct average annual output per worker is $701,480.

The Bureau of Labor Statistics will update wage and salary data for 2015 in its benchmark revisions next March. At that point we will have a better look at the magnitude of the layoffs in the Mining Sector in 2015.

While we are anxiously awaiting the update, the reduction in mining employment is not a number we really want to see – it will be ugly!

mining impact

The Impact of Job Losses in the Oil and Gas Industry on the Colorado Economy

About a year ago the Colorado Oil and Gas Industry was turned upside down. Almost overnight the price for a barrel of oil plummeted.

Since dropping, prices for a barrel of oil have remained low, rig count has dropped, employment has declined, BUT production has remained at record levels.  At some point the disruption will become more settled and Colorado will move forward with a smaller oil and gas industry.

Projected revisions to the BLS employment data for Colorado suggest the oil and gas  industry could be reduced by 1,000 jobs for 2015.  Although the industry is small from an employment perspective, it is significant in terms of gross domestic product for the state and MSAs. This is particularly true in Mesa, Weld, and Denver counties. Much of the drilling occurs in Mesa and Weld counties and many of the headquarters or company offices  are located in the Denver MSA.

The IMPLAN model is designed to show how changes in employment or sales could impact the state economy. In this case, the Colorado Labor Market Information group has produced projections suggesting there will be a loss of 1,000 jobs in the oil and gas industry for 2015. The IMPLAN model indicates this will cause an additional loss of 1,800 indirect and induced jobs. In addition there will be a combined loss of $657 million in direct, indirect, and induced sales in the Colorado economy.

To date the robust mix of industries in Colorado has offset the job losses in the extractive industries. That is likely to continue for the remainder of the year and into 2016.

oil and gas industry


National Park System Crucial to Colorado Tourism

The National Park Service website indicates the Colorado tourism industry benefits from 13 national parks. These sites attract more than 6 million visitors annually with an economic benefit of about $375 million to Colorado.

Park Service Type Name Location State(s)
National Historic Site Bent's Old Fort LaJunta CO
National Park Black Canyon Of The Gunnison Montrose CO
River Corridor Cache La Poudre Colorado CO
National Historic Trail California Trail CO
National Monument Colorado Fruita CO
National Recreation Area Curecanti Gunnison CO
National Monument Dinosaur Vernal, UT & Dinosaur, CO CO and UT
National Monument Florissant Fossil Beds Florissant CO
National Park & Preserve Great Sand Dunes Mosca CO
National Monument Hovenweep Blanding, UT & Cortez, CO CO and UT
National Park MesaVerde Cortez and Mancos CO
National Historic Trail Old Spanish Trail AZ,CA,CO,NV,NM,UT
National Historic Trail Pony Express Trail CA,KS,MO,NE,NV,UT,WY
National Park Rocky Mountain Estes Park and Grand Lake CO
National Historic Site Sand Creek Massacre Kiowa County CO
National Historic Trail Santa Fe Trail CO,KS,MO,NM,OK
National Monument Yucca House Cortez CO

Colorado tourism

Headwaters Economics recently released their 2014 interactive economic impact report for the entire NPS system. In 2014 the 11 Colorado sites, that data is tracked for, had 6.1 million visitors with spending of $379 million.

Site Visitations Spending Jobs Income from Spending
Bent's Old Fort 24,555 $1,377 21 $546
Black Canyon Of The Gunnison 183,046 $10,948 148 $5,093
Colorado 416,862 $25,301 386 $9,972
Curecanti 931,368 $38,729 522 $16,391
Dinosaur 250,624 $14,298 194 $5,736
Florissant Fossil Beds 63,298 $3,550 55 $1,946
Great Sand Dunes 271,774 $15,755 234 $6,104
Hovenweep 26,808 $1,620 23 $622
Mesa Verde 501,563 $49,982 742 $19,580
Rocky Mountain 3,434,750 $217,020 3,282 $123,180
Sand Creek Massacre 7,402 $415 7 $113
Total 6,112,050 $378,995 5,614 $189,283

Locals are an important part of the Colorado tourism sector; however, they benefit from the industry much more than they contribute to it. In 2014 the Headwaters data showed:
• Colorado locals accounted for 11.1% of NPS tourism visitors.
• NPS Tourism spending by locals was 3.3% of the total for Colorado.
• About 1.2% of NPS tourism jobs were supported by local tourism spending.
• Locals accounted for 2.7% of the NPS income generated from tourism spending.

The contribution of NPS visitors to the Colorado economy is impressive; however, a recent report by Dean Runyon showed it is a small part of the total Colorado tourism industry. The report stated that a record 71.3 million visitors spent $18.6 billion in Colorado in 2014.yall

The next time you hear a Texas accent that sounds out of place, have an out-of-state driver cut you off because they are lost, or have to follow a Winnebago up a mountain pass at 25 mph – be glad they are here. Their spending in our state helps support our infrastructure and make our lifestyle even better.

The Economic Impact of the Colorado Retail Trade Industry

This post highlights the economic impact of the Colorado retail trade industry on the economies of Colorado and its twelve major metro counties: Adams, Arapahoe, Boulder, Broomfield, Denver, Douglas, El Paso, Jefferson, Larimer, Mesa, Pueblo, and Weld. It was prepared for the Economic Development Council of Colorado in the Spring of 2015.

Retail Trade is classified in the NAICS 44-45 category. The Retail Trade categories used in this report and their IMPLAN sector numbers are listed below. As can be seen Retail Trade includes everybody from American Furniture Warehouse to Burritos to Go in Broomfield.

320 Retail Stores – Motor vehicle and parts
321 Retail Stores – Furniture and home furnishings
322 Retail Stores – Electronics and appliances
323 Retail Stores – Building material and garden supply
324 Retail Stores – Food and beverage
325 Retail Stores – Health and personal care
326 Retail Stores – Gasoline stations
327 Retail Stores – Clothing and clothing accessories
328 Retail Stores – Sporting goods, hobby, book and music
329 Retail Stores – General merchandise
330 Retail Stores – Miscellaneous
331 Retail Nonstores – Direct and electronic sales

economic impact of the colorado retail trade industry

The key employment findings of the report are:
• There are 309,924 direct employees in the industry, including sole proprietors. This is 9.6% of total state employment.
• Overall, there are 439,315 total (direct, indirect, and induced) employees supported by the Colorado Retail Trade Industry.
• The counties with the greatest number of Direct Retail Trade employees are El Paso, Arapahoe, Denver, and Jefferson.

The key output findings of the report are:
• Average GRP per employee for Colorado is $90,658. Average Retail Direct GRP per employee is $68,404.
• The Retail Trade Sector contributes about $21.2 billion, or 7.2%, to the Direct Colorado GRP, $293 billion.
• Overall, the Retail Trade Sector supports $38.3 billion in GRP, or economic activity.
• The counties with the greatest Direct Retail Output are Arapahoe, El Paso, and Denver.
• The counties with the greatest Direct GRP per Direct Employee are Denver, Arapahoe, Boulder.

The key wage findings of the report are:
• The total direct wages are $10.1 billion, or 5.6% of total wages. Average Direct Retail Wages are lower than the average for all industries.
• Overall, the retail trade industry supports total wages of $16.6 billion.
• The counties with the highest average annual wages for Direct Retail are Denver, Arapahoe, and Jefferson.

Other key points follow:
• The Retail Trade Sector is a major employer in Colorado.
• The Bureau of Labor Statistics reports that Colorado has 175,355 establishments. There are 17,035 establishments in the Retail Trade Sector. This is 9.7% of total employment.
• Average wages and output are below the average for other industries.
• It is difficult for states to develop a competency in the Retail Trade sector even though many states and municipalities rely on retail sales taxes to fund their operations. The Colorado Retail Trade Sector has a location quotient slightly less than 1.0.

For a copy of the report click here.

Economic Impact of the Coal Mining Industry on Yampa-White River Region

This post summarizes the economic  impact of the coal mining industry in the Yampa-White River Region (Moffat County, Rio Blanco County, and Routt County) of Northwest Colorado and the state. It will focus on the two North American Industrial Classification System (NAICS) Sectors 211111 – Bituminous Coal Surface Mining and 212112 – Bituminous Coal Underground Mining, which are included in IMPLAN category 21.

Economic Impact of the Coal Mining Industry

The key employment findings of the report are:
• There are 1,545 direct employees in the Yampa-White River Region working in the coal mining industry. Overall there are 3,149 employees in the Yampa-White River Region working in the coal mining industry (direct, indirect, and induced).
• There are 3,469 direct employees in the state coal mining industry. Overall there are 8,467 employees working in the state coal mining industry (direct, indirect, and induced).

The key output findings of the report are:
• Direct output within the Yampa-White River Region associated with the coal industry is slightly less than $478 million. Direct output within the region associated with the coal industry is slightly less than $701 million (direct, indirect, and induced).
• Direct statewide output for the coal industry is slightly less than $1,052.1million. Direct statewide output for the coal industry is $1,838.0 million (direct, indirect, and induced).

To gain an appreciation for what these numbers mean and the impact of the coal mining industry, it is important to put them in perspective.
• At the state level, the coal mining industry is small. It is one of 405 industries, it accounts for .11% of total direct employment and .37% of total direct output. The industry has a higher than average output for employee level than other industries.
• At the industry level, the Yampa-White River Region employs 44.5% of the direct employees in the state’s coal mining industry. In addition, it accounts for 45.5% of the state’s direct coal mining output.
• At the regional level, the coal mining industry accounts for 4.6% of the region’s total direct employees, but it is responsible for 17.4% of the region’s total direct output. Clearly, output per worker for the sector is greater than the average.
• There are 188 industries in the Yampa-White River Region compared to 405 for the state. The region is less diversified than the state, which accentuates the importance of dominant role the coal mining industry plays in the Yampa-White River economy.
• Average wages, without supplements, for the region are $84,544 for surface mining and $90,132 for underground mining. Average wages are well above the state average for all industries. About 73% of the direct workers in the region are wage and salary employees.

The report was funded by the Economic Development Council of Colorado and local economic development organizations. For a full copy of the report, please click here.

Lower Crude Prices Are Here For Awhile

Since 2005, average annual prices for crude oil have ranged from $56 to $100 per barrel (red lines in the chart below). Daily fluctuations are clearly much more volatile (blue lines in chart below), $30 to $146.

Lower crude prices will mean a barrel of oil will be in the  range of $40 to $60 per barrel through mid-2015 as supply continues to exceed the demand.

In the near-term, lower crude  prices will have a minimal impact on producers in Colorado. If lower prices continue through the middle of next year, contract workers and small companies will be the first to “feel the pain.” A reduction in production could have a ripple effect on other industries that begins with the construction, retail, and finance industries.

Consumers will experience a small benefit because of lower prices for fuel costs; however, the oil production companies will experience lower profit margins and the state will collect less revenue from severance taxes. Overall, the net economic effect of lower crude prices on the state will likely be negative.

lower crude prices


Economic Development 101 – Basics Concepts of Economic Activity

Over the past two months there have been a variety of reports about companies coming to Colorado and possible incentives offered to bring them to the state. These incentives are typically based on an estimate of the magnitude of fiscal and economic activity that will be derived by the company relocating, expanding, or staying in state.

There are many different models that can be used to measure economic impact. Impact studies can be conducted for companies, industries, or special events. One of the models frequently used in the state looks at five factors: payroll, construction, purchases, multiplier effect or secondary benefits, and visitor impacts. Economic activity is the sum these factors.

• Total payroll is a function of the number of employees and wages. In most cases, payroll is the largest
contributor to economic activity.
• Construction contributes to economic activity if new facilities are being added or if existing facilities have major or ongoing renovations.
• Purchases are a measure of the company’s local supply chain. For example, a company may purchase office supplies, cleaning services, or advertising expertise from local companies. As well, purchases may indicate the company’s contribution to the local tax base. Some incentives are based on the amount of taxes paid locally and may be granted to offset a portion of those taxes.
• Secondary benefits, or the multiplier effect, are an attempt to measure the indirect impact of the company.
Depending on the industry and company, the multiplier effect is often a significant portion of total activity. In
some cases they are considered to be “fuzzy” and some state agencies do not include them when calculating economic activity.
• Visitor impacts measure the spending of overnight visitors. They may include vendors, visiting experts,
attendees at conferences or meetings, or out of town employees. Typically, the visitor impacts are the smallest portion of economic activity; however, hotels or special events (bike races, stock shows, Super Bowls, World Series) will derive a majority of their economic activity from visitors.

There is also fiscal activity or taxes paid by the company and taxes paid by its employees. Fiscal activity is
almost always a subset of the economic activity. City, state, and local governments are particularly interested in how their bottom line will change as a result of a new company or event. Many incentives are based on a company’s fical activity.

Some impact analyses describe only the impact of a company or an event from the fiscal or economic activity
generated. It is more appropriate to also include the cost of government associated with services provided to the company or eent.

Finally, there are intangible benefits. This may include company or employee contributions to charities, donation of facilities for public meetings, or attraction of intellectual firepower that benefits the overall community.

There is merit in using a common model, such as the one described above, in evaluating economic activity; however, every project contributes to the economy in a different way and comparisons between projects and incentives are often difficult. The challenge comes in communicating the impacts of a company or event in a way that can be comprehended by decision makers.

©Copyright 2011 by CBER.