Boulder County and Larimer County Business Development

Both Boulder County and Larimer County are the source of innovation and entrepreneurship that helps drive the Colorado economy.

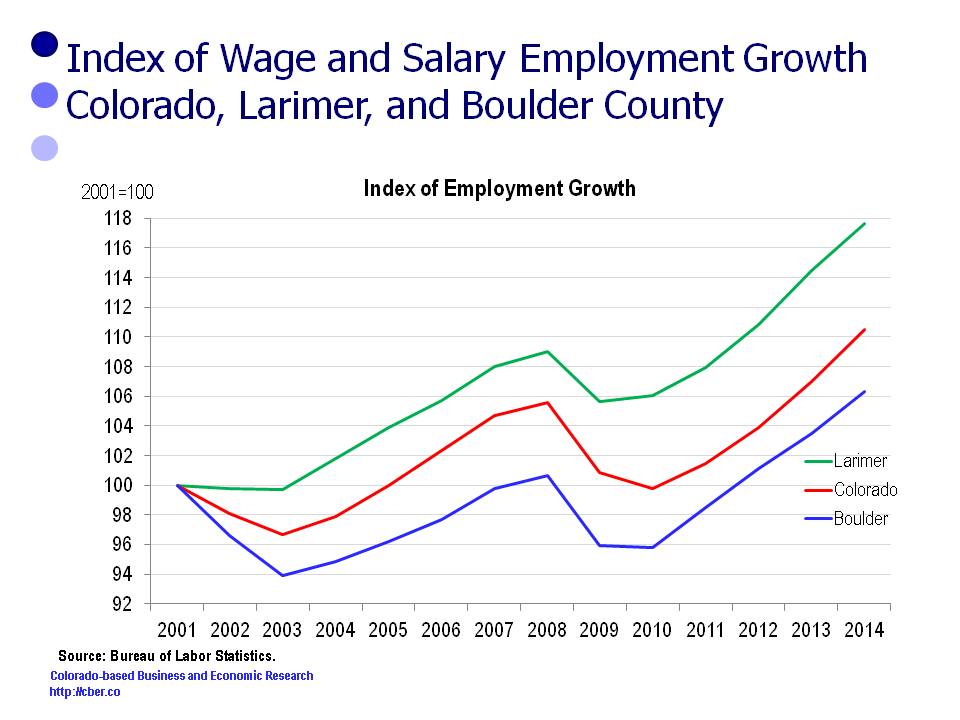
This analysis compares changes in the unemployment rate, population growth, the number of private sector establishments, and employment. It shows how the growth patterns for the two counties are significantly different for these demographics.

In summary, this comparison shows that:
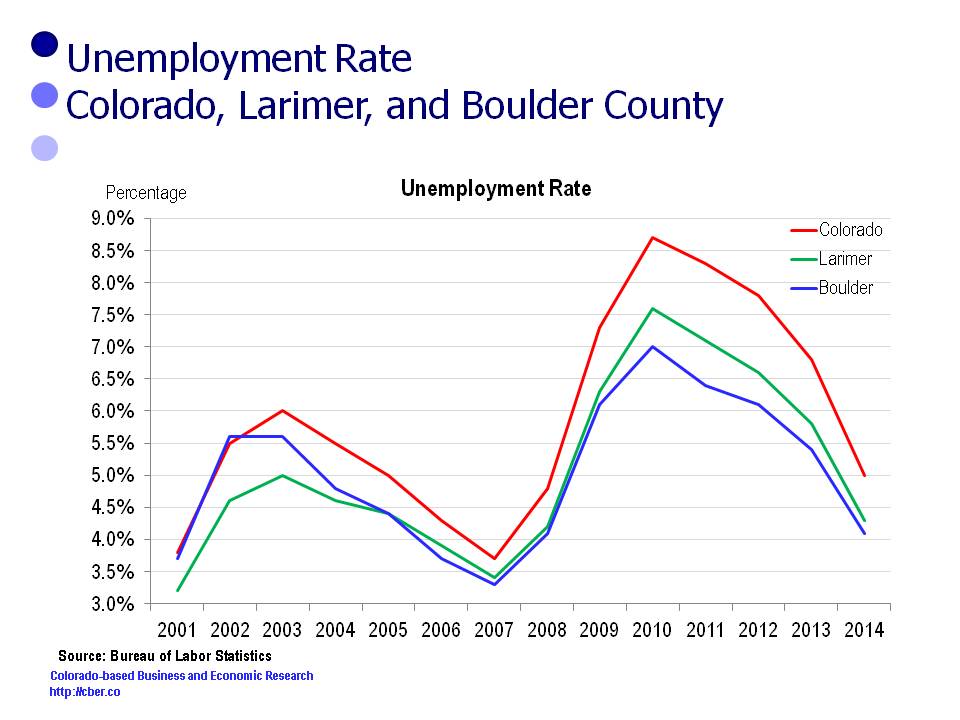
• Since 2001, Boulder County and Larimer County have usually had unemployment rates below the state – which is a mixed blessing.
• Since 2001, the population, employment, and number of private sector establishments for Boulder County have grown below the rates for Colorado and Larimer County.
Finally, this analysis poses questions that relate to the changes in these data sets.

Unemployment Rate

Typically, the unemployment rates for both Boulder and Larimer County are below the rate for the state.Boulder County and Larimer County
Population

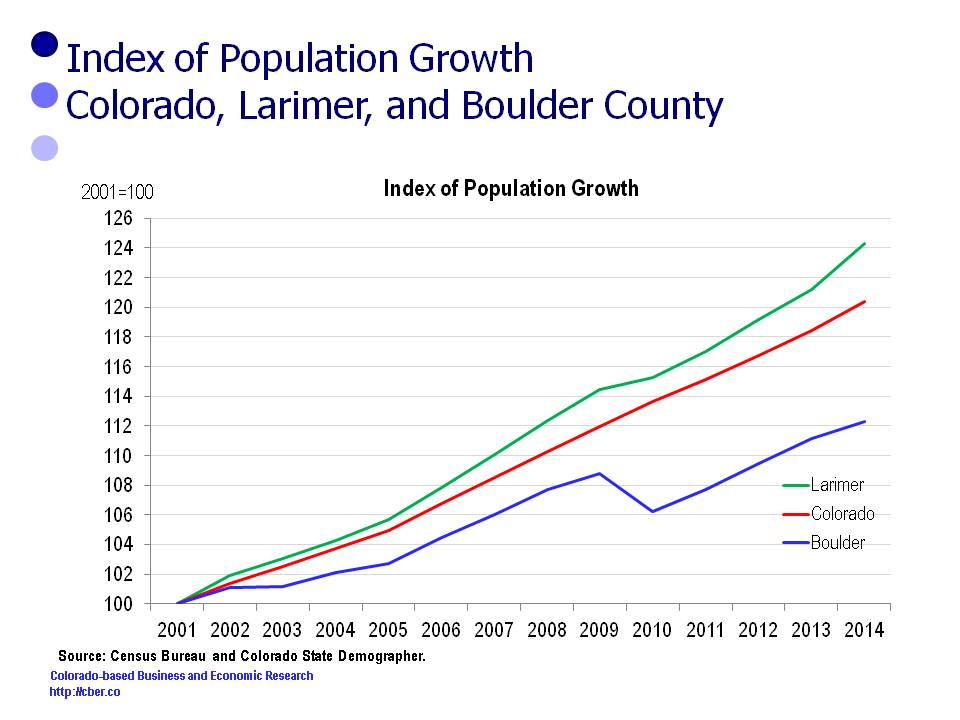
In 2001 Larimer County population was 260,746. It increased by 63,376 and was 324,122 in 2014.
In 2001 the Colorado population was 4,444,513. It increased by 906,059 and was 5,350,572 in 2014.
In 2001 Boulder County population was 278,981. It increased by 34,352 and was 313,333 in 2014.

For this period the rates of change in the population follow:
• Larimer County 24.3%
• Colorado 20.4%
• Boulder County 12.3%.

Boulder County and Larimer County

Establishments

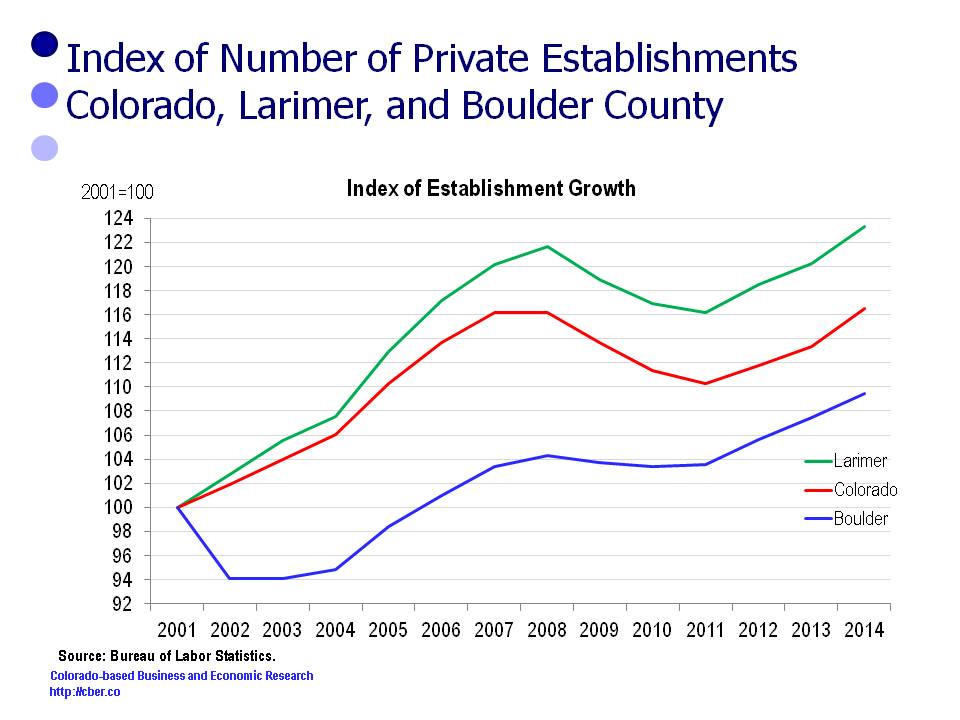
In 2001 there were 8,479 Larimer County establishments. The number increased by 1,976 to 10,455 in 2014.
In 2001 there were 151,025 Colorado establishments. The number increased by 24,957 to 175,992 in 2014.
In 2001 there were 12,335 Boulder County establishments. The number increased by 1,165 to 13,500 in 2014.

For this period the rate of change in the number of establishments follows:
• Larimer County 23.0%
• Colorado 16.5%
• Boulder County 9.4%.

Boulder County and Larimer County

Employment

In 2001 Larimer County employment was 126,300. It increased by 22,300 and was 148,600 in 2014.
In 2001 Colorado employment was 2,226,800. It increased by 234,000 and was 2,460,800 in 2014.
In 2001 Boulder County employment was 166,200. It increased by 10,500 and was 176,700 in 2014.

For this period the rate of change in the employment follows:
• Larimer County 17.6%
• Colorado 10.5%
• Boulder County 6.3%.

Boulder County and Larimer County

Implications

The following questions arise when looking at the changes in the unemployment rate, population, the number of private sector establishments, and employment in Boulder County and Larimer County. (Boulder County is also the Boulder MSA and Larimer County is the Fort Collins MSA).

• How do organizations in Boulder and Fort Collins find qualified workers when the regional unemployment rate is lower than the state and other MSAs? Do they have established training programs? Do they recruit workers from other companies (in-state or out-of-state)? Do they provide their workers premium compensation packages?
• Why is the rate of growth for the Boulder population lower than Fort Collins and the state? Is this a result of a lack of affordable and attainable housing in Boulder? Will the completion of improvements to the 36 corridor make it easier for workers to commute to Boulder? Can commuters afford to use it?
• Why are the number of new business establishments in Boulder growing at a slower rate than Colorado and Fort Collins? Is there a lack of adequate commercial space? Is commercial real estate too expensive in Boulder? Why are other areas more attractive? Is it too expensive to operate a business in Boulder? Is it necessary to export innovative ideas out of Boulder so companies can be successful? Why do companies stay in Boulder
• Why is the employment growth rate for Boulder lower than the state and Fort Collins?

This analysis of data for Larimer, Boulder, and Colorado shows that communities have varied business development policies and priorities that have been successful in different ways.
Establishment Growth Tops in Broomfield, Denver, and Douglas County

Since the end of the recession establishment growth occurred fastest in the following counties: Broomfield, Denver, and Douglas.

The Quarterly Census of Employment and Wages (QCEW) data provides trends for the creation of establishments by county. To be included in the QCEW database, establishments must have at least one employee.

Between 2002 and 2013 the number of Colorado establishments increased at an annualized rate of 1.0%. Between 2009 and 2013 the number of Colorado establishments changed at an annualized rate of -0.1%.

Year Establishments
2002 153,830
2003 156,986
2004 160,104
2005 166,540
2006 171,682
2007 175,442
2008 175,410
2009 171,729
2010 168,176
2011 166,537
2012 168,824
2013 171,249

For the period 2002 to 2013, the number of establishments in Broomfield, Douglas, and Weld County grew at the fastest rate, while the number of establishments in Arapahoe, Jefferson, and Pueblo changed at the lowest rates.

Year County
County/State 2002 vs. 2013
Broomfield 5.1%
Douglas 4.2%
Weld 2.0%
Larimer 1.4%
Boulder 1.2%
El Paso 1.1%
COLORADO 1.0%
Denver 1.0%
Adams 0.7%
Arapahoe 0.4%
Jefferson 0.2%
Pueblo -0.5%

For the period 2009 to 2013, the number of establishments in Broomfield, Denver, and Douglas County grew at the fastest rate, while the number of establishments in El Paso, Jefferson, and Pueblo changed at the lowest rates.

County/State 2009 vs. 2013
Broomfield 2.5%
Denver 1.5%
Douglas 1.4%
Boulder 0.9%
Larimer 0.3%
Arapahoe 0.1%
Weld 0.1%
COLORADO -0.1%
Adams -0.2%
El Paso -0.2%
Jefferson -0.5%
Pueblo -1.9%

It is interesting to note that Boulder County, often regarded as the hotbed of entrepreneurship, was not at the top of the list for the percentage of establishments added.

Why are People Moving Out of Boulder County?

Boulder County is the hub of Colorado’s high-tech industry.  It is the home of IBM, Ball Aerospace, and several federal labs and a host of other high-tech companies. At times the Boulder economy is like the city’s image – it sometimes moves to the beat of a different drummer. For instance, the unemployment in the county is typically lower than that of the state, average annual wages are much higher than the state average, and the county economy often lags the state when entering recessions.

As well, the county population increased by 0.7% during the 2000s, a little over half the rate of growth for the state. That is not particularly surprising given the high prices of housing in the City of Boulder and the image that it has developed as a “no growth” city (Boulder is the dominant city in the county). Between 2000 and 2010, the county population increased about 19,232 people. About  84% of that growth occurred in 4 years,  2001 and 2006-2008.

Looking more closely, it can be seen that during the first half of the past decade, the natural rate of increase for the county was between 2,000 and 2,400 people a year (The natural rate of increase is births minus deaths). The rate tapered off during the second half of the decade and ranged between 1,600 and 1,900. All together the natural rate changed by 20,296 people.

The shocker is that there was negative net migration during this period (Net migration is the difference between the number of people who move in and the number who move out). In other words, the hospitals and funeral homes were busy, but apparently the moving vans were busier.

So what does this mean for the county? At first glance, the implications could be significant – it could affect schools, tax receipts, and services provided. Stay tuned as the story unfolds in the months ahead.


©Copyright 2011 by CBER.

Northern Colorado Economic Development Efforts – Thinking Big

The Northern Colorado counties are thinking BIG!

The five-county metro area (Boulder, Broomfield, Adams, Larimer, and Weld) have very different economies, assets, and distinctive competencies. Combined, they provide the foundation that can drive a strong recovery from the Great Recession and continue to transform the state economy.

From an economic development perspective, the strengths of the region are:
• Agriculture (Weld and Adams County)
• Air transportation (DIA, Front Range, Rocky Mountain)
• Beverages (Budweiser, Lefthand Brewing, and microbreweries)
• Construction
• Corporate headquarters (Interlocken)
• Extractive industries (Niobrara)
• Federal facilities (NOAA, NIST, NCAR, and a host of facilities in Fort Collins)
• Ground Transportation (their proximity to major highways makes them a hub)
• Health care (Fitzsimons)
• Higher education facilities
• High tech clusters (they are a hub for biosciences, nanotechnology, photonics, renewable energy, software)
• Proximity to major highways (I-25, I-70, I-76)
• Tourism (Rocky Mountain National Park and Eldora Ski Area)
• Warehousing (Adams County).

By county, the big thoughts are:
• Boulder – Conoco Phillips is planning to open a renewable energy research facility in Louisville.
• Broomfield – The Regional National Archives will open in 2013, improvements are on tap for the 36 corridor beginning in 2012, talks are continuing on the Denver beltway, a high-tech business park is planned for the northern part of the county.
• Adams – Changes to the National Western Stock Show are being discussed that could include either a makeover or relocation to a different facility, a Gaylord Hotel/Theme Park at DIA is being talked about , and the Spaceport at Front Range Airport is in the planning states.
• Larimer -The ACE park has recently been renamed the Rocky Mountain Innovation Center. Hopes are to turn the old Agilent facility in Loveland into a clean-tech, aerospace, high-tech facility.
• Weld – The county has always been a focal point for energy and agriculture. Renewable energy and the Niobrara oil fields have increased its prominence in that area.

The fact that the economy has not fully recovered has not stopped the leaders in the northern part of the state from making aggressive plans for the future. Will all of these projects come to fruition? Probably not, but the fact that there are leaders with a vision will create growth for the region.


©Copyright 2011 by CBER.