Rocky Mountain National Park Will Top 4 Million Visitors in 2015

For many years Rocky Mountain National Park has been one of the state’s top tourist attractions. This year it is on track to surpass four million visitors.  Lower gas prices have played a role in increasing the number of visitations at Rocky Mountain as well as other western national parks.

In addition, the higher number of visitors is a result of the celebration of the park’s 100th birthday and the publicity surrounding that landmark. Throughout the year there have been numerous events celebrating the event that culminated with a re-dedication of the park on September 4th. National Park officials have indicated that visitations are frequently 10% to 15% higher during their centennial years.

The park opened in 1915 and 31,000 people visited the park. By 1948, the number of visitations topped 1 million for the first time (1,023,262). More recently the number of visitors has shown steady growth:
• 2010   2,955,821
• 2011   3,176,941
• 2012   3,229,617
• 2013   2,991,141
• 2014   3,443,501
• 2015   4,100,000 estimated.

Note: the decline in 2013 is a result of a federal government shutdown and severe flooding.

Here are some fascinating facts about Rocky Mountain National Park from the park’s website:
•Rocky Mountain National Park was established in 1915.
•The Continental Divide (a demarcation of the flow of water between the Pacific Ocean and Atlantic Ocean) runs through the park.
•Grand Lake Cemetery (which was founded in 1892) is the only active community cemetery operating inside a national park.
•Elevations inside Rocky Mountain National Park range from 8,000 feet in the valleys to 14,259 feet at the top of Longs Peak (the highest point in the park).

In Rocky Mountain National Park, there are:
•35 trailheads, with 359 miles of established trails
•585 drive-in campsites (situated in 5 campgrounds) and 200 backcountry campsites
•60 types of mammals (including moose, elk, bighorn sheep, black bears, coyotes, and mule deer)
•280 species of birds
•900 different plants
•150 lakes
•476 miles of streams and creeks, including, most notably, the headwaters of the Colorado River
•260 miles of horse trails
•5 visitor centers.

Whether it is the year ’round spectacular views, the spring-time flowers, or the bugling elk in October – its worth the trip.Rocky Mountain National Park

Garden of the Gods – Visitors from 36 States

When out-of-state tourists and staycationers compile their short list of things to do and places to go in Colorado they think about activities such as skiing, rafting, golf, tennis, hiking, or biking. The top spots on their list include such gems such as Mesa Verde, Rocky Mountain National Park, and the Great Sand Dunes. Destinations include Aspen, Steamboat, Vail, Telluride, or Estes Park.

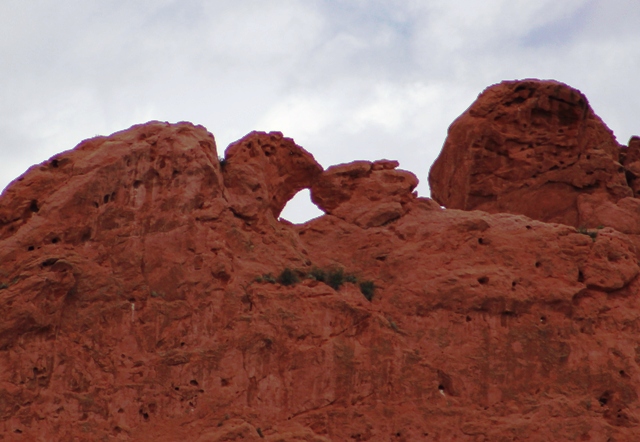
garden of the gods 170 kissing camels
The Garden of the Gods Kissing Camels

Colorado Springs and the Garden of the Gods are seldom at the head of the list of places in Colorado.. They appear to be like Don Rickles – they don’t get no respect; however, the following metrics posted in the Garden of the Gods Visitor and Nature Center suggest that may not be the case:
• The center is commemorating its 20th year of service to the park:
• 12.5 million visitors have passed through the center during that time.
• 121,876 school kids have visited the center.
• 7,254 tour buses have stopped by.
• Volunteers have logged 181,935 hours of service.
• $2.3 million has been donated to the park from the Garden of the Gods Foundation.

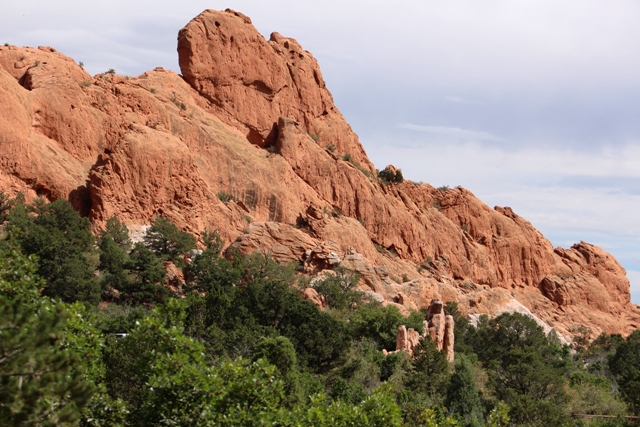
garden of the gods

A more impressive metric came from an informal, unscientific “back of the envelope” study by two high school girls who identified license plates on vehicles from 36 states in and around the park. The survey was conducted over a span of three and a half hours. The states included:
• Alaska
• Arizona
• Arkansas
• California
• Colorado
• Connecticut
• Dakota
• Florida
• Georgia
• Illinois
• Indiana
• Iowa
• Kansas
• Louisiana
• Maine
• Maryland
• Massachusetts
• Michigan
• Minnesota
• Missouri
• Montana
• Nebraska
• Nevada
• New Mexico
• New York
• North
• North Carolina
• Ohio
• Oklahoma
• Pennsylvania
• South Dakota
• Tennessee
• Texas
• Utah
• Virginia
• Washington
• Wyoming
The duo conducting the study estimated that inside the park, the out of state plates outnumbered the Colorado plates.

Visitors to the park enjoyed the scenery and natural beauty of the area. In addition they hiked, biked, climbed, picnicked, and snapped photographs.

From an economic perspective, opportunities to spend money within the park were limited to the Visitor and Nature Center at one of the entrances and the Trading Post inside the park. In other words, the contributions to the local economy occurred in the restaurants, hotels, gasoline stations, and retail stores in Colorado Springs, Manitou Springs, and other towns in the region.

Though the license plate data is unscientific, it illustrated the strength of Colorado and Colorado Springs as tourism attractions. Clearly, Coloradans are not the only ones who think the state is a great place to live, work, and play!

For more details check out the Garden of the Gods website.  Better yet, the next time you are in Colorado Springs, take your camera, hiking shoes, and your Ipad and count the number of out-of-state plates.

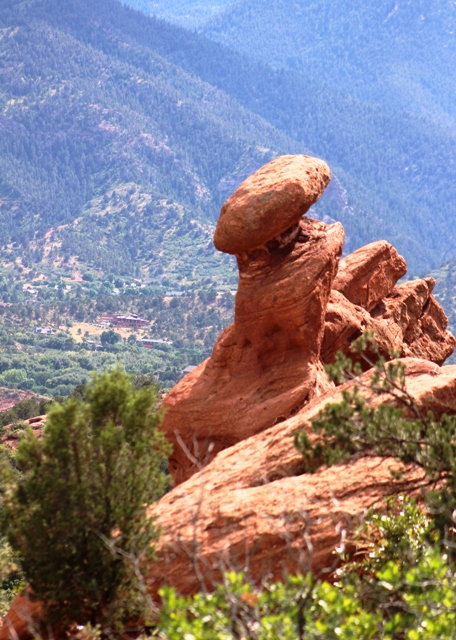
garden of the gods 186 2


National Park System Crucial to Colorado Tourism

The National Park Service website indicates the Colorado tourism industry benefits from 13 national parks. These sites attract more than 6 million visitors annually with an economic benefit of about $375 million to Colorado.

Park Service Type Name Location State(s)
National Historic Site Bent's Old Fort LaJunta CO
National Park Black Canyon Of The Gunnison Montrose CO
River Corridor Cache La Poudre Colorado CO
National Historic Trail California Trail CO
National Monument Colorado Fruita CO
National Recreation Area Curecanti Gunnison CO
National Monument Dinosaur Vernal, UT & Dinosaur, CO CO and UT
National Monument Florissant Fossil Beds Florissant CO
National Park & Preserve Great Sand Dunes Mosca CO
National Monument Hovenweep Blanding, UT & Cortez, CO CO and UT
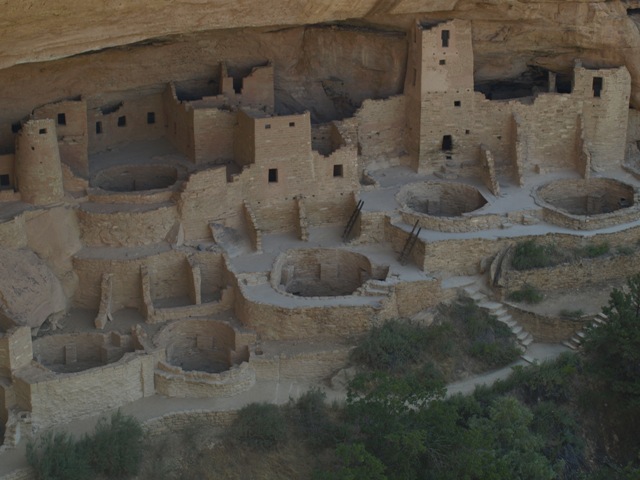
National Park MesaVerde Cortez and Mancos CO
National Historic Trail Old Spanish Trail AZ,CA,CO,NV,NM,UT
National Historic Trail Pony Express Trail CA,KS,MO,NE,NV,UT,WY
National Park Rocky Mountain Estes Park and Grand Lake CO
National Historic Site Sand Creek Massacre Kiowa County CO
National Historic Trail Santa Fe Trail CO,KS,MO,NM,OK
National Monument Yucca House Cortez CO

Colorado tourism

Headwaters Economics recently released their 2014 interactive economic impact report for the entire NPS system. In 2014 the 11 Colorado sites, that data is tracked for, had 6.1 million visitors with spending of $379 million.

Site Visitations Spending Jobs Income from Spending
Bent's Old Fort 24,555 $1,377 21 $546
Black Canyon Of The Gunnison 183,046 $10,948 148 $5,093
Colorado 416,862 $25,301 386 $9,972
Curecanti 931,368 $38,729 522 $16,391
Dinosaur 250,624 $14,298 194 $5,736
Florissant Fossil Beds 63,298 $3,550 55 $1,946
Great Sand Dunes 271,774 $15,755 234 $6,104
Hovenweep 26,808 $1,620 23 $622
Mesa Verde 501,563 $49,982 742 $19,580
Rocky Mountain 3,434,750 $217,020 3,282 $123,180
Sand Creek Massacre 7,402 $415 7 $113
Total 6,112,050 $378,995 5,614 $189,283

Locals are an important part of the Colorado tourism sector; however, they benefit from the industry much more than they contribute to it. In 2014 the Headwaters data showed:
• Colorado locals accounted for 11.1% of NPS tourism visitors.
• NPS Tourism spending by locals was 3.3% of the total for Colorado.
• About 1.2% of NPS tourism jobs were supported by local tourism spending.
• Locals accounted for 2.7% of the NPS income generated from tourism spending.

The contribution of NPS visitors to the Colorado economy is impressive; however, a recent report by Dean Runyon showed it is a small part of the total Colorado tourism industry. The report stated that a record 71.3 million visitors spent $18.6 billion in Colorado in 2014.yall

The next time you hear a Texas accent that sounds out of place, have an out-of-state driver cut you off because they are lost, or have to follow a Winnebago up a mountain pass at 25 mph – be glad they are here. Their spending in our state helps support our infrastructure and make our lifestyle even better.

Warmer Weather – A Source of Job Creation?

Recently, a local economist hypothesized that the recent strength of the Colorado economy was correlated with a warmer winter. The rationale for this hypothesis was that warmer weather may have benefitted outdoor sports such as golf courses, biking, rollerblading, and so forth. In addition, the economist surmised that retail sales would be stronger because warmer weather was more conducive to shopping and increased construction activity.

On one hand, the warmer weather theory sounded plausible because the weather “seemed” milder this winter, but on the other hand it sounded like it was full of hot air.

Premise 1 – The winter was warmer.
If heating degree days are the defining factor for how cold a winter is, then the period October 2011 through March 2012 was negligibly colder than the prior year. For this six month period, the most recent October, December, and February were colder, the two Novembers were similar, and January and March were warmer this year. (A larger number means it is colder, more heat is needed to heat a building).

October 2010         174 heating degree days
November 2010     645 heating degree days
December 2010     789 heating degree days
January 2011          925 heating degree days
February 2011        863 heating degree days
March 2011             513 heating degree days
Total                      3,909 heating degree days

October 2011          312 heating degree days
November 2011      636 heating degree days
December 2011  1,058 heating degree days
January 2012           763 heating degree days
February 2012         935 heating degree days
March 2012              364 heating degree days
Total                       4,068 heating degree days

Possibly it seemed warmer, because there didn’t seem to be snow on the ground that often. A comparison of snowfall for the metro area shows that there was 2.5 times as much snow this past winter as the prior year.

October 2010         none
November 2010    1.5 inches
December 2010    3.3 inches
January 2011         8.0 inches
February 2011       5.3 inches
March 2011            2.5 inches
Total                      20.6 inches

October 2011         8.5 inches
November 2011    4.5 inches
December 2011 16.5 inches
January 2012        4.9 inches
February 2012    20.2 inches
March 2012         none
Total                     54.6 inches

It is truly a shocker to learn that the past winter was actually colder and wetter than the previous year. The timing of the storms, the lack of wind, or some other factor must have created the perception that it was warmer this past winter.

Even with greater snowfall in the metro area, snowpack is below average and 95% of Colorado is reportedly in drought conditions. Two significant forest fires have occurred and summer hasn’t arrived.

Conclusion: Premise 1 is FALSE.

Premise 2 – The warm weather resulted in increased participation for local sporting activities.
There is no easy way to prove this. HOWEVER, the lack of snow in the ski country, at the right times, was in part responsible for diminished lift ticket sales – a decrease of more than 7%. Ouch that hurts! Not only did the lack of snow hurt ski business it will play havoc with rafting businesses this summer.

Conclusion: #2 Possibly true in the metro areas, FALSE in ski areas.

Premise 3 – Warm weather means stronger retail sales.
This is an interesting concept that is difficult to prove. Cold and snowy weather on key shopping days have reduced retail sales during past Christmas shopping seasons, but there is no evidence that warmer weather has increased trade sales. Retail sales are noticeably higher compared to a year ago, but that is attributed to more people working than last year at this time. And in some cases, sales are higher because retailers have finally been able to raise prices. Sales may be higher in the metro areas, but they are probably below expectations in the ski country because of reduced traffic.

Conclusion: #3 – Possibly true in the metro area, FALSE in ski areas.

Premise 4 – Warm weather means increased construction activity.
For the six month period October to March there were 114,500 construction workers this year versus 113,300 last year. Last June, the Construction sector finally bottomed out from the 2007 recession and has been slowly adding jobs since. The big boost of construction jobs in January is more likely a result of improved economic conditions than warmer weather.

Conclusion:#4 – Inconclusive.

One of the fun things about economics is dissecting “grassy knoll” or “warmer weather” theories to see if they are true, partially true, or false. In this case, it is highly improbable that the “warmer” weather was a source of net job creation. The gains in revenue at Denver golf courses, bike shops, and shopping malls were offset by losses on the ski slopes and sales in mountain t-shirt shops, hotels, and restaurants. The warmer weather will also result in a dismal rafting season and increased costs for fighting forest fires.

For a more complete update on the recovery of the Colorado economy, go to https://cber.co/.

©Copyright 2011 by CBER.

Leisure and Hospitality Leads the Recovery

The Leisure and Hospitality (L&H) Sector has played a critical role in the recovery of the national and state economies. It is important because of the number of jobs added and because it is part of the economy in every county in the state.

Nationally, seasonally adjusted employment peaked in December 2008 at 13,560,000 workers. The number of workers declined with the Great Recession and in March 2012 employment surpassed that previous peak, reaching 13,587,000. It took 50 months for the sector to go from peak-to-trough-to-peak.

There was a similar pattern for Colorado. L&H employment peaked in May 2009 at 276,000. L&H Employment declined with the recession and in January 2012 it surpassed the prior peak at 277,800. It took 44 months for the state sector to recover.

While 50 and 44 months is a long time, it is possible that the overall state economy may take close to six years before it reaches the 2006 peak.

Nationally, the time from peak to trough was 24 months, or two years. During this time 637,000 jobs were lost. The recovery period was slightly longer, 26 months.

At the state level, the time from peak-to-trough was 20 months. About 16,000 jobs were lost during this period. The recovery period was 24 months.

It is depressing to consider some of these number; however, it is even more unsettling to think that these numbers describe one of the state’s stronger sectors.

For additional information on the overall state economy go to the cber.co website.

©Copyright 2011 by CBER.

Increased DIA Passenger Traffic Supports Strength of Tourism Sector

Throughout most of the year, the Leisure and Hospitality Sector has been a leader in job creation.. Today, DIA released passenger traffic data that further supports the importance of the tourism sector in the state’s recovery.

In August 5,037,947 million travelers passed through DIA. This is a record for August and it marks the first time the airport has had back-to-back months with more than 5 million travelers.

Year-to-date data through August shows that about 30.2 million passengers have passed through airport gates in 2011. This represents a 2.8% increase, or 794,347 travelers, over the same period in 2010.

If this level of activity continues, about 53 million passengers will travel through DIA in 2011. This is clearly a sign that people from around the world have increased their travel through Denver for business and personal reasons.

©Copyright 2011 by CBER.

10 Years After 9/11 – Tourism Initially Hit Hard

Over the next six weeks this blog will look back 10 years at the change in the national and state economies. In particular, it will take a simplistic look at the possible impact that 9/11 may have had on Colorado’s Lost Decade.

There are analyses that suggest Osama bin Laden inflicted extended damage on the U.S. economy. These calculations show the direct and indirect costs of fighting two wars, tracking OBL and other al Qaeda for the past 10 years, and adopting increased security measures.

Others believe the long-term financial impact of 9/11 was minimal. These viewpoints suggest the 2001 recession was a normal part of the business cycle and the self-inflicted wounds from the financial and housing crises were far greater than the impact of 9/11.

The brief comments provided in this and subsequent blogs are not intended to prove or disprove these viewpoints. Rather, the intent is to show how different sectors of the Colorado economy reacted to 9/11, the financial crises, the housing bubble, and the 2001 and 2007 recessions.  In September this blogs will be summarized and compiled at CBER.co

We’ll begin the discussion by looking at the Leisure and Hospitality sectors.

Tourism was the industry that was initially hit the hardest by 9/11, more so in states such as Nevada than Colorado. Nevertheless, the impact in Colorado was felt immediately. In 2002 there was a drop off in DIA passengers, skier visits, and park visits. This was accompanied by an obvious decline in tourism-related employment.

Sector employment remained soft through 2004. Between 2005 and 2009 the number of leisure and hospitality workers has grown at a rate similar to total state employment. Although tourism employment was hit hard in the 2007 recession, it has since recovered at a faster rate than most other sectors.

On the other hand, employment in Colorado’s air transportation industry declined over the past decade. The sharpest part of the decline coincided with 9/11. A series of industry issues (consolidation, competition, increased productivity, pricing wars, etc.) were exacerbated by the unexpected decline in business. Despite a decline in air transportation employment, the number of passengers at DIA increased from about 39 million in 2000 to more than 51 million in 2010.

©Copyright 2011 by CBER.

Job Losses Expected in 2011 – State Demography Office

The 2010 Annual State Demography Meeting kicked off on a somber note, when staff economist David Keyser;  announced that the state’s recovery from the Great Recession will be painfully slow.

Some of the key points from Keyser’s review of the past year (2010) were:
• Job gains occurred in health care, government, and education.
• Ongoing losses in manufacturing continue to hinder the recovery because they have a high multiplier effect.
• Low wage jobs were hit harder.
• Access to credit provided a challenge for many companies.
• Small businesses saw significant setbacks.
• Rural counties that relied on oil and gas or tourism (such as the Western Slope) suffered greater losses, while agriculture-based economies were more stable.
• The loss of basic jobs, such as manufacturing, will have a long-term effect on the state because these jobs are likely to be relocated elsewhere.
• On the other hand, the loss of non-basic jobs, such as retail, food and beverage, or personal services will return in the same location.
• Colorado will remain a popular place to live and work and net migration will remain positive, but slightly below previous years.

Looking ahead, key points from Keyser’s presentation for 2011 were:
• Non-farm wage and salary employment will decline slightly and a best case scenario is that it will be flat. Wage and salary job losses should not exceed 22,000 (1%).
• Agriculture and small businesses are likely to post a slight increase, offsetting declines in wage and salary employment.
• Construction won’t come back in the immediate future.
• Health care will continue to add jobs.
• Colorado will continue to be closely tied to the US economy.
• Many of the effects of the 2007 recession could be permanent.

Keyser’s forecast for 2011 is slightly lower than what cber.co projected in late October, but the basic analysis of the current state of the economy is similar.

©Copyright 2011 by CBER.

Colorado to add 15,000 Jobs in 2011

In late October, the Bureau of Labor Statistics released its first estimate of September employment data for Colorado. Based on that report, the state is on track to lose 35,000 jobs in 2010. (Preliminary 2010 data will be released in March 2011.)

Recently, many of the nation’s top economists have revised their 2011 Real GDP forecasts downward, in the range of 1.9% to 2.6%. Output growth of 2.4% points to a miniscule job increase of 0.7%, or 15,000 jobs, for Colorado next year.

This Colorado economic forecast  was shared with state business and government leaders this past week. A summary of the responses from these individuals follows:

  • The country should be concerned about the effect the Lost Decade will have on its competitiveness.
  • The recent announcement that Q3 Real GDP was 2.0% is better than expected; however, if output growth continues at this level next year, Colorado cannot expect meaningful job growth.
  • The lack of overall growth in the economy is reflected in the real estate market.
  • Colorado typically lags the nation in entering and exiting economic downturns. Colorado’s exit from the Great Recession seems to be slower than that of the nation – despite lower unemployment.
  • For some time, I’ve been concerned about unrealistic expectations for growth in consumer demand, given the deleveraging overhang and unemployment.
  • Colorado’s major wealth creation industry – mineral extraction – continues to be hobbled by policy, yet Wyoming is projecting a healthy recovery in the months ahead- thanks to their policies regarding extractive minerals.
  • Southwest Colorado is no better than the Front Range.
  • The word that best describes the Western Slope economy is “lagging.” We’re used to growing faster than the state; recently we were losing jobs faster, although those declines have slowed.
  • There is a reasonable chance that Colorado will experience back-to-back-to-back job losses.
  • We are seeing more inquiries, which hopefully will bode well for our local economy.
  • We are seeing more inquiries, but they are not translating into sales – yet.
  • Efforts are being made to manipulate the housing and equity markets to create the illusion that the economy is better than it really is. The hope is that if consumers see their net worth rise, then they will start spending again. This makeshift effort does not eliminate the fundamental problems.

While these comments are not intended to be a representative sample of all Coloradans, they support the belief that the prospects for a solid recovery are not in the immediate future.


©Copyright 2011 by CBER.

Increased DIA Traffic Bodes Well for Economy

Amidst all of the bad economic news, there is a ray of hope from the transportation sector. Year-to-date passenger traffic at DIA, through July 2010, is stronger than last year. About 30.2 million passengers have passed through airport gates this year, or about 779,710 more than in 2009. This represents a healthy increase of 2.6%. This is a good sign because it means more people from around the world are traveling for business and personal reasons.

Typically, the DIA’s peak load occurs in July. The total number of passengers for July 2010 was 5,060,508. Despite the year-to-date increase, the monthly total for July is slightly off the pace of 5,109,342 for 2009.

The 2010 YTD passenger total is slightly below the same period for 2008. If this level of activity continues, approximately 51 million passengers will travel through DIA in 2010.

©Copyright 2011 by CBER.