Debt – Good or Bad?

Depending on your perspective…
• Debt is good if it is used to make purchases that stimulate consumption and economic growth.
• Debt can deter growth if debt service obligations prevent consumption and economic growth.

Whether or not you believe debt is good for the economy, one thing is for sure. Debt has increased!

Federal Debt
• 1966 to 2000 (34 years), $.3 trillion to $5.8 trillion; the level of debt increased by$5.3 trillion.
• 2000 to 2008 (8 years) $5.8 trillion to $9.4 trillion; the level of debt increased by $3.6 trillion.
• 2008 to July 2014 (68 months) $9.4 to $17.8 trillion; the level of debt increased by $8.4 trillion.

Public Debt has exceeded GDP since Q4 2012. The only other time that debt as a percent of GDP has been greater was during the 1940s.

Consumer Credit Outstanding
• In January 2006 Consumer Credit Outstanding was $2.37 trillion.
• In October 2014 Consumer Credit Outstanding was $3.28 trillion.

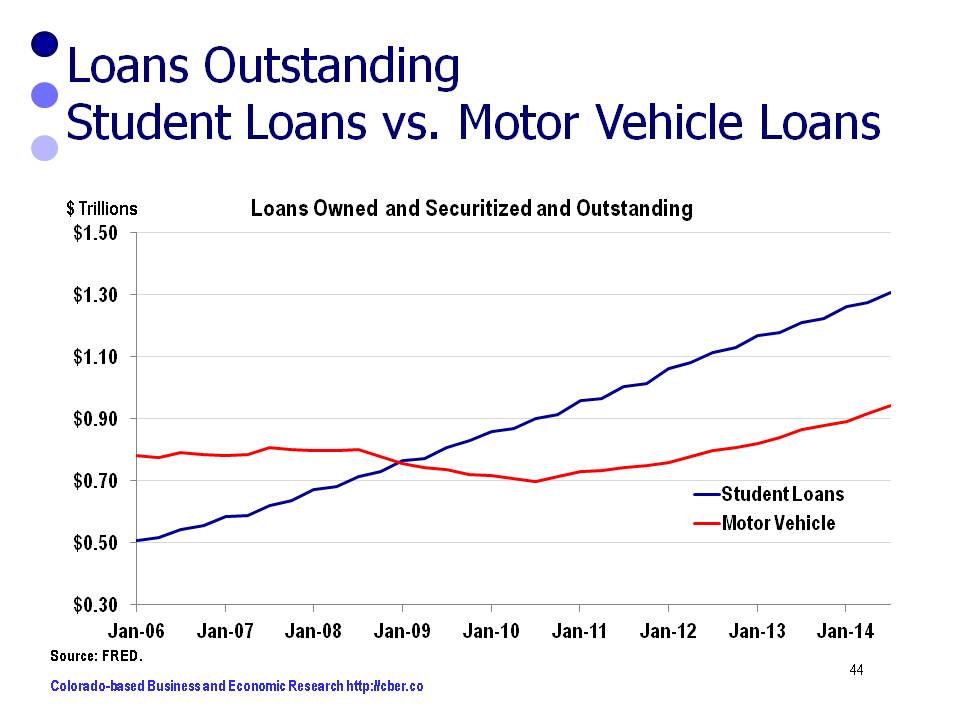
Student Loans
• In Q1 2006 Student Loans Outstanding were $500 billion.
• In Q3 2014 Student Loans Outstanding were $1.3 trillion.

Is this level of debt stimulating or preventing growth in the U.S. economy?

debt


Mining and Real Estate – Drivers of the Colorado Economy

Thank goodness for the  mining and real estate industries! From an output perspective these industries are the primary drivers of the Colorado economy.

In 2013, Colorado’s nominal GDP was $294.4 billion (most current data available). The state’s economy expanded by $157.1 billion between 1997 and 2013 (1997 is the first year that data was available). Between 2009 and 2013 the GDP expanded by $46.3 billion.

The Great Recession had a major impact on the way the economy expanded. This is evident when comparing the contribution to output for the periods 1997 to 2013 and 2009 to 2013.

Between 1997 and 2013 the contribution to GDP was broken down as follows:
• Goods Producing 20.5%
• Service Producing 68.6%
• Private sector (Goods + Services) 89.0%
• Government 11.0%

Between 1997 and 2013 the annualized rate of growth for the GDP follows:
• Total 4.9%
• Private 5.0%
• Government 4.1%

Between 2009 and 2013 the contribution to GDP was broken down as follows:
• Goods Producing 28.0%
• Service Producing 65.5%
• Private sector (Goods + Service) 93.6%
• Government 6.4%

Between 2009 and 2013 the annualized rate of growth for the GDP follows:
• Total 4.4%
• Private 4.7%
• Government 2.2%

Thank goodness for the Goods Producing Sectors (Agriculture, Mining, Construction, and Manufacturing)!

Industry 2013 GDP (millions) 2013 minus 1997 % of Total 2013 minus 2009 % of Total
All industry total $294,443 $157,072 $46,266
Private industries $258,217 $139,860 89.0% $43,287 93.6%
Goods Producing $57,447 $32,144 20.5% $12,964 28.0%
Service Producing $200,771 $107,718 68.6% $30,325 65.5%
Government $36,226 $17,212 11.0% $2,979 6.4%

The following two tables provide more detail by industry.

The following table shows more detail by industry sector. It is sorted in descending order by the column 2013 minus 1997.

Industry 2013 GDP (millions) 2013 minus 1997 % of Total 2013 minus 2009 % of Total
Real estate and rental and leasing $40,194 $21,355 13.6% $6,895 14.9%
Mining $19,848 $17,964 11.4% $8,518 18.4%
Government $36,226 $17,212 11.0% $2,979 6.4%
Professional, scientific, and technical services $26,355 $16,084 10.2% $4,233 9.1%
Information $21,578 $12,019 7.7% $1,407 3.0%
Health care and social assistance $17,438 $10,503 6.7% $2,262 4.9%
Wholesale trade $15,915 $7,818 5.0% $2,606 5.6%
Retail trade $16,105 $6,926 4.4% $1,965 4.2%
Manufacturing $21,600 $6,657 4.2% $2,171 4.7%
Finance and insurance $14,480 $6,067 3.9% $2,436 5.3%
Accommodation and food services $9,409 $5,255 3.3% $1,769 3.8%
Management of companies and enterprises $6,207 $5,106 3.3% $1,550 3.4%
Construction $11,820 $4,861 3.1% $208 0.4%
Administrative and waste management $8,653 $4,308 2.7% $1,090 2.4%
Transportation and warehousing $7,984 $4,094 2.6% $1,598 3.5%
Other services $6,549 $2,784 1.8% $605 1.3%
Agriculture, forestry, fishing, and hunting $4,179 $2,662 1.7% $2,067 4.5%
Arts, entertainment, and recreation $3,848 $2,029 1.3% $890 1.9%
Utilities $3,798 $1,782 1.1% $646 1.4%
Educational services $2,258 $1,588 1.0% $373 0.8%

The following table shows more detail by industry sector. It is sorted in descending order by the column 2013 minus 2009.

Industry 2013 GDP (millions) 2013 minus 1997 % of Total 2013 minus 2009 % of Total
Mining $19,848 $17,964 11.4% $8,518 18.4%
Real estate and rental and leasing $40,194 $21,355 13.6% $6,895 14.9%
Professional, scientific, and technical services $26,355 $16,084 10.2% $4,233 9.1%
Government $36,226 $17,212 11.0% $2,979 6.4%
Wholesale trade $15,915 $7,818 5.0% $2,606 5.6%
Finance and insurance $14,480 $6,067 3.9% $2,436 5.3%
Health care and social assistance $17,438 $10,503 6.7% $2,262 4.9%
Manufacturing $21,600 $6,657 4.2% $2,171 4.7%
Agriculture, forestry, fishing, and hunting $4,179 $2,662 1.7% $2,067 4.5%
Retail trade $16,105 $6,926 4.4% $1,965 4.2%
Accommodation and food services $9,409 $5,255 3.3% $1,769 3.8%
Transportation and warehousing $7,984 $4,094 2.6% $1,598 3.5%
Management of companies and enterprises $6,207 $5,106 3.3% $1,550 3.4%
Information $21,578 $12,019 7.7% $1,407 3.0%
Administrative and waste management $8,653 $4,308 2.7% $1,090 2.4%
Arts, entertainment, and recreation $3,848 $2,029 1.3% $890 1.9%
Utilities $3,798 $1,782 1.1% $646 1.4%
Other services $6,549 $2,784 1.8% $605 1.3%
Educational services $2,258 $1,588 1.0% $373 0.8%
Construction $11,820 $4,861 3.1% $208 0.4%


The Return of the Dow Jones Industrial Average – 26.5%

What a year it was – at least for the equities markets!

The DJIA surpassed the peak for 2007 and closed the year 2013 at 16,577.

The 2013 closing total was 26.5% above the close in 2012. It follows growth rates of:

  • 5.9% in 2012
  • 5.5% in 2011
  • 11.0% in 2010.

The great crash of 2008 seems so far away.

Looking back…the DJIA peaked at 14,163 on October 9, 2007. Between then and December 31, 2013, the market rose by 2,274 points. This is an annualized rate of change of only 2.5%, slightly better than the rate of inflation.

Suddenly 26.5% doesn’t sound so good, but thank goodness it happened!

©Copyright 2011 by CBER.

Sectors Losing Jobs Have Higher Wages

Through the first 8 months of the year there are 7 sectors of the economy that have lost a net total of 25,100 jobs, compared to the same period last year.

Construction                                     -8,800
Financial Activities                            -4,200
Federal Government                         -3,400
Information                                       -3,400
B-to-B (Not Employment Services)  -2,600
Local Government (Not K-12)         -1,600
K-12 Education                               -1,100

These sectors account for 33.3% of total employment. Average wages for this mix of workers is about $56,600 compared to average annual wages for all employees of about $47,900 (calculations based on 2010 QCEW data). In other words, the average wages for the sectors that are losing jobs is significantly greater than the overall state average, based on 2010 data.

The 2011 prognosis is that each of these sectors will show job losses for the year (2011) and that average annual wages for the group will remain well above the overall state average.

For a comprehensive review of the Colorado economy visit the CBER website.

©Copyright 2011 by CBER.

10 Years After 9/11 – Interest Rates and Equity Markets

In 2000, the national economy had been on a run that lasted about eight years. Interest rates were reasonable and the equity and housing markets were on an upward trend that seemed like it would never end.

Then 2001 and 9/11 hit!

The following comparisons show differences in key interest rates for December 2000 and December 2010:

Fed Funds Rate
Dec 2000 month-end 6.40%
Dec 2010 month-end .18%

30-year Fixed Rate Mortgage Fannie Mae
Dec 2000 month-end 7.41%
Dec 2010 month-end 4.47%

30-year FRM Fannie Mae FHA/VA
Dec 2000 month-end 7.20%
Dec 2010 month-end 5.06%

The following comparisons show differences in the equity markets for the same period.

S&P 500 Composite
Dec 2000 month-end 1,320,28
Dec 2010 month-end 1,257.64

DJIA (30 industrials)
Dec 2000 month-end 10,786.85
Dec 2010 month-end 11,577.51

Nasdaq Composite
Dec 2000 month-end 2,657.81
Dec 2010 month-end 2,631.56

Not only did the Lost Decade show a lack of gains in employment, it showed losses a lack of gains in financial
markets. (Source: FreeLunch.com)

©Copyright 2011 by CBER.

10 Years After 9/11 – Creative Financing Fizzles

In early 2003 a reporter posed the question, “Looking back, what did you miss in forecasting the 2001 recession?” In hindsight, there were two signals of greater problems.

1. Colorado construction output began to decline in 2001.
2. Employment in the Colorado Financial Activities Sector moved counter to total employment during the 2001 recession.

At that time, it was difficult to understand these trends because they were not fully developed. In the months prior to 9/11, the economy had slowed, but remained strong. Very few noticed the slowdown in construction output and those who did thought it to be nothing more than a bump in the road.

By mid-decade it became more apparent that the strength of the construction industry was waning. T-Rex was winding down and the only major activity was a smaller highway project in Colorado Springs, the Comanche Power Plant in Pueblo, and a mixture of school construction additions or improvements. In addition, housing permits, and valuation began to level off.

By 2007, housing construction began to slip and by 2008 it was clear that the industry was faced with more than a “bump in the road”. Between 2007 and 2009, 1-in-6 of the private sector jobs lost were either in construction or construction-related industries.

In hindsight, more economists and bank officials should have questioned why employees were being added in the Financial Activities Sector during a downturn. When 9/11 occurred, the economy came to a grinding halt for several days. Americans were encouraged to keep spending in hopes the country could consume its way out of the recession. At the time, that seemed to be the right thing to do.

Creative financing products (HELOCS, 0% financing, interest only loans, reverse mortgages, and others) were designed to stimulate consumption. Demand for these products increased in popularity because they allowed Americans to purchase whatever they wanted. To meet that demand, financial employment expanded between 2000 and 2007.

In 2007 a series of problems began to surface, the popularity of these products dropped off, and employment in the sector reversed trend – sharply. The industry experienced a complete melt-down – collapse of large financial institutions, the bailout of major banks by national governments, bank consolidations and closures, declines in consumer wealth, failure of top businesses, volatile equity markets, declining property values, foreclosures and evictions, and much lower interest rates.

In hindsight it is now easy to see that in 2002 there were signals that greater problems lay ahead. Given the circumstances, it is also easy to see why we looked past those warnings.

©Copyright 2011 by CBER.
1 in 6 Colorado Jobs are Construction or Construction-Related

The following is an excerpt from Colorado’s Construction Industry – Impact Beyond the Hammers and Nails  olorado’s construction and related industries employ one-in-six private-sector covered workers, yet almost 60% of the net jobs lost between 2007 and 2009 were in these sectors.

What type of economic activity is necessary to generate enough construction and construction-related activity to recoup these losses, particularly given the state of Colorado’s housing and commercial markets? (Note: this does not suggest that construction is primary or export industry or that is could or should be).

A financial analyst might suggest that the risk or volatility associated with the construction industry could be reduced if Colorado had a larger, more diverse economy. Therein lies the paradox. Because Colorado is a growth state, it is necessary to have a construction industry to support the current base of five million people and build the homes and buildings that would support a larger, more diverse economy. The Colorado State Demography Office projects continued population increases in the range of 1.5% to 2.0% for the extended future. (Population projections can be found on the State Demography Office website ).

Even with the recent reduction in state construction workers, the 2009 location quotient is 1.29, down from 1.44 in 2001. Because the industry is not considered a primary or export industry, at some point the location quotient will eventually revert to 1.0. At that time Colorado will have a concentration of construction workers comparable to most other parts of the country. Keep in mind that this correction will likely include a comparable adjustment in the related industries identified in this study.

Construction is necessary for the expansion and maintenance of the Colorado economy. It is essential that economic development, public, and private leaders understand the relationship between construction employment, its related sectors and the overall economy. That includes awareness of the volatility of the industry and the likelihood that construction employment will ultimately return to a location quotient of 1.0.

©Copyright 2011 by CBER.

Colorado Legislative Council – State Economic Update December 2010

The recovery of the Colorado economy continues to lag that of the nation, as evidenced in the December 20 release of Focus Colorado: Economic and Revenue Forecast , a quarterly publication of the Colorado Legislative Council . Many of the key economic indicators for the nation were revised upward while there were mixed results in the Colorado update.

The following discussion highlights revisions to key 2011 Colorado indicators:
• With Real GDP growth of 2.9% (U.S.),state employment will increase by 0.9%, slightly less than the September projection. This equates to 19,900 jobs.
• The most notable change is an increase in the 2011 unemployment rate. It was revised upward from 7.6% to 8.4% (Many economists in the state expect this rate to exceed 9.0% and possibly push past the national rate at some point this year).
• With more people on the payrolls, personal income is expected to post a modest increase of 3.1%.
• On the other hand Wage and Salary income will record a meager increase of 1.4%.
• Despite the increase in wages and personal income, projections for retail sales growth was revised downward from 3.1% to 2.5% (It should be noted that this rate of growth does not reflect changes associated with the tax reduction plan passed by Congress).
• On a positive note, the number of home permits was bumped up from 11,200 to 17,200. Continued subpar construction growth is projected beyond 2011 despite population increases in the range of 90,000 to 100,000 people per year.
• Finally, the projection for CPI growth remained at 1.9% for 2011; however, it is expected to ramp up by at least a point in 2012.

Positive factors not mentioned above include:
• Permitting in the oil and gas industry turned upward at the end of 2009 and have continued in that direction.
• While there is optimism within the industry about Colorado’s housing market, it is not yet reflected in the data. If it is any consolation, home prices are faring better in Denver than many other parts of the country.
• Foreclosures remain high, but they are on a downward path.

On the other side of the equation:
• Colorado’s financial sector is plagued with troubled mortgages.
• To illustrate that point, 27% of Colorado insured banks were not profitable at the end of September 2010. This compares to 20% nationwide.
• The state’s lending institutions have high exposure to troubled commercial real estate than other banks in most other states.

While there is good news in the most recent update, it should not be forgotten that the Lost Decade concluded with state employment at a level below the peak in 2001. Despite employment gains this year, it is likely that June 2001 peak employment will be reached again in 2012.


©Copyright 2011 by CBER.