Blog

Colorado Economic Forecasts Point to Growth in 2015

It is the forecast season and three Colorado economic forecasts are on the streets.

First, the Governor’s Office of State Budgeting and Planning and the Colorado Legislative Council released their2015 Colorado economic forecasts.

Their forecasts are used for policy and budgetary purposes and at times tend to err on the conservative side. (That comment is intended to serve as a reference point, and is not meant as a criticism). The March forecast is often a more accurate reflection of what will happen during the year.

The good news is that both groups are realistically optimistic about the state’s outlook.

OSPB projects U.S. Real GDP growth of 2.7% with state job growth of 68,300. CLC is slightly more optimistic. They project U.S. Real GDP growth of 3.1% and state job growth of 73,600.

The quarterly reports produced by OSPB and CLC are recommended reading for anyone interested in the state economy. They discuss the economy for all regions of the state, key industries, and factors that impact the budget for the state government.

Finally, Richard Wobbekind recently unveiled the CU Leeds School Colorado economic forecast earlier in the month.  As usual it was a rewrite of the past four years. He expects the U.S. to see significantly stronger U.S. output growth. At the same time he focuses on Colorado being one of the leading states for job growth, yet he states that Colorado will add jobs at a decreasing rate in 2015 after modest growth in 2014. CU is projecting Real GDP growth of 3.1% and state job growth of 61,300 in 2015. Those numbers just don’t make sense.

Between now and next year, Wobbekind and the CU gang should read the paper “Macroeconomic forecasts and microeconomic forecasters”. Author Owen Lamont raises the question, “Does an experienced research team, with a wealth of knowledge, produce a more accurate forecast or does the added knowledge result in an “arrogance” which may reduce the accuracy of the forecast? The state would benefit from CU producing a Colorado economic forecast based on academic rigor rather than self-promotion.

The good news is that this part of the forecast season has passed and all projections point to continued modest growth in 2015. Bring on the new year!
 

Colorado Jobs and Economy Remain Strong

On December 20th the BLS will provide their final 2014 Colorado jobs report.

Given the strength of the U.S. job growth reported earlier this month (321,000 jobs added), it is reasonable to think there will be solid job growth for November. While the economy has had its ups and downs, job growth remains solid, and is trending upwards.

The upcoming press release is somewhat irrelevant because the BLS will release the 2014 benchmark revisions in early March of 2015. That data is expected to show that the number of Colorado jobs increased by about 73,000, or 3.1%, during 2014.

The BLS began producing state employment data in 1939. The Job growth of 73,000 jobs in 2014 will be the tenth best year in terms of absolute job growth (the number of jobs added). On the other hand, 2014 will be the 38th best year in terms of relative job growth (percentage of job growth).

This year marks the only time that Colorado jobs have increased at an accelerating rate for four consecutive years. Between 2011 and 2014, Colorado has added about 231,000 workers (36,300 jobs in 2011; 54,400 jobs in 2012; 68,100 jobs in 2013; and 73,000 jobs in 2014.)

Looking ahead to 2015:
• The price of oil has declined precipitously because supply exceeds demand. As a result the price for a gallon of gasoline has dropped well below $3.00 per gallon. To date, the short-term impact of lower gas prices has been minimal. If prices remain low, Colorado’s frequent fuelers will realize savings of about $500 to $600 next in 2015. Because wage growth has been weak over the past four years, most people will not use the savings for discretionary purposes. Rather they will pay for rent, food, medical costs, and other necessary expenses that have risen at a rate faster than their wages.
• In the short-term (first half of 2015) lower oil prices may not have a significant impact on production and the number of workers in Colorado’s extractive industries. If prices are suppressed for an extended period, then production will fall. Initially, contractors and engineers will be laid off and production workers will be furloughed. Eventually smaller companies and suppliers will be impacted. The extractive industries have a comparatively small direct workforce; however, they indirectly touch many industries. They have a much bigger role in the Colorado economy than most people realize.
• A slowdown in the economies of China, Russia, and parts of the European Union may impact Colorado companies that export products and services globally.
• Wage growth has been extremely weak, particularly given the decline in the rate of unemployment this year. Although the unemployment rate is below 4.5% (the natural rate of unemployment), upward wage pressure has been felt in only a few industries, such as construction and finance.
• Retail sales have remained solid because of increased employment and in-migration. Stronger wage growth is needed to support significant growth in retail sales.
• The downward trend in the unemployment rate is a mixed blessing. It is great that more people have jobs, but labor shortages will occur  in more industries during 2015 as the supply of trained workers is reduced.
• Health care costs will continue to be an issue in 2015. Participants in the Connect for Health Colorado program will not see minimal increases in their 2015 premiums. Unfortunately, the subsidies were reduced, which will cause costs for insurance to increase significantly for many families.
• Colorado’s housing prices continue to rise, which is good news for existing home owners. It is not such good news for renters and people moving to the state.

Despite these headwinds, there are plenty of reasons to be optimistic about the growth in the number of Colorado jobs and the overall economy in 2015.

Lower Crude Prices Are Here For Awhile

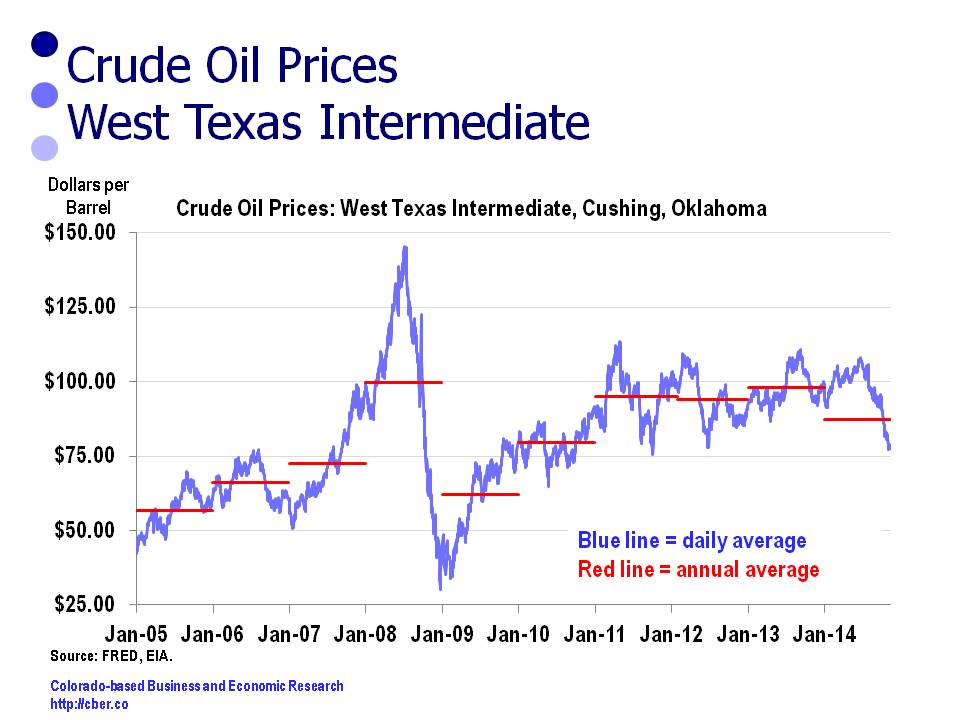
Since 2005, average annual prices for crude oil have ranged from $56 to $100 per barrel (red lines in the chart below). Daily fluctuations are clearly much more volatile (blue lines in chart below), $30 to $146.

Lower crude prices will mean a barrel of oil will be in the  range of $40 to $60 per barrel through mid-2015 as supply continues to exceed the demand.

In the near-term, lower crude  prices will have a minimal impact on producers in Colorado. If lower prices continue through the middle of next year, contract workers and small companies will be the first to “feel the pain.” A reduction in production could have a ripple effect on other industries that begins with the construction, retail, and finance industries.

Consumers will experience a small benefit because of lower prices for fuel costs; however, the oil production companies will experience lower profit margins and the state will collect less revenue from severance taxes. Overall, the net economic effect of lower crude prices on the state will likely be negative.

lower crude prices


Lower Gasoline Prices Have Minimal Impact

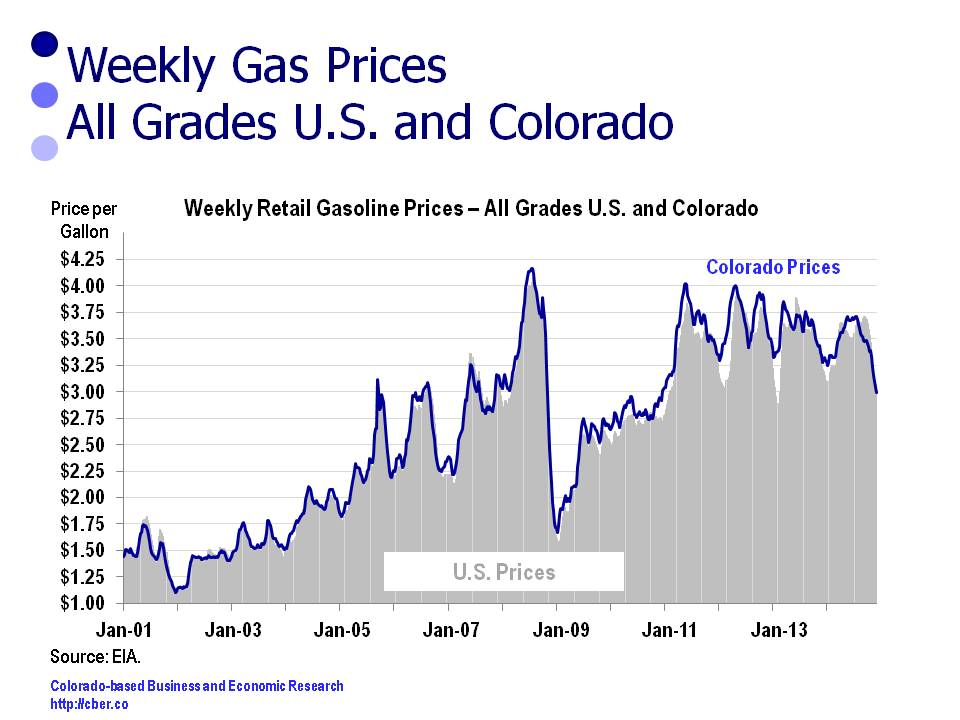
Since the second quarter of 2012, the price of gasoline has slowly declined in the U.S. and Colorado.

At this point, the impact in total gasoline prices for the year is primarily psychological even though prices have dropped below $3.00 per gallon in some locations. The difference in total prices paid for 2014 compared to last year are negligible.

The Good News – At some point lower gas prices may increase discretionary income for consumers. At the moment that is not likely because inflation has driven other costs higher, especially housing costs.

The Not So Good News – Typically, the impact of lower oil and gasoline prices on the state is negative. In other words, consumers will benefit; however, state coffers will not be as full because tax collections will be lower.
gasoline prices


Healthcare, Extractive Industries, and Wages

Looking ahead to 2015 there are three issues that will impact the economy in 2015: healthcare, extractive industries, and wages.

Healthcare
The healthcare industry may play an important role in the economy in 2015.
• First, there are shortages of workers in many key positions. This may affect the care consumers receive from their service providers and it may increase the costs of doing business.
• Second, providers are being pushed by Obamacare and insurance companies to reduce the fees they charge. In turn, this may reduce their margins.
• Third, it was recently announced that Colorado employers will face an 8% increase in the cost of insurance. Likely, a portion of that increase will be passed on to workers. That could reduce that amount of discretionary income, which in turn could reduce retail consumption.
• In addition, it has been announced that Connect for Health Colorado, will reduce subsidies. In other words, many Coloradans will have to pay significantly more for coverage, go without healthcare, or pay a fine to the government. Coloradans will face sticker shock when they get their health insurance bills in 2015.

Extractive Industries and Prices of Oil and Gasoline
The extractive industries will continue to face challenges in 2015. Fracking is still an issue in Colorado that will not go away. Local governments are pushing to have greater control over the way the extractive industries operate in their jurisdiction.

In addition, the price of oil has trended downward for the past six months. If these trends continue, it may impact production in Colorado, which will hit the smaller companies first. It will also impact severance taxes paid to the state government.

At the same time consumers have enjoyed lower prices at the pump. Their gasoline bills for 2013 and 2014 will be similar. If lower prices continue into 2015, consumers may notice a reduction in their annual gasoline bill in the range of $400 to $800 for the year.

If prices at the pump continue to decline Colorado consumers will be the benefactors, but state coffers suffer. Typically the negative impact for the state outweighs the positive impact on the consumer.

Wages
Typically, when unemployment dips below the natural rate of employment, 4.5% to 5.0%, there is usually upward pressure on wages. Overall that has not been the case in Colorado.

Between 2007 and 2014
• The Denver Boulder Greeley CPI  (DBG) increased at an annualized rate of 2.4%
• The Private Sector Average Weekly Wages (AWW) increased by an annualized rate of 1.7%.
Inflation for this period grew at a faster rate than private wages for this period.

Between 2013 and 2014
•  The DBG CPI is projected to increase by 2.8%/
• The Private Sector AWW will increase by 2.0%.

The Construction and Financial Activities are isolated sectors that have seen strong wage growth in the last couple of years because the demand for qualified employees has exceeded the supply of workers.

Construction Wages
• Between 2008 and 2012 AWW declined. In 2013 it increased by 11.0% followed by an increase of 11% in 2014. Construction businesses have found that it has been necessary to raise wages this amount to attract workers. Ultimately these labor costs will be passed on to consumers.
Financial Activities
• The financial activities sector has also had strong wage growth, 5.0% annualized growth, from 2007 to 2014. Between 2007 and 2010 Average Weekly Wages decreased, but they have increased significantly since.  AWW will increase by 7.3% in 2014

On the other hand, 2014 inflation growth will exceed the change in wages for Manufacturing, Tourism, and Professional and Business Services. These three industries are critical to the state economy for different reasons.

Watch for healthcare, extractive industries, and wages to impact the Colorado Economy in 2015 – and the impact may not always be positive.


Colorado’s Employment Situation After Ten Months

After ten months, enough of the year has passed that Colorado’s employment situation for 2014 is virtually set. This post looks at overall and regional job growth, drivers of the regional economies, and industries that dominate state job growth.

Job Growth (Overall)
After BLS makes their March 2015 revisions the wage and salary employment will show that Colorado added at least 70,000 jobs this year. That is job growth of at least 2.9%.

Job Growth (Regional)
About 81% of Colorado’s job growth occurs in Colorado’s seven metro areas (listed below). The industry composition and the economies in these seven metro areas are distinct. As a result they have grown at different rates.

The estimated rates of job growth through ten months are:
• Greeley 5.0%
• Boulder 3.1%
• Fort Collins 2.8%
• Denver 2.8%
• Pueblo 1.8%
• Grand Junction 0.9%
• Colorado Springs 0.8%

During this period the percentage of job growth in the MSAs was:
• Denver added 67.4% of the MSA jobs.
• Boulder added 10.0%.
• Combined, the Northern Colorado MSAs added 16.0% of all jobs (Greeley 8.5% and Fort Collins 7.5%).
• Colorado Springs added 3.6% of the MSA jobs.
• Pueblo added 2.1%.
• Grand Junction added almost 1%.

Drivers of Regional Economies
The economies of Colorado’s seven metro areas are very distinct as evidenced by the industries driving their economy.
• Greeley has been driven by the extractive industries and Vestas.
• Fort Collins has been driven by the high-tech industry, CSU, and spillover from the extractive industries.
• Boulder has posted gains as a result of the high-tech industry, and CU employment.
• Denver’s economy is more balanced than the smaller economies. Interestingly enough, it has grown at a slower rate in 2014 than 2013.
• Pueblo has benefitted from Vestas.
• Grand Junction has struggled to recover from the most recent “oil shale bust”.
• Colorado Springs is still feeling the pain from the exit of Intel. In addition, the wildfires during the summers of 2012 and 2013 played havoc with the economy. The local economy is very dependent on the military and defense funding for local businesses. These industries are typically more volatile than the overall economy.

Industries Dominating State Job Growth
• Throughout 2014, job growth across the state has been led by the following  sectors
o Accommodations and Food Services (AFS)
o Health Care
o Professional, Scientific, and Technical Services (PST)
o Construction
o Retail
These five sectors account for about 71% of total job growth in the state.

Colorado’s Diversity of Job Growth

cber.co tracks changes in employment for 23 sectors of the Colorado economy. Part of that tracking includes a two-step process for measuring Colorado’s diversity of job growth.

The first step is to identify the number of sectors that are adding jobs. For the last three years the data shows:
• In 2012 19 sectors added jobs
• In 2013 19 sectors added jobs
• In 2014 18 sectors will add jobs (estimate).

As a point of reference, a comparison can be made to the following years:
• In 1993 22 sectors added jobs
• In 1998 22 sectors added jobs
• In 2002 13 sectors added jobs
• in 2003 10 sectors added jobs
• in 2009 8 sectors added jobs
• In 2010 10 sectors added jobs.
This shows that during the best of times, some sectors lose jobs. As well, it illustrates that during the worst of times, there are sectors adding jobs.

Another way to look at the data is to calculate the percent of employment in sectors where jobs are being added. For the last three years the data shows:
• In 2012 the sectors that added jobs had 88.5% of total employment.
• In 2013 the sectors that added jobs had 89.2% of total employment.
• In 2014 the sectors that added jobs had 85.4% of total employment (estimate).
The 2014 percentage might increase when the BLS revises 2014 data in March 2015.

As a point of reference, a comparison can be made to the following years:
• In 1993 the sectors that added jobs had 99.1% of total employment.
• In 1998 the sectors that added jobs had 99.6% of total employment.
• In 2002 the sectors that added jobs had 49.4% of total employment.
• In 2003 the sectors that added jobs had 36.7% of total employment.
• In 2009 the sectors that added jobs had 27.3% of total employment.
• In 2010 the sectors that added jobs had 33.2% of total employment.

The data shows that since 2012 Colorado’s job growth has been diverse and solid.

diversity of job growth


Measures of the Colorado Unemployment Rate

The Bureau of Labor Statistics compiles several measures of the Colorado unemployment rate. Each measure and its descriptions are listed below.  In each case, the  percentage has declined over the past year. The U-3 number is the headline number; however, many people think U-6 is more representative of the state of the economy because its definition is more inclusive.

Measures  of the Colorado Unemployment Rate Sept. 2013 Sept. 2014
U-1 Persons unemployed 15 weeks or longer, as a percent of the civilian labor force. 3.80%  2.80%
U-2 Job losers and persons who completed temporary jobs, as a percent of the civilian labor force. 3.70% 2.90%
U-3 Total unemployed, as a percent of the civilian labor force (headline unemployment rate). 7.20% 5.90%
U-4 Total unemployed plus discouraged workers, as a percent of the civilian labor force plus discouraged workers. 7.70% 6.40%
U-5 Total unemployed, plus discouraged workers, plus all other persons marginally attached to the labor force, as a percent of the civilian labor force plus all persons marginally attached to the labor force. 8.60% 7.30%
U-6 Total unemployed, plus all persons marginally attached to the labor force, plus total employed part-time for economic reasons, as a percent of the civilian labor force plus all persons marginally attached to the labor force. 13.60% 11.80%


Boulder is #1 – Most Highly Educated and Greatest Number of Toilets

Rankings are fun… Whether it is being recognized as a party school,  highly educated, or fit, Boulder is #1. Recently, Boulder also laid claim to another title. Boulder is #1 for having the greatest number of toilets per capita.number one

To digress briefly…

Some economists and data geeks are obsessed with producing rankings. If you give them a data series, they will open their Excel spreadsheet, plug the data in, and sort it. In no time they will produce a new set of rankings.

Rankings have high entertainment value. They can be used for bragging rights and they can be used for creating taglines to promote a variety of causes, both good and bad. Some Coloradans use the tagline, “Colorado ranks ahead of only Mississippi in funding for education,” to solicit support for the increased funding. The tagline tugs at heartstrings or parents with young children, but it does not clearly represent reality.

Rankings are also useful for creating a feel-good/put-down statement. Consider the bumper sticker that states, “My dog is smarter than your honor student and my cat is smarter than my dog.” My cat is ranked #1, my dog is ranked #2, and your honor student is at the bottom of the pile. I can feel good about my cat and you should feel bad about your honor student. Take that!

Rankings of economic data have value if they are used for comparative or analytical purposes such as showing the strengths or weaknesses of a region as a means of addressing a challenge or opportunity. For example, if Colorado has a high concentration of companies that conduct research in lasers, a discussion about the competencies of these companies can be used to attract and retain photonics, aerospace, and bioscience companies in Colorado.

Back to the issue in the first paragraph…Boulder is #1!

Recently, Redfin.com, a real estate company, produced a report entitled “Tons of Toilets: Which City Sits atop the Throne?” Like many rankings, this one had high entertainment value.

At the top of the list is Boulder with 305,200 toilets or 1.02 toilets per person. Approximately 5.3 million gallons of water are flushed daily.

Second on the list is Washington, D.C. with almost 5.5 million toilets or .98 toilets per person. Approximately 95.6 million gallons of water are flushed daily.

Denver is ranked 6th on the list with almost 2.4 million toilets or .94 toilets per person. About 41.8 million gallons of water are flushed daily.

Shortly after the rankings were released my inbox filled up with e-mails from peers. They were quick to point out the correlation between the rankings of the education levels of these cities to their toilets per capita rankings. Don’t worry, their comments are not appropriate for this document and have been flushed down the toilet.

Like most other rankings, the listing of the race to the top of the throne was used to promote a cause. In this case, the rankings were intended to draw potential customers to the Redfin website – and it worked. I was quickly reminded that I cannot afford to live in Boulder.

This ranking was fun and it was harmless, but it provides a lesson. It is important to be vigilant when reading and using rankings. More often than not, they have limited value unless they are used with other data to make a valid and constructive point.


Establishment Growth Tops in Broomfield, Denver, and Douglas County

Since the end of the recession establishment growth occurred fastest in the following counties: Broomfield, Denver, and Douglas.

The Quarterly Census of Employment and Wages (QCEW) data provides trends for the creation of establishments by county. To be included in the QCEW database, establishments must have at least one employee.

Between 2002 and 2013 the number of Colorado establishments increased at an annualized rate of 1.0%. Between 2009 and 2013 the number of Colorado establishments changed at an annualized rate of -0.1%.

Year Establishments
2002 153,830
2003 156,986
2004 160,104
2005 166,540
2006 171,682
2007 175,442
2008 175,410
2009 171,729
2010 168,176
2011 166,537
2012 168,824
2013 171,249

For the period 2002 to 2013, the number of establishments in Broomfield, Douglas, and Weld County grew at the fastest rate, while the number of establishments in Arapahoe, Jefferson, and Pueblo changed at the lowest rates.

Year County
County/State 2002 vs. 2013
Broomfield 5.1%
Douglas 4.2%
Weld 2.0%
Larimer 1.4%
Boulder 1.2%
El Paso 1.1%
COLORADO 1.0%
Denver 1.0%
Adams 0.7%
Arapahoe 0.4%
Jefferson 0.2%
Pueblo -0.5%

For the period 2009 to 2013, the number of establishments in Broomfield, Denver, and Douglas County grew at the fastest rate, while the number of establishments in El Paso, Jefferson, and Pueblo changed at the lowest rates.

County/State 2009 vs. 2013
Broomfield 2.5%
Denver 1.5%
Douglas 1.4%
Boulder 0.9%
Larimer 0.3%
Arapahoe 0.1%
Weld 0.1%
COLORADO -0.1%
Adams -0.2%
El Paso -0.2%
Jefferson -0.5%
Pueblo -1.9%

It is interesting to note that Boulder County, often regarded as the hotbed of entrepreneurship, was not at the top of the list for the percentage of establishments added.