Blog

Colorado Job Growth Will Exceed Projections

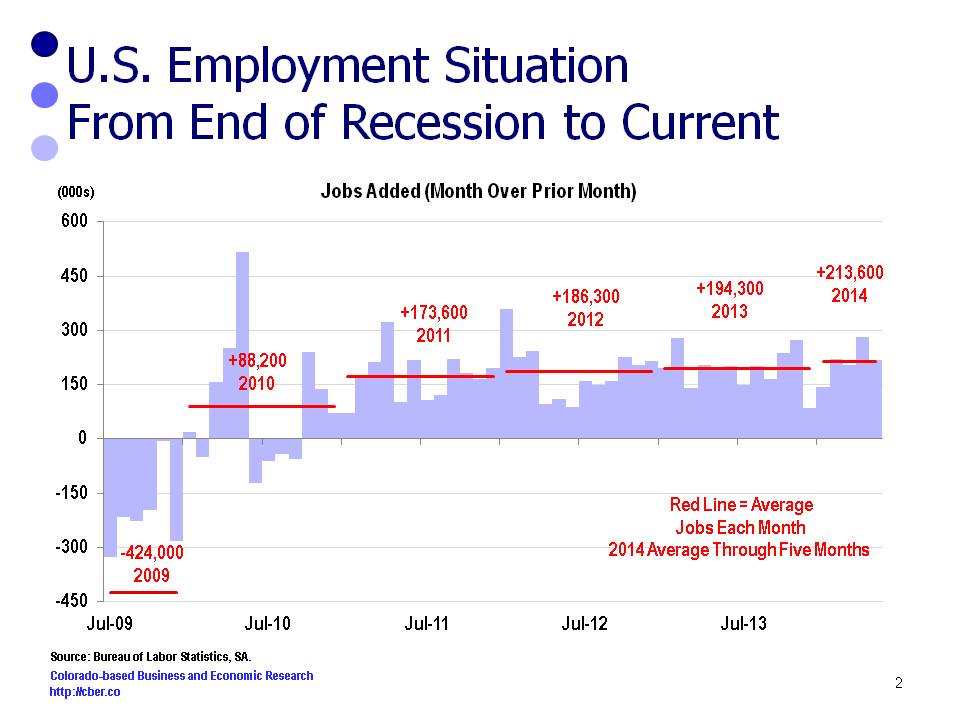
In January, cber.co released its economic forecast for Colorado. U.S. employment was projected to increase by 2.3 million jobs in 2014 and the state would add 68,000 to 74,000 jobs. The cber.co forecast is more aggressive than all other state forecasts.

After five months, it appears that U.S. and Colorado job growth will exceed cber.co projections. Through five months, U.S. jobs are being added at an average rate of 213,600 per month (or more than 2.5 million jobs per year) and the state is projected to add 67,100 jobs this year.

To digress for a moment…The most recent QCEW data published by BLS suggests the wage and salary data for Colorado will be higher than the current 2014 estimates. These projections are expected to be bumped upwards by as much as 10,000 in the March 2015 revisions.

In other words, the current wage and salary job growth estimates are not fully capturing the magnitude of job growth in Colorado.

There is a downside to the rapid rate of growth. In 2013, the Consumer Price Index for Colorado rose by 2.8% versus 1.5% for the U.S. Major contributors to the higher rate for Colorado was higher rental and home prices, significant increases in heating utilities, and higher medical costs. Higher housing prices are a function of Colorado’s strong housing market and decreased inventories, while increased utility costs may be related to state energy policy.

After a rugged start to the year at the national level (-2.6% Real GDP Growth in Q1), the nation will see solid growth in the economy for the remainder of the year. What is good for the U.S. is also good for Colorado. All indications are that the state will likely record accelerating job growth for the fourth consecutive year.


Colorado Inflation for 2013 About Double the U.S. Rate

Earlier today, the BLS released its CPI data for 2013. The data shows that Denver-Boulder-Greeley rate of inflation, 2.8%, was about double the rate for the U.S., 1.5%. (The Denver-Boulder-Greeley CPI is used as a proxy for Colorado inflation).

The inflation rate for three of the eight categories was well above the state average (2.8%). These categories were: apparel (6.5%), housing (4.8%), and medical care (3.6%). In addition, the rates for these categories were also significantly greater than the U.S. rate.

The housing category (4.8%) includes three subcategories:
• Inflation for the shelter category increased 4.5% in Colorado, compared to 2.3% for the U.S.
• Colorado fuels and utilities increased 9.3%, compared to 2.8% for the U.S. Within that category Colorado household energy rose by 11.2%, compared to 2.4% for the U.S.
• Colorado household furnishings rose by 0.9% compared to -0.8% for the U.S.
Colorado’s higher rate of inflation in the housing category is a reflection of stronger growth in the state economy and the residential real estate market than the U.S. The magnitude of the state’s increase in fuel and utilities may be a reflection of its commitment to alternative energy sources.

Finally, Colorado’s rate of inflation was somewhat higher in the other services category. The rise in prices for food and beverage was the only category that was significantly higher in the U.S. than Colorado. The remaining three categories (education and communications, recreation, and transportation) had similar growth rates for inflation.

Category Denver-Boulder-Greeley U.S.
Apparel  6.5% 0.9%
Housing 4.8% 2.1%
Medical care 3.6% 2.5%
Other goods and services 2.3% 1.7%
Education and communication 1.4% 1.5%
Food and beverages 0.6% 1.4%
Recreation 0.5% 0.5%
Transportation -0.2% 0.0%


Colorado Outperforms U.S. in Real GDP Growth

Today the Bureau of Economic Analysis released its updated real GDP data by state for 2013. There were increases in 49 of the 50 states, with Alaska being the one state showing a decline.

In 2013 U.S. Real GDP growth expanded at a rate of 1.8%, compared to 2.5% in 2012. Private sector growth grew by 2.3% in 2013 compared to 3.0% in 2012.

In short, Colorado outperformed the U.S. in output growth last year. While the rate for the U.S. declined, real GDP growth for Colorado increased.

Nationally, the top six contributors to absolute growth were:

• Real estate and rental and leasing
• Agriculture, forestry, fishing, and hunting
• Health care and social assistance
• Finance and insurance
• Wholesale trade
• Professional, scientific, and technical services.

Combined, these 6 categories accounted for 53.6% of the change in U.S. output in 2013.

The Colorado Real GDP growth increased from 3.0% in 2012 to 3.8% in 2013. Real private sector growth expanded at a rate of 4.2% in 2013 compared to 3.4% in 2012.

In Colorado the leading contributors to absolute growth were:
• Mining
• Real estate and rental and leasing
• Professional, scientific, and technical services
• Agriculture, forestry, fishing, and hunting
• Construction
• Government.

Combined these six sectors accounted for 75% of the change in Colorado output in 2013.

There is a significant difference between the composition of the top contributors for the U.S. and Colorado. In part this helps explain why the Colorado economy has outperformed the U.S. economy over the past five years.

Note: There is a slight difference between the national GDP and the national GDP calculated as a summary by state outputs. Details are explained on the BEA website. Also, for methodological reasons, the contributions to absolute growth were calculated using the nominal GDP data.

U.S. Employment Posts Strong Growth Through Five Months

On June 6th the Bureau of Labor Statistics reported that U.S. employment increased by 217,000 in May. The sectors adding the highest number of jobs were:
• Professional and business services.
• Health care and social assistance.
• Food services and drinking places.
• Transportation and warehousing.

For the past 12 months, U.S. employment has averaged 197,000 jobs per month. After a weak January, an average of 213,600 jobs has been added in the first five months of 2014. This is well above the average of 194,600 for 2013.

The May unemployment rate was 6.3%, down from 7.5% a year ago. The number of unemployed was 9.8 million. This is 1.9 million lower than a year ago.

After a weak second half in 2013, there is strong growth in U.S. employment through the first five months of 2014.


U.S. employment shows strong growth in 2014
U.S. employment shows strong growth in 2014.

Colorado’s Manufacturing Output Similar to Arizona, Kansas, and Utah

Manufacturing is important to the Colorado economy because it is a primary job creator – it brings in investment from outside the state, it creates jobs with higher than average wages, and the industry often has a deeper local supply chain than other industries. In 2012, the most current data available, Colorado manufacturing output totaled $19.99 billion and was 8.4% of private sector output (BEA).

Colorado is proud to have manufacturing competencies in some high-tech areas and food and beverage and state economic development officials have focused their support on the select sectors where they have strength or potential strength.

In 2012, Colorado was ranked 29th for total manufacturing output. States with similar levels of output include Arizona, Kansas, Utah, Maryland, and Oklahoma.


State Output (millions) Percent Cumulative Percent
California $213,257 11.4% 11.4%
Texas $210,968 11.3% 22.7%
Illinois $92,383 4.9% 27.7%
North Carolina $88,252 4.7% 32.4%
Ohio $87,174 4.7% 37.1%
Indiana $84,150 4.5% 41.6%
Pennsylvania $70,634 3.8% 45.4%
Michigan $66,230 3.5% 48.9%
New York $63,088 3.4% 52.3%
Oregon $55,158 3.0% 55.2%
Louisiana $55,097 3.0% 58.2%
Wisconsin $49,981 2.7% 60.9%
Georgia $48,599 2.6% 63.5%
Washington $46,507 2.5% 66.0%
Massachusetts $41,629 2.2% 68.2%
Tennessee $41,411 2.2% 70.4%
Minnesota $40,441 2.2% 72.6%
Virginia $40,116 2.1% 74.7%
New Jersey $38,199 2.0% 76.8%
Florida $37,023 2.0% 78.8%
Missouri $32,275 1.7% 80.5%
Alabama $30,001 1.6% 82.1%
Kentucky $29,746 1.6% 83.7%
South Carolina $28,708 1.5% 85.2%
Iowa $25,406 1.4% 86.6%
Connecticut $24,079 1.3% 87.9%
Arizona $21,934 1.2% 89.1%
Kansas $20,503 1.1% 90.2%
Colorado $19,992 1.1% 91.2%
Utah $19,184 1.0% 92.3%
Maryland $18,657 1.0% 93.3%
Oklahoma $17,497 0.9% 94.2%
Arkansas $15,604 0.8% 95.0%
Mississippi $15,254 0.8% 95.8%
Nebraska $12,484 0.7% 96.5%
New Hampshire $7,657 0.4% 96.9%
Idaho $7,556 0.4% 97.3%
West Virginia $6,223 0.3% 97.7%
New Mexico $5,805 0.3% 98.0%
Nevada $5,504 0.3% 98.3%
Maine $5,497 0.3% 98.6%
Delaware $4,393 0.2% 98.8%
South Dakota $4,008 0.2% 99.0%
Rhode Island $3,919 0.2% 99.2%
Vermont $3,150 0.2% 99.4%
North Dakota $3,037 0.2% 99.6%
Montana $2,860 0.2% 99.7%
Wyoming $2,269 0.1% 99.8%
Alaska $1,671 0.1% 99.9%
Hawaii $1,274 0.1% 100.0%
District of Columbia $256 0.0% 100.0%
Total $1,866,700 100.0%

JOLTS Data Points to Solid Job Growth in the U.S.

The most recent JOLTS data points to solid job growth in the U.S. economy.

For those unfamiliarwith JOLTS… The Bureau of Labor Statistics produces the Job Openings and Labor Turnover Survey (JOLTS) that reports the fluctuations of hires and separations during the business cycle of the U.S. economy. The difference is the change in U.S. employment.

The net change between hires (green) and separations (red) turned negative in January 2008 and remained that way for 28 of the next 33 months. Since October 2010, the difference between hires and separations has been positive every month.

The net change has fluctuated between 162,000 and 210,000 for the past two years.

Beginning in December 2007 the number of hires began a freefall that continued for 18 months (June 2009). Ironically, the number of separations began declining at the same time. They declined until May 2010. The reason there was such a severe downturn was that hiring decreased at a faster rate than separations.

The number of hires began increasing in June 2009 and has continued since then.

The number of separations was relatively flat from mid-2010 through April 2012 (almost two years). Separations have since increased along with the number of decreases. This “churn” is normal as workers transition between companies for better jobs.

The current hire and separation patterns are consistent with solid job growth, although the levels of hiring are well below the hiring associated with the recovery from the 2001 recession.

JOLTS data points to solid job growth in U.S.


The Decline in Colorado’s Unemployment Rate – Good and Bad News

The Bureau of Labor Statistics released their latest job numbers for Colorado earlier today and there were no surprises. Growth continues to be solid and the unemployment rate is trending downward.

It is great to see the overall rate of unemployment drop; however, there is a downside. Barring a recession, the rate is likely to continue to drop to the 4.0% range over the next couple of years and remain at that level for an extended period of time. We have very quickly shifted from an employer’s market to a job seekers market.

The rate of unemployment for some occupations is now below 3.0%, for example, the management and professional occupations. It is good news that business is strong; however, it is bad news because it is not possible to find enough qualified workers to produce goods or provide services.

Since all industries require managers, the shortage of people to fill management occupations crosses all industries. The shortage in some professional occupations is in Colorado’s high-tech sector. It is good news there is growth, but bad if it hurts the local economy.

Nationally, the food preparation industry is another example where there is a substantial decrease in the unemployment rate. Over the past year the rate has dropped from 8.8% to 7.1%. This means it will be more difficult for many of the state’s restaurants to find an adequate number of workers.

As the construction industry has improved, the unemployment rate in the construction and extraction occupations have fallen from 14.3% to 9.8%.

While that is good news, it is estimated that 700,000 construction workers have left the industry. In other words, there is a shortage of trained workers.

The good news that is associated with the declining unemployment rates means there will be greater competition between industries for workers.

Eventually this will result in increased wages. That is good for the workers, but may cause the price of goods and services to increase.

Such is the case in economics, it seems that every story has an upside and a downside.

Colorado is on track to add 71,000 jobs in 2014.

Colorado in Bottom Third of States for Output Manufacturing Location Quotient

Manufacturing is critical to the state of Colorado; however, the state’s manufacturing output lags other states.

One way to evaluate the Bureau of Economic Analysis state output data is to compare the industry specialization index or the location quotient (LQ) to show which states have a higher concentration of manufacturing relative to the other industries. A LQ > 100.0 means there is a higher concentration and a L.0  < 100.0 means there is a lower concentration.

In the first group of states (17 states) the manufacturing sector has a LQ is greater than 118.0. In other words, manufacturing is a significant export industry for these states.

Rank State LQ
1 Indiana 234.98
2 Oregon 231.48
3 Louisiana 188.87
4 North Carolina 161.40
5 Wisconsin 159.35
6 Kentucky 142.99
7 Ohio 142.70
8 Iowa 138.98
9 Michigan 137.90
10 Alabama 136.30
11 South Carolina 135.85
12 Texas 125.90
13 Mississippi 125.33
14 Tennessee 124.65
15 Kansas 123.04
16 Utah 122.60
17 Arkansas 118.77

In the second group of states (15 states) the LQ is greater than 85.0 and less than 115.0. In these states manufacturing is an important industry. Because Minnesota, Illinois, and Idaho have LQs greater than 110.0 it is likely that manufacturing is a significant export industry.

Rank State LQ
18 Minnesota 114.42
19 Illinois 110.81
20 Idaho 108.18
21 Nebraska 104.57
22 Missouri 103.98
23 Washington 103.22
24 New Hampshire 98.69
25 Pennsylvania 98.02
26 Vermont 96.23
27 Georgia 93.47
28 Oklahoma 90.65
29 California 88.76
30 Connecticut 87.56
31 Massachusetts 85.96
32 Maine 85.43

The LQ for the final group of states (18 states + District of Columbia) is less than 85.0. In these states manufacturing may be an important part of the economy and there may be pockets where there are high concentrations of exports. Manufacturing does not drive the fortunes of the state in the same way it does in the states with higher LQs.

Colorado is a perfect example. Manufacturing has a LQ of 60.1 and the industry accounts for 8.4% of private sector output. The state has competencies in food and beverage and computer and other high-tech manufacturing. By contrast, Oregon has substantially fewer manufacturing workers and appreciably greater manufacturing output. (The Portland-Vancouver MSA manufacturing output is $47.3 billion vs. almost $20 billion for the entire state of Colorado). In Oregon manufacturing accounted for 31.3% of total private sector GDP in 2012.

Rank State LQ
33 South Dakota 78.71
34 Virginia 75.03
35 West Virginia 74.79
36 Arizona 68.53
37 Rhode Island 64.13
38 New Jersey 62.70
39 Colorado 60.83
40 New Mexico 60.06
41 Montana 59.00
42 Delaware 55.52
43 North Dakota 55.04
44 Wyoming 49.24
45 Maryland 48.97
46 New York 43.62
47 Florida 39.72
48 Nevada 34.36
49 Alaska 26.87
50 Hawaii 14.67
51 District of Columbia 1.94

Colorado Manufacturing Employment Stronger than U.S.

Since 1990 Colorado manufacturing employment has fared better than U.S. manufacturing employment. This has occurred in part because Colorado has grown off a much smaller base. Also the mix of companies in Colorado has not included some of the industries, such as textiles, that were hit hardest by outsourcing.

Colorado’s strength in manufacturing is beverages such as Coors/Miller and Budweiser. As well, the state has competencies in select high-tech sectors.

The bad news for Colorado is that the industry’s location quotient, or concentration, is well below 1.0 and trending downward.  In other words, Colorado has a lower concentration of manufacturers than the U.S.

U.S. vs. Colorado Manufacturing Employment
U.S. vs. Colorado Manufacturing Employment.


Strong Colorado Manufacturing Output is Essential to Growth of Colorado

For the period 1997 to 2012, Colorado Real GDP expanded on a more consistent basis than the Colorado manufacturing output. In other words, overall output growth was less volatile.

However; manufacturing Real GDP grew at an annualized rate of 4.6% compared to 2.9% for Real GDP. The faster rate of growth for Colorado occurred, in part, because the manufacturing sector expanded off a much smaller base. Also, a portion of Colorado manufacturing is high value goods, such as electronics.

For this period, total employment increased as an annualized rate of 1.0% and manufacturing declined at an annualized rate of 2.3%. It is clear that gains in output were made as a result of capital expenditures, rather than investment in labor.

Note: At the time of this writing, the 2012 data was the most current data available.

Colorado Manufacturing Output
Growth of Colorado manufacturing output has outpaced growth of state output.