The Colorado Population, 5.3 million People Strong

Colorado is noted for its diverse geography and population. In July 2014 the total Colorado population of the state’s 64 counties was 5,353,471, up from 4,338,801 in 2000 and 5,050,289 in 2010.

Colorado has 7 Metropolitan Statistical Areas (MSA). As expected, the Colorado-Lakewood-Aurora MSA is the largest with slightly more than half the state’s population. There are 4,688,482 people living in the 7 MSAs, or 87.6% of the state’s population

Denver 2,753,338 51.4%
Colorado Springs 711,364 13.3%
Fort Collins 323,863 6.0%
Boulder 313,708 5.9%
Greeley 276,079 5.2%
Pueblo 161,782 3.0%
Grand Junction 148,348 2.8%

In 2014 the state had 11 counties with populations greater than 100,000. Combined their population was 4,371,483, or 84.2% of the total Colorado population.

County Population
El Paso 665,070
Denver 664,220
Arapahoe 618,341
Jefferson 558,532
Adams 480,317
Larimer 323,863
Douglas 314,592
Boulder 313,708
Weld 276,079
Pueblo 161,782

There are 27 counties with a population between 10,000 and 62,000 people. These 27 counties have a combined population of 710,198. Broomfield is the largest county in this group with 61,826 people and
Yuma is the smallest with 10,132.

Colorado has 26 counties with a population less than 10,000 people. The combined population of these counties is 118,421. Of this group, 3 counties (Hinsdale, San Juan, and Mineral) have populations less than 1,000.

The populations for each of the state’s 64 counties is listed in the table below.

County Population % Total
El Paso 665,070 12.42%
Denver 664,220 12.41%
Arapahoe 618,341 11.55%
Jefferson 558,532 10.43%
Adams 480,317 8.97%
Larimer 323,863 6.05%
Douglas 314,592 5.88%
Boulder 313,708 5.86%
Weld 276,079 5.16%
Pueblo 161,782 3.02%
Mesa 148,348 2.77%
Broomfield 61,826 1.15%
Garfield 57,548 1.07%
La Plata 54,014 1.01%
Eagle 52,831 0.99%
Fremont 46,294 0.86%
Montrose 40,904 0.76%
Delta 30,027 0.56%
Summit 29,399 0.55%
Morgan 28,254 0.53%
Montezuma 25,812 0.48%
Elbert 24,144 0.45%
Routt 23,896 0.45%
Teller 23,394 0.44%
Logan 22,088 0.41%
Chaffee 18,454 0.34%
Otero 18,380 0.34%
Pitkin 17,645 0.33%
Park 16,383 0.31%
Alamosa 15,870 0.30%
Gunnison 15,660 0.29%
Grand 14,505 0.27%
Las Animas 14,060 0.26%
Moffat 12,870 0.24%
Archuleta 12,249 0.23%
Prowers 11,985 0.22%
Rio Grande 11,574 0.22%
Yuma 10,132 0.19%
Clear Creek 9,153 0.17%
Conejos 8,229 0.15%
San Miguel 7,823 0.15%
Kit Carson 7,818 0.15%
Lake 7,349 0.14%
Rio Blanco 6,607 0.12%
Huerfano 6,428 0.12%
Saguache 6,206 0.12%
Gilpin 5,830 0.11%
Crowley 5,551 0.10%
Bent 5,539 0.10%
Lincoln 5,508 0.10%
Washington 4,769 0.09%
Ouray 4,587 0.09%
Phillips 4,380 0.08%
Custer 4,373 0.08%
Baca 3,624 0.07%
Costilla 3,556 0.07%
Sedgwick 2,331 0.04%
Dolores 1,933 0.04%
Cheyenne 1,870 0.03%
Jackson 1,388 0.03%
Kiowa 1,385 0.03%
Hinsdale 769 0.01%
San Juan 718 0.01%
Mineral 697 0.01%
Colorado 5,353,471 100.00%

Boulder County and Larimer County Business Development

Both Boulder County and Larimer County are the source of innovation and entrepreneurship that helps drive the Colorado economy.

This analysis compares changes in the unemployment rate, population growth, the number of private sector establishments, and employment. It shows how the growth patterns for the two counties are significantly different for these demographics.

In summary, this comparison shows that:
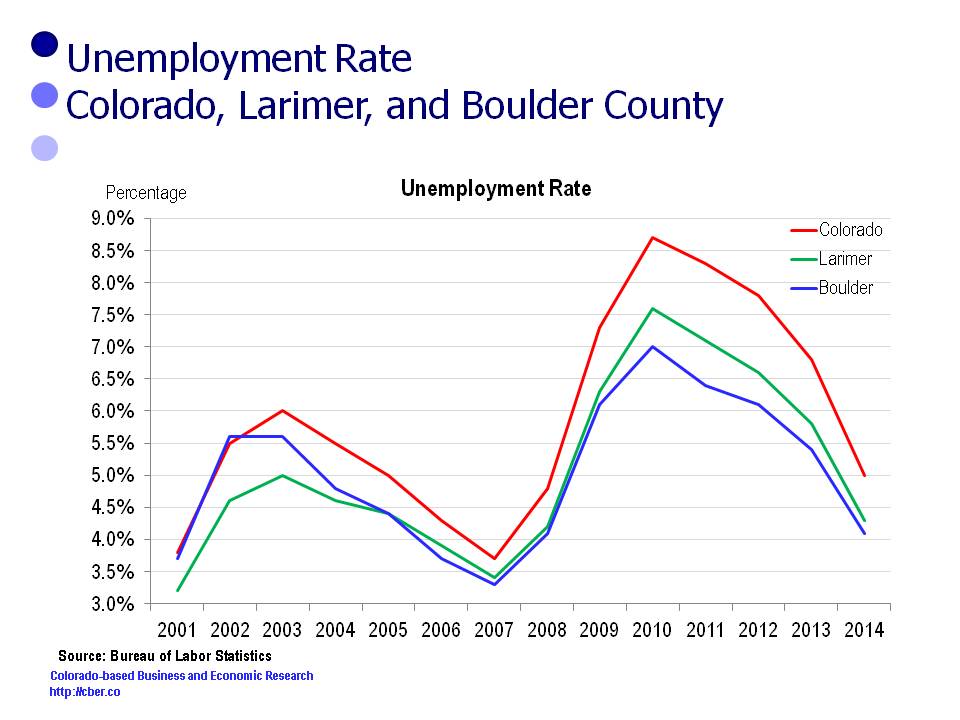
• Since 2001, Boulder County and Larimer County have usually had unemployment rates below the state – which is a mixed blessing.
• Since 2001, the population, employment, and number of private sector establishments for Boulder County have grown below the rates for Colorado and Larimer County.
Finally, this analysis poses questions that relate to the changes in these data sets.

Unemployment Rate

Typically, the unemployment rates for both Boulder and Larimer County are below the rate for the state.Boulder County and Larimer County

Population

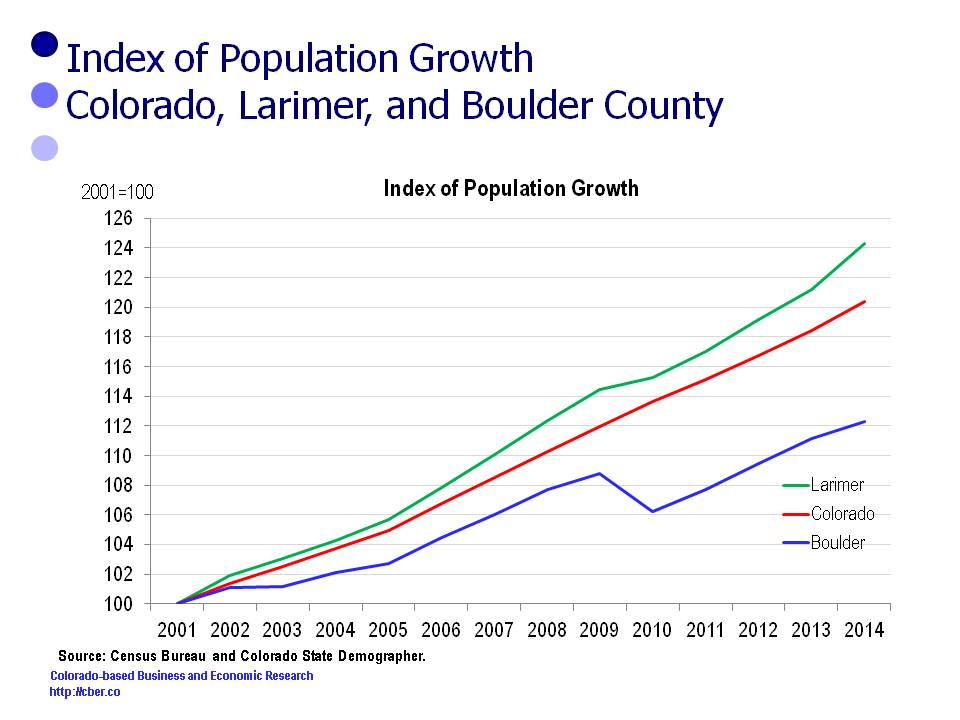
In 2001 Larimer County population was 260,746. It increased by 63,376 and was 324,122 in 2014.
In 2001 the Colorado population was 4,444,513. It increased by 906,059 and was 5,350,572 in 2014.
In 2001 Boulder County population was 278,981. It increased by 34,352 and was 313,333 in 2014.

For this period the rates of change in the population follow:
• Larimer County 24.3%
• Colorado 20.4%
• Boulder County 12.3%.

Boulder County and Larimer County

Establishments

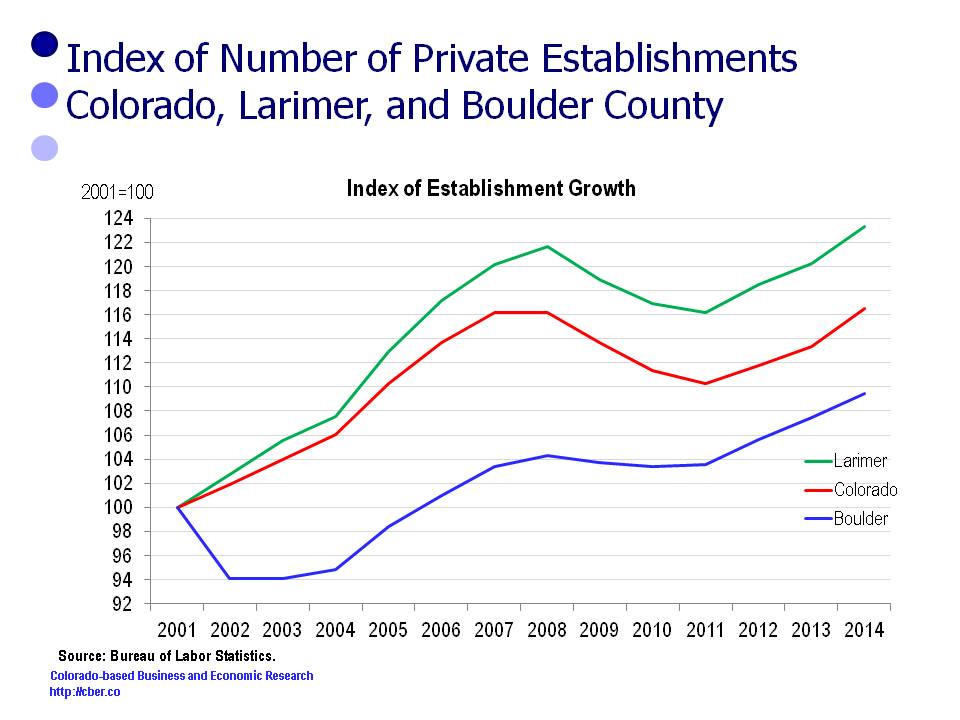
In 2001 there were 8,479 Larimer County establishments. The number increased by 1,976 to 10,455 in 2014.
In 2001 there were 151,025 Colorado establishments. The number increased by 24,957 to 175,992 in 2014.
In 2001 there were 12,335 Boulder County establishments. The number increased by 1,165 to 13,500 in 2014.

For this period the rate of change in the number of establishments follows:
• Larimer County 23.0%
• Colorado 16.5%
• Boulder County 9.4%.

Boulder County and Larimer County

Employment

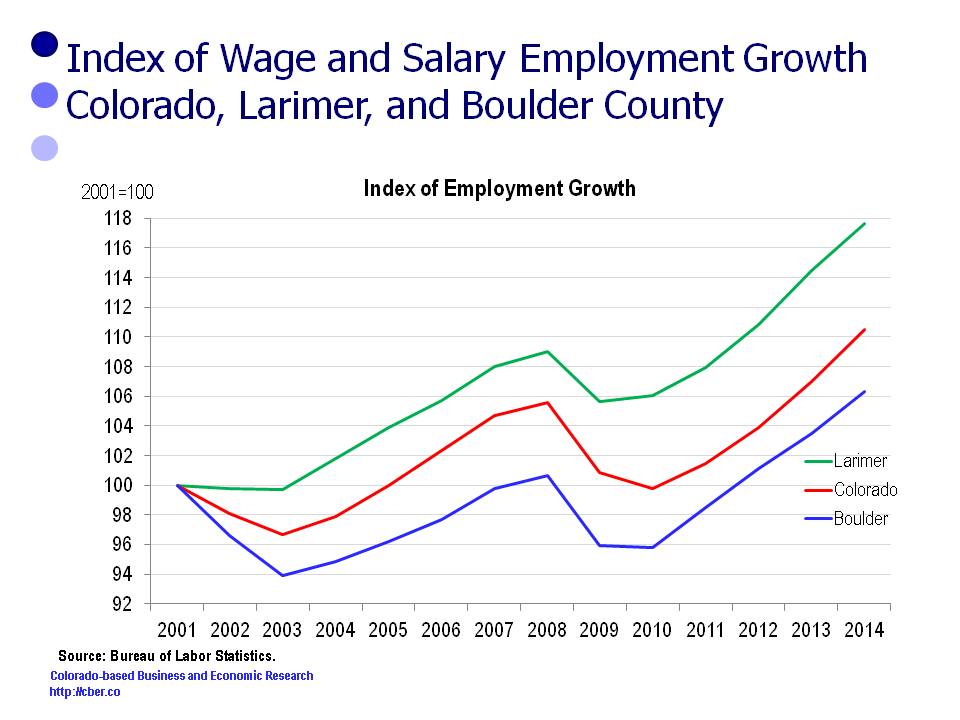
In 2001 Larimer County employment was 126,300. It increased by 22,300 and was 148,600 in 2014.
In 2001 Colorado employment was 2,226,800. It increased by 234,000 and was 2,460,800 in 2014.
In 2001 Boulder County employment was 166,200. It increased by 10,500 and was 176,700 in 2014.

For this period the rate of change in the employment follows:
• Larimer County 17.6%
• Colorado 10.5%
• Boulder County 6.3%.

Boulder County and Larimer County

Implications

The following questions arise when looking at the changes in the unemployment rate, population, the number of private sector establishments, and employment in Boulder County and Larimer County. (Boulder County is also the Boulder MSA and Larimer County is the Fort Collins MSA).

• How do organizations in Boulder and Fort Collins find qualified workers when the regional unemployment rate is lower than the state and other MSAs? Do they have established training programs? Do they recruit workers from other companies (in-state or out-of-state)? Do they provide their workers premium compensation packages?
• Why is the rate of growth for the Boulder population lower than Fort Collins and the state? Is this a result of a lack of affordable and attainable housing in Boulder? Will the completion of improvements to the 36 corridor make it easier for workers to commute to Boulder? Can commuters afford to use it?
• Why are the number of new business establishments in Boulder growing at a slower rate than Colorado and Fort Collins? Is there a lack of adequate commercial space? Is commercial real estate too expensive in Boulder? Why are other areas more attractive? Is it too expensive to operate a business in Boulder? Is it necessary to export innovative ideas out of Boulder so companies can be successful? Why do companies stay in Boulder
• Why is the employment growth rate for Boulder lower than the state and Fort Collins?

This analysis of data for Larimer, Boulder, and Colorado shows that communities have varied business development policies and priorities that have been successful in different ways.

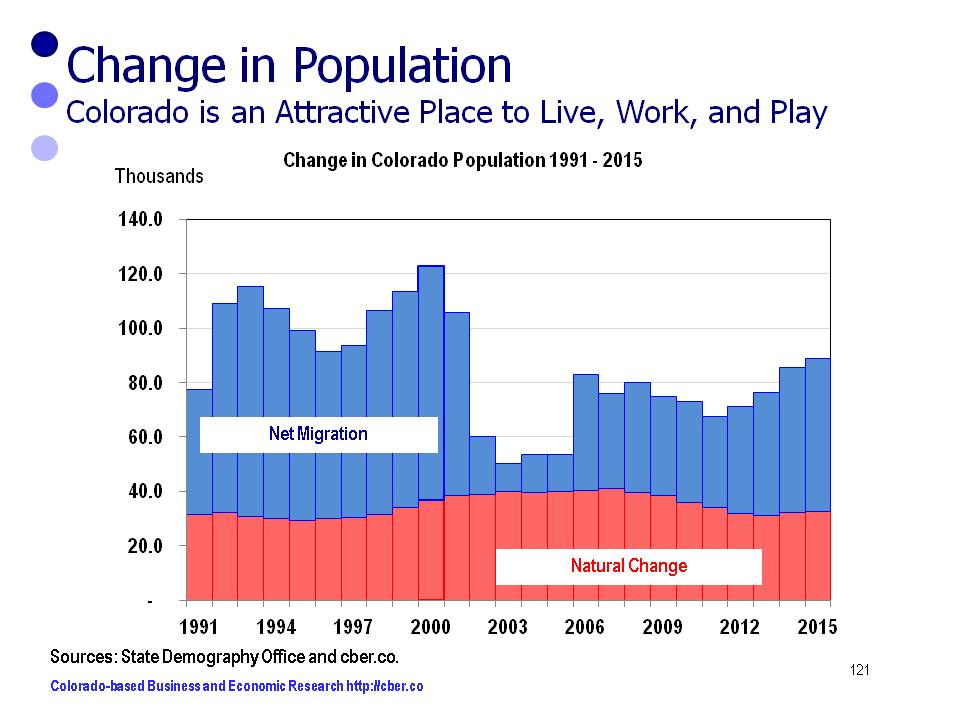
Colorado Population – 5.4 Million in 2015

The Colorado population increases and decreases are a result of the natural rate of change (births minus deaths) and the change in net migration (people moving into the state minus people moving out of the state).

Over the past two decades the natural change (red bars) varied from a low of 29,168 in 1995 to a peak of 41,124 in 2007.

Changes resulting from net migration (blue bars) are closely tied to the strength of the economy. For example, there were five years, from 1986 to 1990, when net migration was negative. More people moved out of state than moved into the state to escape a regional recession. During the past two recessions, net migration declined, but did not turn negative because it was difficult for people to move. Net migration remained positive.

The Colorado population increased by about 86,000 in 2014 and will increase by about 89,000 in 2015.

Net migration will increase by 56,000 in 2015, the highest level of change since 2001. In 2015 the state’s population will increase by 1.7% to 5.4 million.

change in popuoation

Colorado Population to Increase by 90,000 in 2014

The Colorado population increases and decreases are a result of the natural rate of change (births minus deaths) and the change in net migration (people moving in the state minus people moving out of the state).

Over the past two decades the natural change gradually increased from 31,400 in 1991 to a peak of 40,230 in 2006.

Changes resulting from net migration are closely tied to the strength of the economy. For example, there were five years, from 1986 to 1990, when net migration was negative. More people moved out of state than moved into the state to escape a regional recession. During the past two recessions, net migration declined because it was difficult for people to move and net migration remained positive.

The Colorado population will increase by about 90,000 in 2014.  The natural rate of change will rise to 37,000. Net migration will increase dramatically to 53,000, the highest level of change since 2001.

Changes in Colorado population
The Colorado population is changing at a faster rate because of increased net migration.

©Copyright 2011 by CBER.

Are We Better Off Than We Were Four Years Ago? – Colorado

This election season has featured an abundance of discussion about where the state is better off now than we were four years ago. In some cases, we are better off today and in other cases we are not.  The following data provides a snapshot of key metrics that fit into both categories.

Colorado Population
People like to visit and live in Colorado. Continued population growth is projected on a long-term basis.
• Although Net Migration has slowed, Colorado’s population continues to grow at a steady pace.
Colorado Employment and Unemployment
Increased population growth points to long-term job gains and lower employment.
• During the 69 months between January 2007 and September 2012 Colorado only gained jobs in 34 months (seasonally adjusted data).
• In 2012, Colorado employment is well below employment of 2007 and 2008, but it is trending upwards.
• In 2012, jobs are being added at a faster rate than they were in 2008, but not 2007.
• The number of unemployed workers is more than twice as much in 2012 as it was in 2007. It is also greater than 2008.
• The unemployment rate in 2012 is twice the 2007 rate and much higher than in 2008.
• In 2012, the unemployment rate and the number of unemployed workers is trending downward, whereas, it was trending upward in 2008.

Colorado Employment by Sector
Segments of the economy are healthier than they were in 2008.
• Projected annual state employment for 2012 will be about 56,900 less than the total for 2008. The following sectors have greater 2012 employment than 2008: Private Education and Health Care, Higher Education, Tourism, K-12 Education, Corporate Headquarters (MCE), Federal Government, Employment Services, State Government, Extractive Industries, and Professional and Scientific and Technical Services.
Colorado Job Creation
Improved firm and job creation is necessary if the economy is to recover at a faster rate.
• Gross job losses and job gains for 2011 are less than 2008. Improvement in net job gains is more a result of decreased layoffs than actual job creation.

Income and Wages
Recent wage and income data is mixed.
• Per Capita Personal Income – The 2011 average is slightly below the value for 2008.
• Colorado Median Household Income – The 2011 median is below the value for 2008.
• Average Annual Wages – The 2011 average is above the value for 2008.

Colorado Output
Increased employment and wages will point to increased demand for goods and services. This in turn will push output upwards.
• Colorado Real GDP was greater than the U.S. for 2007 to 2011.
• The following sectors have shown steady growth since 1997 and 2011 output is greater than 2007 and 2008: Retail Trade; Professional, Scientific, and Technical Services; Health Care; Finance and Insurance; and Information.
• Real output for the Construction sector was greater in 2007 and 2008 than 2011 for both Colorado and the U.S.

Colorado and Inflation
Overall inflation has been minimal; however, inflation in key areas has been noticeable.
• Overall inflation has been minimal since the beginning of the Great Recession. Apparel and Housing are the only sectors that have grown at a lower rate than All Items for Coloradans.
Construction and Housing
There is improvement in the Construction and Housing markets.
• The number of permits in 2012 is greater than 2008, although they are well below the levels shown in the 2000s.  Most importantly, permits are slowly trending upwards.
• 2012 Colorado housing prices are approaching 2008 levels.
• Home ownership rates in 2011 are below the rates in 2008. More importantly, they are trending downwards.

General Fund and Retail Trade Sales
Gross General Fund Revenue is trending upwards because of stronger job gains (income taxes) and retail trade sales (sales taxes).
• Retail Sales are improving. Projected Sales Tax Revenue for the fiscal year ending June 2013 will exceed revenue for FYE 2008 (not adjusted for inflation). This tax accounts for about one-fourth of Gross General Fund Revenue.
• Projected Net Individual Income Tax for the fiscal year ending June 2012 will exceed FYE 2008 (not adjusted for inflation). This tax accounts for about two-thirds of Gross General Fund Revenue.
• Projected General Fund Revenue for the fiscal year ending June 2012 will match FYE 2008 (not adjusted for inflation).

For more detailed analysis of the state of the economy compared to four years ago, visit https://cber.co or click here.


©Copyright 2011 by CBER.

LEHD and Quickfacts – Commerce City – A Community with Atypical Demographics

Are you a data geek looking for a fix? If so, have you tried the LEHD or Census Quickfacts databases?

The two databases contain information from the U.S. Census Bureau and the Bureau of Labor Statistics. They are combined in a way that allows data geeks, public and private leaders, and others to learn more about their local population and workforce and see what makes their local economy work (or not work).

To illustrate this point, let’s take a look at five examples of information that can be gleaned for Commerce City, Colorado. (Those in the Denver MSA think of Commerce City as the home of the refinery located along Highway 270.)

Example 1
In Colorado 24.5% of the workforce has earnings of $1,250 per month or less, 36.1% have earnings of $1,251 to $3,333 per month, and 39.5% have earnings of more than $3,333 per month.

In Commerce City 17.1% of the workforce has earnings of $1,250 per month or less, 34.2% have earnings of $1,251 to $3,333 per month, and 48.7% have earnings of more than $3,333 per month.

This begs the question, “What industries are driving the higher concentration of earnings in the upper wage category for Commerce City?”

Example 2
In Colorado 50.8% of the workforce is male and 49.2% is female.
In Commerce City 73.7% of the workforce is male and 26.3% is female.

So, why are there more men workers than women in Commerce City? What are the types of jobs that cause that difference?

Example 3
In Colorado 50.1% of the population is male and 49.9% is female.
In Commerce City 50.4% of the population is male and 49.6% is female.

OK? The mix of men and women in Commerce City is split about 50-50, but the workforce (example 2) is not. Where do Commerce City employers find the workers to fill their jobs? Where do the Commerce City women go to work?

Example 4
In Colorado the median value of an owner-occupied home is $236,600
In Commerce City, the median value of an owner-occupied home is $206,600

Earlier we learned that Commerce City has a higher percentage of workers in the upper earnings bracket. If that is the case, then why isn’t the value of the homes higher there? Or do the Commerce City workers in the upper bracket live somewhere other than Commerce City?

Example 5
In Colorado 35.9% of the workforce has a Bachelor’s degree or higher.
In Commerce City 19.8% of the workforce has a Bachelor’s degree or higher.

Again, we previously learned that Commerce City has a higher percentage of workers in the upper earnings bracket. If that is the case, then what types of jobs are they performing that pay well and don’t require a college degree? Or do the people with college degrees live elsewhere and work in Commerce City?

In the matter of minutes it is possible to create a profile about any local community in the United States. Once that sketch of a community is prepared, then another series of probing questions can be asked to address policy decisions regarding social, economic, workforce, or education issues.

What’s the story behind your community? Check out LEHD and Quickfacts to learn more.


©Copyright 2011 by CBER.

Why are People Moving Out of Boulder County?

Boulder County is the hub of Colorado’s high-tech industry.  It is the home of IBM, Ball Aerospace, and several federal labs and a host of other high-tech companies. At times the Boulder economy is like the city’s image – it sometimes moves to the beat of a different drummer. For instance, the unemployment in the county is typically lower than that of the state, average annual wages are much higher than the state average, and the county economy often lags the state when entering recessions.

As well, the county population increased by 0.7% during the 2000s, a little over half the rate of growth for the state. That is not particularly surprising given the high prices of housing in the City of Boulder and the image that it has developed as a “no growth” city (Boulder is the dominant city in the county). Between 2000 and 2010, the county population increased about 19,232 people. About  84% of that growth occurred in 4 years,  2001 and 2006-2008.

Looking more closely, it can be seen that during the first half of the past decade, the natural rate of increase for the county was between 2,000 and 2,400 people a year (The natural rate of increase is births minus deaths). The rate tapered off during the second half of the decade and ranged between 1,600 and 1,900. All together the natural rate changed by 20,296 people.

The shocker is that there was negative net migration during this period (Net migration is the difference between the number of people who move in and the number who move out). In other words, the hospitals and funeral homes were busy, but apparently the moving vans were busier.

So what does this mean for the county? At first glance, the implications could be significant – it could affect schools, tax receipts, and services provided. Stay tuned as the story unfolds in the months ahead.


©Copyright 2011 by CBER.

State Population Approaches 5.2 Million – State Demography Office

On November 4, Cindy DeGroen, Projections Demographer, and Elizabeth Garner, State Demographer, presented their annual population update and key findings from the 2010 U.S. Census at the annual State Demographer‘s meeting. A sampling of the information from their reports follows.

In 2010, the state population topped 5 million. By 2012, the population will reach about 5.2 million, with about 72,300 births, 32,400 deaths, and net migration of 36,500. This represents a net gain of about 76,400 people.

The top five counties in population (July) are:
1 El Paso 627,096
2 Denver 605,722
3 Arapahoe 575,022
4 Jefferson 535,533
5 Adams 443,715

The five counties with the least population are:
60 Kiowa 1,399
61 Jackson 1,390
62 Hinsdale 847
63 (tie) Mineral 710
63 (tie) San Juan 710

The census showed that between 2000 and 2010 the state added a net of 727,935 people.
• Douglas County added 109,699
• El Paso County added 105,334
• Arapahoe County added 84,036
• Adams County added 77,746
• Weld County added 71,889
In total these five counties added 448,704 people, or about 62% of the population increase during this period.

From a municipal perspective, the following 5 cities posted the top gains:
• Colorado Springs 55,537
• Aurora 48,685
• Denver 45,522
• Thornton 36,388
• Castle Rock 28.007

The following 5 cities posted the largest losses:
• Wheat Ridge  -2,747
• Englewood  -1,472
• Lakewood  -1,146
• Walsenburg  -1,114
• Lamar  -1,065

From this sampling of data it is clear to see that the state is evolving rapidly, as certain areas gain and lose population and workforce.


©Copyright 2011 by CBER.