Q3 2015 Real GDP Records 2.0% Gain

On December 22nd, the Bureau of Economic Analysis released the “third estimate” of the Q3 2015 Real GDP for the United States. It increased at an annualized rate of 2.0% compared to 3.9% for Q2.

The nominal or current-dollar GDP (chained on 2009) for Q3 increased by $146.5 billion to $18,060.2 billion, a gain of 3.3%. The Q2 current-dollar GDP rose by 6.1% or $264.4 billion.

2015 Real GDP, Chained Dollars (2009 Billions)


Q1

Q2

Q3

        Gross domestic product

$16,177

$16,334

$16,414

Personal consumption expenditures

$11,081

$11,179

$11,262

    Goods

$3,804

$3,855

$3,902

    Services

$7,277

$7,325

$7,363

Gross private domestic investment

$2,830

$2,865

$2,860

    Fixed investment

$2,701

$2,736

$2,761

        Nonresidential

$2,189

$2,211

$2,225

        Residential

$512

$524

$534

    Change in private inventories

$113

$114

$86

Net exports of goods and services

$(541)

$(535)

$(546)

    Exports

$2,091

$2,118

$2,121

        Goods

$1,429

$1,452

$1,449

        Services

$661

$664

$671

    Imports

$2,633

$2,652

$2,667

        Goods

$2,161

$2,178

$2,186

        Services

$470

$472

$480

Government consumption expenditures

$2,839

$2,857

$2,870

    Federal

$1,111

$1,111

$1,112

        National defense

$680

$681

$678

        Nondefense

$431

$430

$433

    State and local

$1,726

$1,744

$1,756

Residual

$(41)

$(45)

$(49)

The 2015 Q3 Real GDP posted gains in the following areas:
• Personal consumption expenditures, the largest category, were up by 3.0% compared to 3.6% in the previous quarter. Goods were up 5.0% and Services were up 2.1%.
• Fixed investments posted a gain of 3.7% in Q3, down from 5.2% in Q2. Nonresidential investments for Q3 were up 2.6% and residential investments rose 8.2%. Both had lower levels of growth than Q2.
• Exports posted a gain of 0.7% for Q3 compared to 5.1% in Q2. Goods actually declined by -0.9% while services increased by 3.9%.
• Imports recorded an increase of 2.3% in Q3 compared to 3.0% in Q2. Goods increased by 2.3% while services posted a 6.4% increase. (Note: Imports are subtracted from the value of the GDP).
• Government consumption increased by 1.8% in Q3 compared to 2.6% in Q2. Federal spending was flat with a decrease in national defense spending and an increase in Nondefense spending. State and local government spending posted a 2.8% gain, down from 4.3% in the prior quarter.

Percent Change From Preceding Period in Real GDP – Seasonally Adjusted at Annualized Rates

Q1 Q2 Q3
        Gross domestic product 0.6 3.9 2.0
Personal consumption expenditures 1.8 3.6 3.0
    Goods 1.1 5.5 5.0
    Services 2.1 2.7 2.1
Gross private domestic investment 8.6 5.0 -0.7
    Fixed investment 3.3 5.2 3.7
        Nonresidential 1.6 4.1 2.6
            Structures -7.4 6.2 -7.2
            Equipment 2.3 0.3 9.9
            Intellectual property products 7.4 8.3 -0.8
        Residential 10.1 9.3 8.2
    Change in private inventories
Net exports of goods and services
    Exports -6.0 5.1 0.7
        Goods -11.7 6.5 -0.9
        Services 7.3 2.3 3.9
    Imports 7.1 3.0 2.3
        Goods 7.2 3.2 1.4
        Services 6.7 2.0 6.4
Government consumption expenditures -0.1 2.6 1.8
    Federal 1.1 0.0 0.2
        National defense 1.0 0.3 -1.4
        Nondefense 1.2 -0.5 2.8
    State and local -0.8 4.3 2.8
Addendum:
    Gross domestic product, current dollars 0.8 6.1 3.3

Q4 2015 Real GDP is expected to be stronger than Q3 and the rate of growth for 2015 will be in the range of 2.3% to 2.5%.
Advanced Technology Cluster Contributes 17.8% to GDP Growth

In early June the Bureau of Economic Analysis released Gross Domestic Product at the state level for two-digit NAICS Codes.

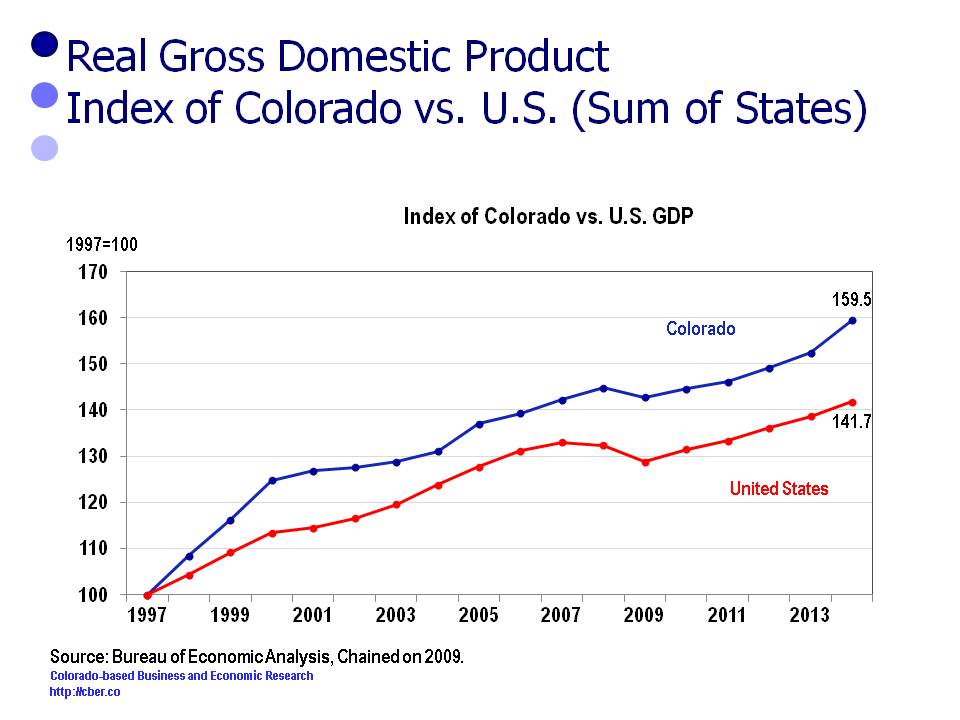
Since 1997 Colorado Real GDP has grown at a faster rate than the Real GDP for the U.S. (Sum of States) in 11 of 17 years. The 2014 U.S. rate of growth was 2.2% compared to 4.7% for Colorado.

Since 1997 Colorado Real GDP has grown at a faster rate than the U.S. (Sum of States), 2.8% vs. 2.1%.

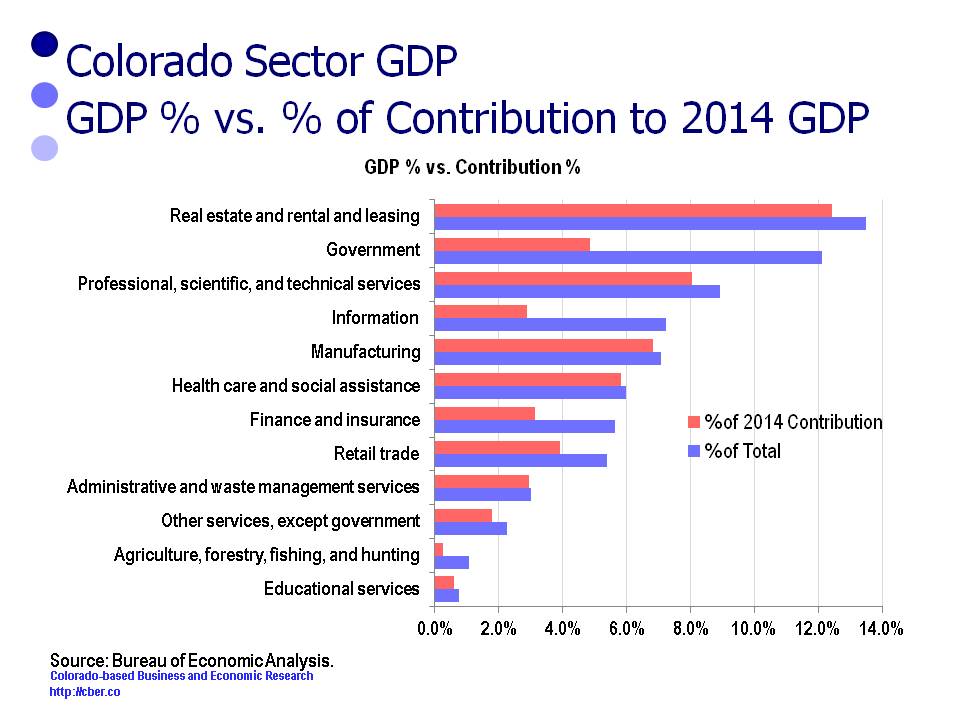
There were 12 sectors that lost share in 2014, i.e. their percent of contribution for these sectors was less than their percent of the 2014 total. Collectively, they accounted for 72.9% of the 2014 GDP and 53.5% of the change in the GDP. It was disappointing that the proxy for Colorado’s advanced technology cluster only contributed 17.8% to state’s GDP.

The following table shows the sectors, their percentage of the 2014 GDP and their contribution to the GDP.

Sector % of 2014 Total % of 2014 Contribution
Educational services 0.7% 0.6%
Agriculture, forestry, fishing, and hunting 1.1% 0.3%
Other services, except government 2.3% 1.8%
Administrative and waste management services 3.0% 2.9%
Retail trade 5.4% 3.9%
Finance and insurance 5.6% 3.1%
Health care and social assistance 6.0% 5.8%
Manufacturing 7.1% 6.8%
Information 7.2% 2.9%
Professional, scientific, and technical services 8.9% 8.1%
Government 12.1% 4.8%
Real estate and rental and leasing 13.5% 12.4%

There are concerns regarding the level of contribution for the five sectors that have the greatest share of the state’s GDP. The top sectors are:
• Real Estate 13.5%
• Government 12.1%
• Professional, scientific, and technical services, 8.9%
• Information 7.2%
• Manufacturing 7.1%
These five sectors accounted for 48.8% of the 2014 GDP; however they only contributed 35.0% of the 2014 GDP growth.

Of specific concern is the fact that PST, Information, and Manufacturing accounted for 23.2% of the state’s 2014 GDP, yet these 3 sectors only contributed 17.8% of the growth of the GDP. These three sectors are a proxy for the state’s advanced technology cluster, a cluster that is supposed to provide the state with a competitive advantage.

Despite these concerns, the level of Real GDP Growth in 2014 provided significant momentum for the Colorado economy moving into 2015.

GDP losing share - Advanced Technology Cluster

Mining Sector Largest Contributor to State’s GDP in 2014

In early June the Bureau of Economic Analysis released Gross Domestic Product at the state level for two-digit NAICS Codes.

Since 1997 Colorado Real GDP has grown at a faster rate than the Real GDP for the U.S. (Sum of States) in 11 of 17 years. The 2014 U.S. rate of growth was 2.2% compared to 4.7% for Colorado. The Mining Sector played a major role in Colorado’s higher rate of growth this past year.

Since 1997 Colorado Real GDP has grown at a faster rate than the U.S. (Sum of States), 2.8% vs. 2.1%.

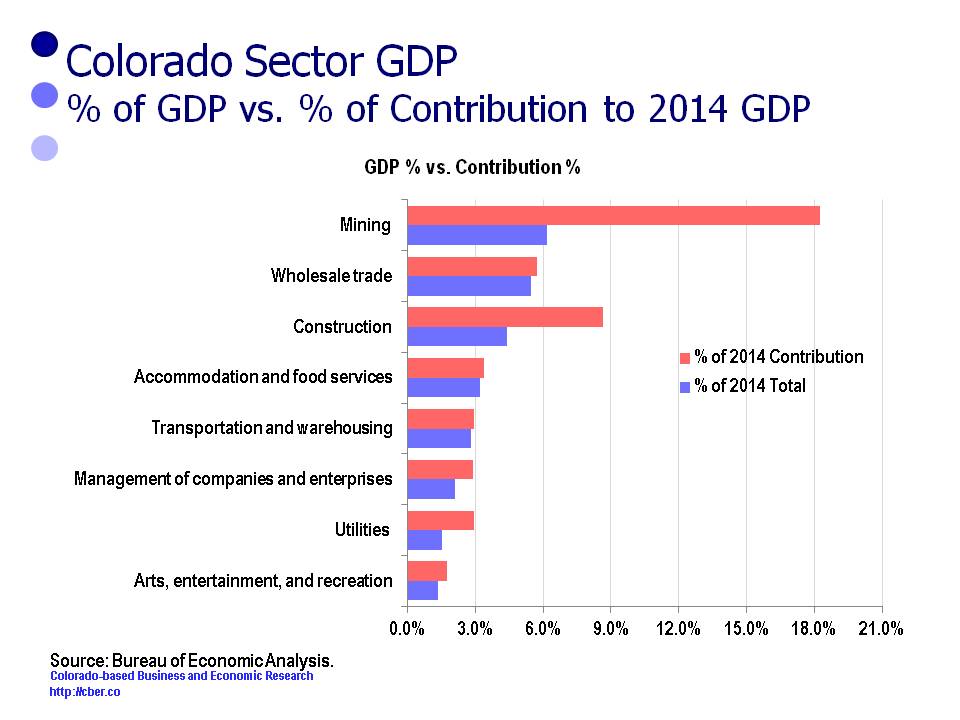
There were 8 sectors that gained share in 2014, i.e., their percent of contribution to GDP was greater than their percent of the 2014 total GDP. Collectively, they accounted for 27.1% of the 2014 GDP and 46.5% of the change in the GDP.

The following table shows the sectors, their percentage of the 2014 GDP, and their contribution to the GDP.

Sector % of 2014 Total % of 2014 Contribution
Arts, entertainment, and recreation 1.3% 1.8%
Utilities 1.5% 3.0%
Management of companies and enterprises (MCE) 2.1% 2.9%
Transportation and warehousing 2.8% 2.9%
Accommodation and food services 3.2% 3.4%
Construction 4.4% 8.6%
Wholesale trade 5.5% 5.7%
Mining 6.2% 18.2%

Key points about the contribution of these sectors to GDP growth are listed below.
• The Mining Sector was the major driver in the growth of the state’s GDP, accounting for 18.2% of the change. Volatility in the price of a barrel of oil could potentially have a major impact on this sector’s level of contribution to the 2015 GDP.
• The contribution of the Construction Sector has been driven by a mix of sustained residential and nonresidential growth.
• The combination of the Arts, Entertainment, and Recreation and the Accommodation and Food Services sectors are commonly referred to as Tourism or Leisure and Hospitality. In 2014 the Tourism sector accounted for 4.5% of the GDP% and 5.2% of its growth. Tourism is an important part of the economy for each of the state’s 64 counties.
• The Utilities sector is small, but it experienced growth in 2014 because of strong overall employment and population growth. In addition, GDP growth increased because there was a significant gain in the number of business establishments in 2014.
• The increase in the MCE sector is a result of a 4.5% increase in the number of MCE establishments. In other words more businesses translated into greater GDP growth.
• Both the Wholesale Trade and the Transportation and Warehousing Sectors are small industries. In 2015 they experienced greater than usual gains in employment, which in turn meant stronger GDP growth.

With 4.7% Real GDP growth in 2014, the state economy had significant momentum moving into 2015. Through the first six months of the year, the state has capitalized on that momentum.

gdp gaining share - mining sector

2014 Colorado Real GDP Growth More than Twice the Rate for U.S.

In early June the Bureau of Economic Analysis released Gross Domestic Product at the state level for two-digit NAICS Codes.

Since 1997 Colorado Real GDP has grown at a faster rate than the Real GDP for the U.S. (Sum of States) in 11 of 17 years.

gdp index

Since 1997 Colorado Real GDP has grown at a faster rate than the U.S. (Sum of States), 2.8% vs. 2.1%. The 2014 U.S. rate of growth was 2.2% compared to 4.7% for Colorado.

gdp index

There were 8 sectors that gained share in 2014, i.e., their percent of contribution to GDP was greater than their percent of the 2014 total GDP. Collectively, they accounted for 27.1% of the 2014 GDP and 46.5% of the change in the GDP. These sectors were:
• Arts, entertainment, and recreation
• Utilities
• Management of companies and enterprises
• Transportation and warehousing
• Accommodation and food services
• Construction
• Wholesale trade
• Mining

There were 12 sectors that lost share in 2014, i.e. their percent of contribution for these sectors was less than their percent of the 2014 total. Collectively, they accounted for 72.9% of the 2014 GDP and 53.5% of the change in the GDP. These sectors were:
• Educational services
• Agriculture, forestry, fishing, and hunting
• Other services, except government
• Administrative and waste management services
• Retail trade
• Finance and insurance
• Health care and social assistance
• Manufacturing
• Information
• Professional, scientific, and technical services
• Government
• Real estate and rental and leasing

The level of Real GDP Growth in 2014 provided significant momentum for the Colorado economy moving into 2015.

Mining and Real Estate – Drivers of the Colorado Economy

Thank goodness for the  mining and real estate industries! From an output perspective these industries are the primary drivers of the Colorado economy.

In 2013, Colorado’s nominal GDP was $294.4 billion (most current data available). The state’s economy expanded by $157.1 billion between 1997 and 2013 (1997 is the first year that data was available). Between 2009 and 2013 the GDP expanded by $46.3 billion.

The Great Recession had a major impact on the way the economy expanded. This is evident when comparing the contribution to output for the periods 1997 to 2013 and 2009 to 2013.

Between 1997 and 2013 the contribution to GDP was broken down as follows:
• Goods Producing 20.5%
• Service Producing 68.6%
• Private sector (Goods + Services) 89.0%
• Government 11.0%

Between 1997 and 2013 the annualized rate of growth for the GDP follows:
• Total 4.9%
• Private 5.0%
• Government 4.1%

Between 2009 and 2013 the contribution to GDP was broken down as follows:
• Goods Producing 28.0%
• Service Producing 65.5%
• Private sector (Goods + Service) 93.6%
• Government 6.4%

Between 2009 and 2013 the annualized rate of growth for the GDP follows:
• Total 4.4%
• Private 4.7%
• Government 2.2%

Thank goodness for the Goods Producing Sectors (Agriculture, Mining, Construction, and Manufacturing)!

Industry 2013 GDP (millions) 2013 minus 1997 % of Total 2013 minus 2009 % of Total
All industry total $294,443 $157,072 $46,266
Private industries $258,217 $139,860 89.0% $43,287 93.6%
Goods Producing $57,447 $32,144 20.5% $12,964 28.0%
Service Producing $200,771 $107,718 68.6% $30,325 65.5%
Government $36,226 $17,212 11.0% $2,979 6.4%

The following two tables provide more detail by industry.

The following table shows more detail by industry sector. It is sorted in descending order by the column 2013 minus 1997.

Industry 2013 GDP (millions) 2013 minus 1997 % of Total 2013 minus 2009 % of Total
Real estate and rental and leasing $40,194 $21,355 13.6% $6,895 14.9%
Mining $19,848 $17,964 11.4% $8,518 18.4%
Government $36,226 $17,212 11.0% $2,979 6.4%
Professional, scientific, and technical services $26,355 $16,084 10.2% $4,233 9.1%
Information $21,578 $12,019 7.7% $1,407 3.0%
Health care and social assistance $17,438 $10,503 6.7% $2,262 4.9%
Wholesale trade $15,915 $7,818 5.0% $2,606 5.6%
Retail trade $16,105 $6,926 4.4% $1,965 4.2%
Manufacturing $21,600 $6,657 4.2% $2,171 4.7%
Finance and insurance $14,480 $6,067 3.9% $2,436 5.3%
Accommodation and food services $9,409 $5,255 3.3% $1,769 3.8%
Management of companies and enterprises $6,207 $5,106 3.3% $1,550 3.4%
Construction $11,820 $4,861 3.1% $208 0.4%
Administrative and waste management $8,653 $4,308 2.7% $1,090 2.4%
Transportation and warehousing $7,984 $4,094 2.6% $1,598 3.5%
Other services $6,549 $2,784 1.8% $605 1.3%
Agriculture, forestry, fishing, and hunting $4,179 $2,662 1.7% $2,067 4.5%
Arts, entertainment, and recreation $3,848 $2,029 1.3% $890 1.9%
Utilities $3,798 $1,782 1.1% $646 1.4%
Educational services $2,258 $1,588 1.0% $373 0.8%

The following table shows more detail by industry sector. It is sorted in descending order by the column 2013 minus 2009.

Industry 2013 GDP (millions) 2013 minus 1997 % of Total 2013 minus 2009 % of Total
Mining $19,848 $17,964 11.4% $8,518 18.4%
Real estate and rental and leasing $40,194 $21,355 13.6% $6,895 14.9%
Professional, scientific, and technical services $26,355 $16,084 10.2% $4,233 9.1%
Government $36,226 $17,212 11.0% $2,979 6.4%
Wholesale trade $15,915 $7,818 5.0% $2,606 5.6%
Finance and insurance $14,480 $6,067 3.9% $2,436 5.3%
Health care and social assistance $17,438 $10,503 6.7% $2,262 4.9%
Manufacturing $21,600 $6,657 4.2% $2,171 4.7%
Agriculture, forestry, fishing, and hunting $4,179 $2,662 1.7% $2,067 4.5%
Retail trade $16,105 $6,926 4.4% $1,965 4.2%
Accommodation and food services $9,409 $5,255 3.3% $1,769 3.8%
Transportation and warehousing $7,984 $4,094 2.6% $1,598 3.5%
Management of companies and enterprises $6,207 $5,106 3.3% $1,550 3.4%
Information $21,578 $12,019 7.7% $1,407 3.0%
Administrative and waste management $8,653 $4,308 2.7% $1,090 2.4%
Arts, entertainment, and recreation $3,848 $2,029 1.3% $890 1.9%
Utilities $3,798 $1,782 1.1% $646 1.4%
Other services $6,549 $2,784 1.8% $605 1.3%
Educational services $2,258 $1,588 1.0% $373 0.8%
Construction $11,820 $4,861 3.1% $208 0.4%


Government Sector is Top in Output and Jobs for Colorado

All industries are important to the economy for different reasons! Some may generate tax revenue for governments,  they may create jobs, or they might pay higher than average wages. Others may be lifestyle industries or they may be strong producers of output.  By comprehending how industries contribute to the economy, it is possible to better understand how they relate to each other and how they cause an economy to expand or contract.

There are distinct differences between the top 10 Colorado sectors for output and employment.  Government tops both lists. The sectors in green are common to both lists and are particularly important to the Colorado economy.

It is imperative to have public and private leaders who understand that industries are important to the economy for different reasons. They must recognize that some industries create jobs, others generate output, and some produce both.  In Colorado, the following sectors most effectively produce both: Health care; Retail trade; Professional, scientific, and technical; Manufacturing; and Finance and insurance.

2012 Colorado GDP

2012 CES Employment

  1. Government

  1. Government

  2. Real estate and rental and leasing

  2. Health care and social assistance

  3. Professional, scient., and tech..

  3. Accommodations and food services

  4. Information

  4. Retail trade

  5. Manufacturing

  5. Professional, scient., and tech.

  6. Finance and insurance

  6. Administrative and waste management

  7. Health care and social assistance

  7. Manufacturing

  8. Retail trade

  8. Construction

  9. Wholesale trade

  9. Finance and insurance

10. Mining

10. Other services

Source: BLS and BEA.

The top 10 output sectors account for 77.7% of total GDP and the top 10 job sectors account for 81.9% of total employment.

For additional analysis of Colorado employment and output go to the cber.co website.

©Copyright 2011 by CBER.