Colorado Job Growth is Solid – The Sky is Not Falling

There has been a streak of bad economic news within the past ten days; however, the fundamentals of the U.S. and Colorado economies are solid and the sky is not falling!

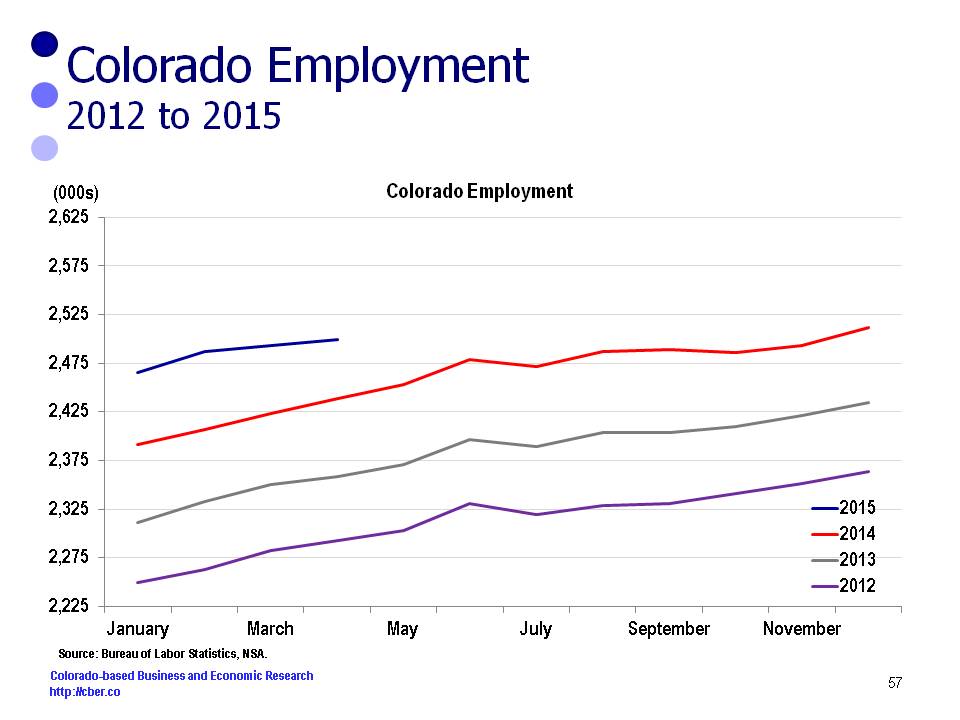
The Colorado Department of Labor and Employment announced the release of data showing that on average there are 65,900 more jobs for the first seven months of 2015 than the same period in 2014. The rate of increase is about 2.7%. While this level of job growth is solid, activity on the streets is much stronger.

Internationally, concerns have temporarily shifted away from violence in the Middle East. Worries have shifted to a slowdown in the economic growth of China, the magnitude of that slowdown, and the impact it would have on the global economy.Job Growth - The Sky is Not Falling

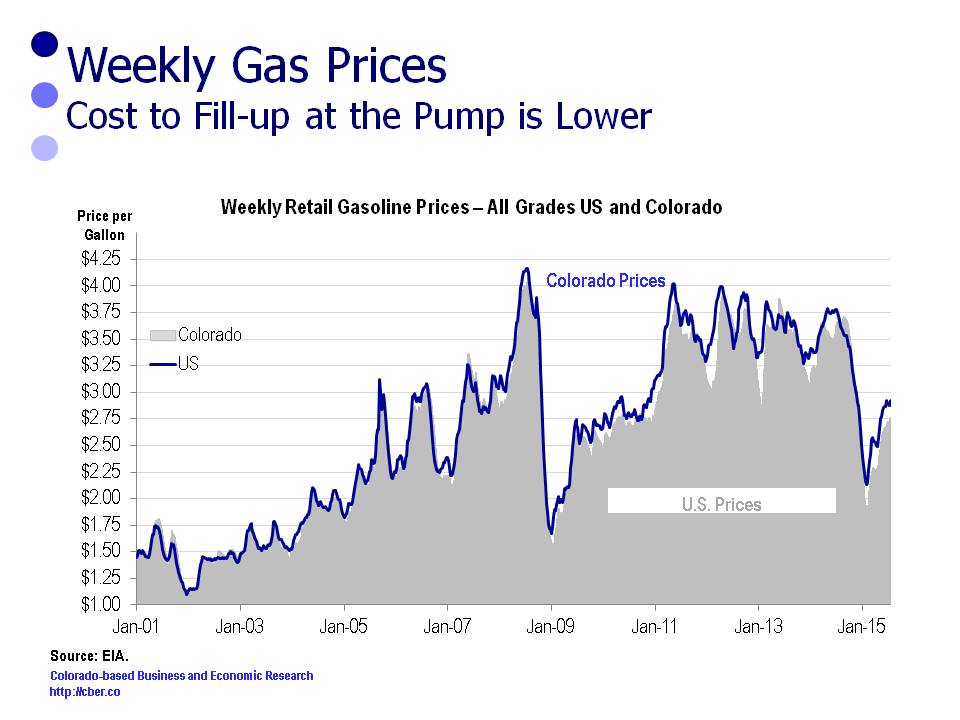
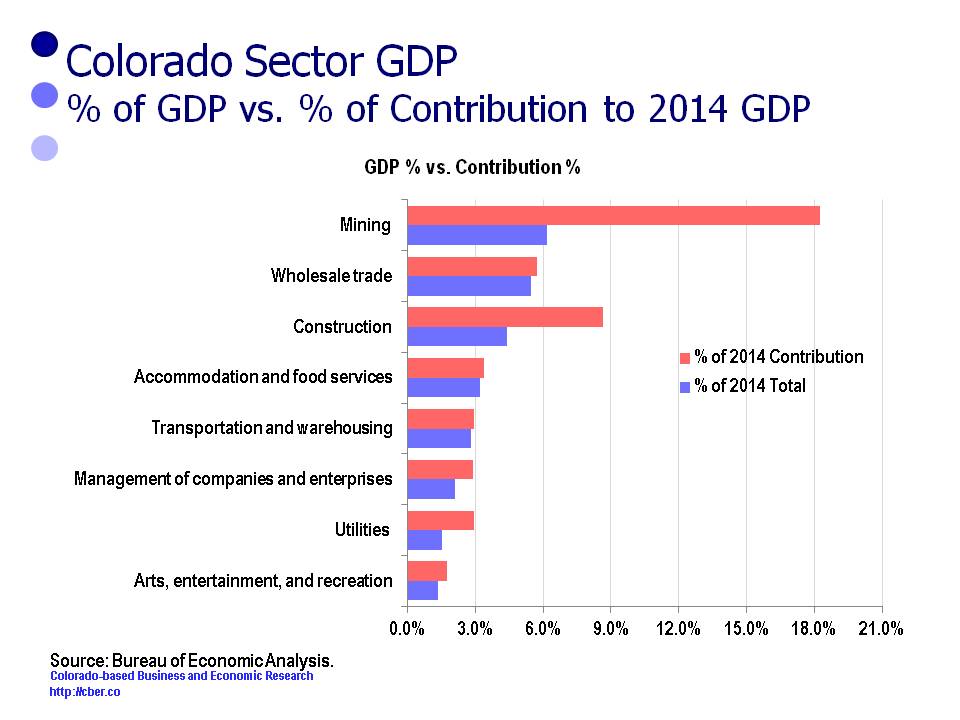
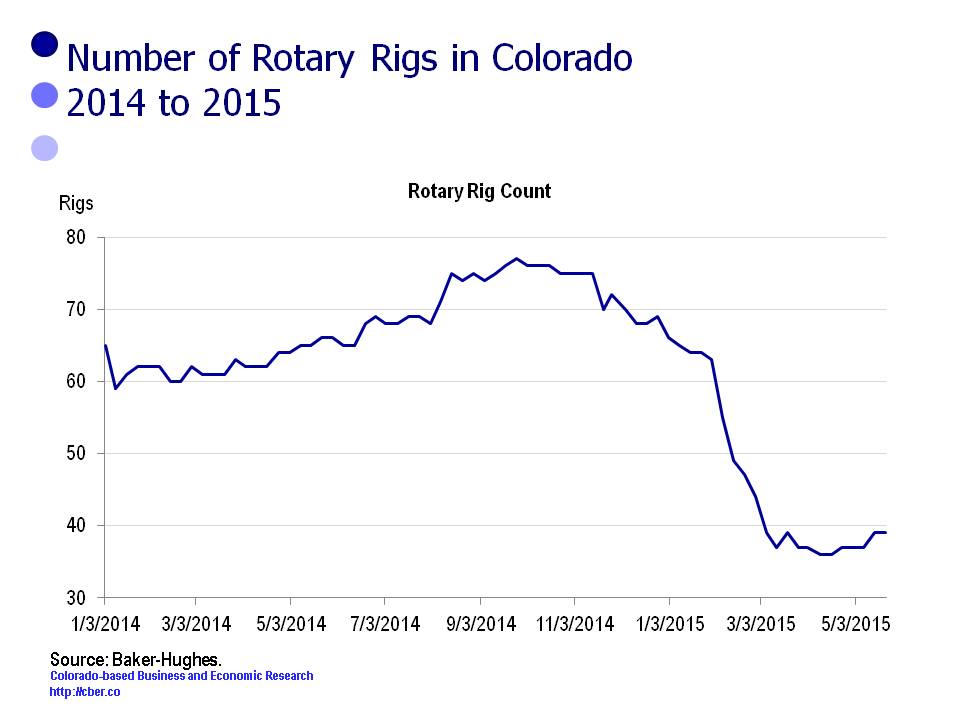
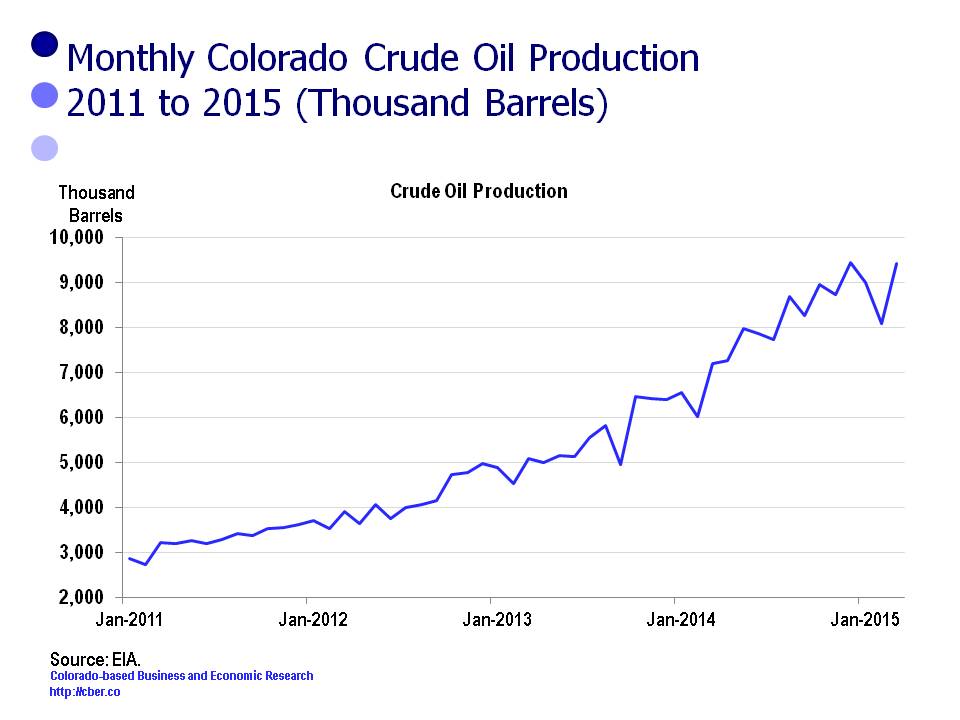
Earlier declines in the price of oil have not had the negative impact on the state that was initially expected by some economists. Colorado is a second tier state in terms of production and companies have taken numerous steps to increase their efficiency and maintain their profitability. Layoffs in the industry may be inevitable if the price for a barrel of oil remains at its current level, in the low $40s, for an extended period.

Through seven months average employment in the extractive industries is about 700 greater than last year. That number will approach zero by the end of the year.

The recent volatility in the equity markets may be the sign of a long-overdue correction or the start of a bear market. Uncertainty in the equities market may cause consumers to remain cautious.

On a more positive note, Colorado new car registrations have been strong this year. On a YTD basis, more new cars have been registered in 2015; however, the rate of growth has slowed to about 5.0% this year, down from 11.2% growth in 2013, and 6.5% growth last year.

Net migration remains strong as people find Colorado an attractive place to live, work, and play. In part that is a driving factor for the construction industry.

On a year-to-date basis the top sectors for job growth are:
• Healthcare 14,000
• Accommodations and Food Services 13,200
• Construction 12,100

Combined these three sectors account for about 59.6% of the jobs added or 39,300 workers. Average wages for many of the occupations in these industries are well-below the state average.

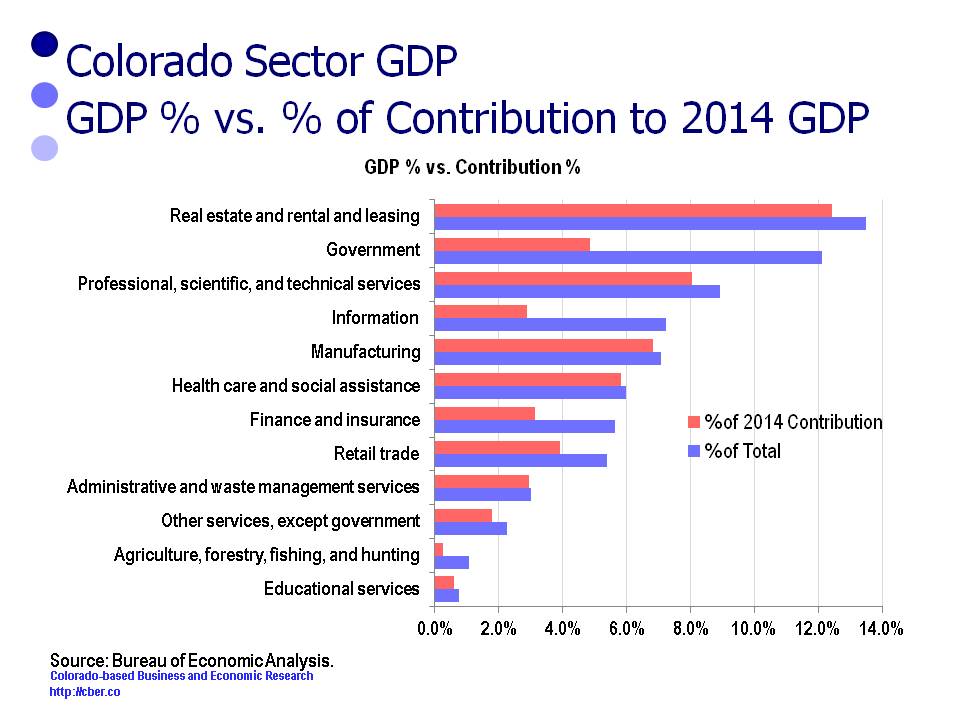
There are concerns that an insufficient number of primary jobs are being added in Colorado. Primary jobs are important because they bring in money from the outside that is invested in the state economy. In addition, primary employers often have a local supply chain that supports the local economy.

To that point, the average number of manufacturing jobs is 3,900 greater than a year ago. Many of these workers have been added in the renewable energy sector and its supply chain and they are located in Weld County. The addition of new jobs in this area will offset job losses associated with the decline in the price of oil.

So far this year, the major disappointment is the Information Sector. Declines are expected to continue through the end of the year.

On a year-to-date basis, the Government sector has added about 4,900 jobs. On a percentage basis, the greatest number of jobs has been added in K-12 and higher education. After seeing cutbacks for two years, the Federal Government is on track to add about 400 positions this year.

In addition to this data, CDLE will release a report later this month showing that Colorado job growth for the first quarter may be revised upward by 15,000 to 20,000. The bottom line is that Colorado’s employment is  much stronger than currently being reported.  Unequivocally, the sky Is not falling.

What Are the Real Challenges Facing the Extractive Industries?

The extractive industries have been a critical part of the Colorado economy for more than 150 years. The sector has been responsible for high-paying jobs in rural areas that have in turn stimulated growth in other sectors. In addition, the fuel, minerals, and metals have been utilized in ways that have improved our quality of life and made the United States a leader in innovation.

In 2014, the estimated value of the state’s extractive industries was projected to be $17.2 billion, broken down as follows:
• $7.0 billion – natural gas
• $6.7 billion – crude oil
• $2.2 billion – minerals
• $0.9 billion – coal
• $0.4 billion – carbon dioxide.

Despite its importance, the extractive industries have faced significant challenges.

“The Event”

For many years, the extractive industries were allowed to focus almost exclusively on extraction. Without regulation, pressure from industry members, or outside groups, insufficient attention has been paid to the impact of the extraction process.

This was evident when waste from Gold King Mine, near Silverton, recently spilled into Cement Creek. The plume of dirty, yellow water slowly made its way into the Animas River, which flows through Durango, Colorado and Farmington, New Mexico on its way to Lake Powell.

“The event” included a spill that contained a variety of pollutants and it was reported to be similar in volume to six Olympic- sized swimming pools. Within a week, the plume had passed through New Mexico. In Durango the pollutants either settled to the bottom of the river or the volume in the Animas River was great enough to dilute them or push them downstream. As a result, water tests indicated the concentration of pollutants had returned to acceptable pre-event levels – whatever that means.

The reaction to “the event” has been varied:
• Some think it is a disaster, catastrophe, and travesty.
• Initially, some were concerned because of the damage to the environment. As soon as the governor drank from the river, they rearranged their priorities and became concerned about the damage to local rafting companies and tourism businesses.
• Others have taken a wait and see attitude. They have asked, “What is the long-term damage?”
• There are a group of people who are focused on they blame game. They want to blame the mining industry, political parties, special interest groups, and government for “the event”. Others have gone so far as to speculate that “the event” was planned as a part of a conspiracy between the government and mining companies.
• From a historical perspective, “the event” is old news. For decades there have been pollutants in the Animas River as a result of runoff (Mother Nature) and leakage from mines. It wasn’t that long ago that the Smelter Mountain Mill, located in the south end of Durango, produced uranium for the Manhattan project.

Colorado Geological Survey

The website of the Colorado Geological Survey addresses the challenges they face in overseeing the industry.

“Prior to 1977 there were virtually no laws in the United States requiring that mines be reclaimed when mining was completed. Today the Colorado Division of Reclamation Mining and Safety is responsible for assuring that mined lands are restored under the Colorado Mined Land Reclamation Act and the Colorado Land Reclamation Act for the Extraction of Construction Materials. However, prior to those laws, when mining was completed, the companies just walked away leaving piles of waste and dug out holes. Thus, Colorado was left with an estimated 23,000 abandoned mine lands (AML).

Abandoned mines present very dangerous physical hazards to the public. High priority physical hazards identified by the Colorado Geological Survey for the USFS AML inventory are being jointly mitigated by the USFS and the Colorado Division of Reclamation, Mining, and Safety (DRMS). Mine workings are notorious for containing “bad air” including carbon monoxide, carbon dioxide, and hydrogen sulfide. These gases can kill unwary explorers of these old mines by asphyxiation. The old workings and structures can be very unstable and collapse without warning. Dangerous sites close to public access are being safeguarded through filling, capping, or gating the abandoned mine openings with engineered structures.”

Addressing the Challenges

Many in the state and the Four Corners areas will focus on the perspectives mentioned above.  The verbiage from  the Colorado Geological Survey shows this is not a simple problem, with a simple solution.

Colorado’s extractive industries are critical to the state’s economy and to the security and innovative leadership of the United States. Oil and coal are the backbone of the country’s transportation and utilities system. Rare and heavy metals are essential for the aerospace, biosciences, renewable energy, health care, transportation, defense, and environmental industries.

It is necessary for the country, including Colorado, to continue to drill for oil and gas and extract minerals and metals from the earth. Since 1977, government agencies and companies have been held to stricter standards for monitoring the impact of the extraction process. As has been recently demonstrated in Silverton, the efforts to monitor and manage pollutants are not perfect. The important point is that efforts are being made and they will be improved after “the event.”

With good fortune and sufficient funding, the state will remain diligent in its efforts to deal with the 23,000 abandoned mines.

Good luck to the local, state, and federal officials, agencies, companies, and special interest groups who will address the challenges facing the extractive industries in the years ahead.

Challenges Facing the Extractive Industries
The Animas River in Farmington, New Mexico as the plume of water from the Gold King Mine passed through town.

Economic Risks at the National Level That Might Affect Colorado

The U.S. economy is currently stronger than it was in 2014. The good news is the Colorado is outperforming the U.S. in three key areas:
• The Colorado rate of population growth in 2015 is projected to be 1.6% vs. 0.7% for the U.S.
• The Colorado rate of job growth in 2015 is currently projected to be 3.0% vs. 2.2% for the U.S.
• The recently released GDP data shows that Colorado outperformed the U.S. in the rate of growth, 4.7% vs. 2.2% in 2014.

Currently, the strengths of the national economy outnumber the economic risks. With that in mind this post reviews the manner in which the risks might impact the Colorado economy. For each risk the impact on Colorado is highlighted in italics.

The Economic Risks

The Fed – Janet Yellen indicated there are still issues with the labor market. These concerns include finding trained workers and weak wage growth.

Colorado’s low unemployment rate has caused companies to have difficulty finding trained workers in such industries as construction and the high tech sector. Areas of strong wage growth have occurred in occupations where there is high demand for workers.

Real GDP – The rate of growth in business investments is lackluster. Increased demand for goods and services will drive companies to invest in new equipment, software and buildings.

The decrease in the price of oil has caused Colorado companies in the Oil and Gas industry to curtail investments in their business.

The Dollar – The strong dollar has made U.S. goods/exports less competitive in foreign markets.

The strong dollar is one of many factors that could challenge Colorado exporters in 2015.economic risks

Industry Sentiment – Manufacturing may remain sluggish through the end of the year.

The growth of Colorado manufacturing output was disappointing in 2014. That is unlikely to change in 2015.

Housing – In some parts of the country the rate of housing price appreciation may be problematic.

It will be more difficult to find attainable and affordable housing as a result of the sharp increases in housing prices. These rising prices will cause the state’s rate of inflation to increase.

Price of Oil – Low oil prices have benefited consumers (lower prices at the pump) and some industries, but they have hurt the extractive industries.

Through the first half of the year, consumers have saved about $480 with lower gasoline prices. Currently, it is not possible to measure the impact of cheaper oil on the Oil and Gas industry.

International Situations – The current global situational and foreign policy challenges to the U.S. economy currently include Iran, Syria, China, Russia, Greece, Israel, Cuba, the EU, and Ukraine.

At the moment Colorado shares a level of risk similar to the U.S. as a result of situational and foreign policy challenges.

The strengths of the national economy have created momentum that will further strengthen the U.S. and Colorado moving into 2016; however, if several of these economic risks materialize at the same time, then the health of the U.S. and Colorado economies might be jeopardized.

Gas Prices – Lower Costs at the Pump

About a year ago, the price for a barrel of oil dropped like a rock. Consumers salivated because they knew lower gas prices were on the horizon. In the 2015 cber.co Colorado Economic Forecast it was projected that consumers would save an average of one dollar a gallon from lower prices at the pump, or a total of $780.

The following calculations were made to determine the difference in cost to purchase gasoline for the periods July to June (2013-14 and 2014-15). The annual cost assumes that a person fills a car with 15 gallons of gas per week, or 780 gallons per year.

The costs and the savings for the United States are listed below.
2013-14
• 780 gallons, average price per gallon $3.51
• Total cost = $2,774.69
2014-15
• 780 gallons, average price per gallon $2.88
• Total cost = $2,281.63
• The 2014-15 costs were $493.05 less than 2013-14.

gas prices

The costs and the savings for Colorado are listed below.
2013-14
• 780 gallons, average price per gallon $3.41
• Total cost = $2,692.02
• The costs in Colorado were $82.67 less than the U.S.
2014-15
• 780 gallons, average price per gallon $2.80
• Total cost = $2,213.51
• The costs in Colorado were $68.12 less than the U.S.
• The 2014-15 costs were $478.51 less than 2013-14.

Check back in six months to see if gas prices remained low and how much lower they were than last year.

Source: EIA.gov – All Formulations and All Grades.

Advanced Technology Cluster Contributes 17.8% to GDP Growth

In early June the Bureau of Economic Analysis released Gross Domestic Product at the state level for two-digit NAICS Codes.

Since 1997 Colorado Real GDP has grown at a faster rate than the Real GDP for the U.S. (Sum of States) in 11 of 17 years. The 2014 U.S. rate of growth was 2.2% compared to 4.7% for Colorado.

Since 1997 Colorado Real GDP has grown at a faster rate than the U.S. (Sum of States), 2.8% vs. 2.1%.

There were 12 sectors that lost share in 2014, i.e. their percent of contribution for these sectors was less than their percent of the 2014 total. Collectively, they accounted for 72.9% of the 2014 GDP and 53.5% of the change in the GDP. It was disappointing that the proxy for Colorado’s advanced technology cluster only contributed 17.8% to state’s GDP.

The following table shows the sectors, their percentage of the 2014 GDP and their contribution to the GDP.

Sector % of 2014 Total % of 2014 Contribution
Educational services 0.7% 0.6%
Agriculture, forestry, fishing, and hunting 1.1% 0.3%
Other services, except government 2.3% 1.8%
Administrative and waste management services 3.0% 2.9%
Retail trade 5.4% 3.9%
Finance and insurance 5.6% 3.1%
Health care and social assistance 6.0% 5.8%
Manufacturing 7.1% 6.8%
Information 7.2% 2.9%
Professional, scientific, and technical services 8.9% 8.1%
Government 12.1% 4.8%
Real estate and rental and leasing 13.5% 12.4%

There are concerns regarding the level of contribution for the five sectors that have the greatest share of the state’s GDP. The top sectors are:
• Real Estate 13.5%
• Government 12.1%
• Professional, scientific, and technical services, 8.9%
• Information 7.2%
• Manufacturing 7.1%
These five sectors accounted for 48.8% of the 2014 GDP; however they only contributed 35.0% of the 2014 GDP growth.

Of specific concern is the fact that PST, Information, and Manufacturing accounted for 23.2% of the state’s 2014 GDP, yet these 3 sectors only contributed 17.8% of the growth of the GDP. These three sectors are a proxy for the state’s advanced technology cluster, a cluster that is supposed to provide the state with a competitive advantage.

Despite these concerns, the level of Real GDP Growth in 2014 provided significant momentum for the Colorado economy moving into 2015.

GDP losing share - Advanced Technology Cluster

Mining Sector Largest Contributor to State’s GDP in 2014

In early June the Bureau of Economic Analysis released Gross Domestic Product at the state level for two-digit NAICS Codes.

Since 1997 Colorado Real GDP has grown at a faster rate than the Real GDP for the U.S. (Sum of States) in 11 of 17 years. The 2014 U.S. rate of growth was 2.2% compared to 4.7% for Colorado. The Mining Sector played a major role in Colorado’s higher rate of growth this past year.

Since 1997 Colorado Real GDP has grown at a faster rate than the U.S. (Sum of States), 2.8% vs. 2.1%.

There were 8 sectors that gained share in 2014, i.e., their percent of contribution to GDP was greater than their percent of the 2014 total GDP. Collectively, they accounted for 27.1% of the 2014 GDP and 46.5% of the change in the GDP.

The following table shows the sectors, their percentage of the 2014 GDP, and their contribution to the GDP.

Sector % of 2014 Total % of 2014 Contribution
Arts, entertainment, and recreation 1.3% 1.8%
Utilities 1.5% 3.0%
Management of companies and enterprises (MCE) 2.1% 2.9%
Transportation and warehousing 2.8% 2.9%
Accommodation and food services 3.2% 3.4%
Construction 4.4% 8.6%
Wholesale trade 5.5% 5.7%
Mining 6.2% 18.2%

Key points about the contribution of these sectors to GDP growth are listed below.
• The Mining Sector was the major driver in the growth of the state’s GDP, accounting for 18.2% of the change. Volatility in the price of a barrel of oil could potentially have a major impact on this sector’s level of contribution to the 2015 GDP.
• The contribution of the Construction Sector has been driven by a mix of sustained residential and nonresidential growth.
• The combination of the Arts, Entertainment, and Recreation and the Accommodation and Food Services sectors are commonly referred to as Tourism or Leisure and Hospitality. In 2014 the Tourism sector accounted for 4.5% of the GDP% and 5.2% of its growth. Tourism is an important part of the economy for each of the state’s 64 counties.
• The Utilities sector is small, but it experienced growth in 2014 because of strong overall employment and population growth. In addition, GDP growth increased because there was a significant gain in the number of business establishments in 2014.
• The increase in the MCE sector is a result of a 4.5% increase in the number of MCE establishments. In other words more businesses translated into greater GDP growth.
• Both the Wholesale Trade and the Transportation and Warehousing Sectors are small industries. In 2015 they experienced greater than usual gains in employment, which in turn meant stronger GDP growth.

With 4.7% Real GDP growth in 2014, the state economy had significant momentum moving into 2015. Through the first six months of the year, the state has capitalized on that momentum.

gdp gaining share - mining sector

The Impact of the Decline in the Price of Oil on Colorado

The recent release of BLS wage and salary employment data for Colorado showed that after four months the state is on track to add 71,400 workers. This is slightly below the cber.co forecast range of 73,000 to 79,000.

The softness in job growth may be attributed to the decrease in the price of oil, which bottomed out at $43 per barrel on March 17. A prominent Boulder economist has stated that average annual state employment for the year would fall to 40,000 because of the decline in oil prices. So far, the impact has been minimal.

In April there were 34,400 jobs (NSA) in the Mining and Logging Sector, which includes the mining and oil and gas industries. This is down about 1,300 jobs from December but about 1,800 jobs above the April 2014 total. The sector had record employment this past December.

Some of the factors that have affected demand are:
• Over time global demand for oil has declined, in part because of increased energy efficiency and an increase in the number of alternate sources. That decrease is expected to continue in the future.
• The number of Colorado rigs in operation has dropped sharply in the past six months.

price of oil
• Oil production in Colorado reached a record high in 2014. Despite the decline in oil prices, monthly production has remained near record levels; however, at some point reduced production is expected if prices remain suppressed for an extended period.

crude oil production
• Nationally, Colorado is a second-tier state for production; however, the oil and gas industry is a significant contributor to the state’s Gross Domestic Product. Today, the U.S. is producing about 80% of the oil used domestically, a significant change from five years ago. This means that Colorado producers will continue to drill, although production may be at lower levels.
• The price per barrel and the breakeven point are less critical than they were five years ago. Producers have become more efficient by reducing overhead and adopting improved technology such as super-fracking. In addition they have capped wells that are older or less efficient. Through increased efficiencies, companies have been able to lower the break-even point for many of their plays and adjust to lower prices per barrel.
• Since March 17th, the price per barrel has risen and reached $60 per barrel in early May. The consensus is that it will remain around that level for the remainder of the year.

These factors will have the following implications on the state:
• Colorado has a diverse energy industry. It is a strong second tier oil and gas state, it has companies that manufacturer solar and wind energy equipment, and significant energy research is conducted locally. Because energy is critical to the security of the U.S., the state will benefit from having a balanced energy portfolio.
• The reduction in the number of rigs will result in a fewer workers in the industry and its supply chain.
• Because production has remained at a high level, the industry’s contribution to the state GDP may not be as adversely impacted as originally thought.
• Oil and gas companies are evolving in a manner similar to manufacturing and other industries – they are becoming much more efficient. Increased efficiencies are expected to continue and many of the jobs that are being eliminated will not return.

Increased efficiencies will allow American companies to continue to be competitive, which in turn will help the U.S. be an “energy independent” nation. In a convoluted way, the Colorado oil and gas industry may actually benefit in the long run from the recent drop in the price of oil.

Colorado Job Growth Continues to be Solid in April

BLS recently released April wage and salary employment data for Colorado. The job growth is softer than expected given the strength of the U.S. jobs numbers, projected improvement in the growth of the economy (GDP), and the outlook of purchasing managers as measured by the ISM manufacturing and non-manufacturing indices. Given the strength of the U.S. employment data, it seems reasonable for the state to be ahead of last year by 70,000 to 75,000 jobs, even with the slight decreases in the state oil and gas industry.

job growth

In April there were 34,400 jobs (NSA) in the Mining and Logging Sector. This is down about 1,300 jobs from December, 2014 but about 1,800 jobs above the April 2014 total. The sector had record employment this past December.

Looking beyond the oil and gas industries we see that about two-thirds of the job growth this year has been in Health Care; Accommodations and Food Services; Construction; Professional, Scientific, and Technical Services (PST); and Manufacturing.

Approximately 21% of all jobs added were in Leisure and Hospitality. The tourism industry is important to all 64 counties in the state. Colorado had a strong ski season and is poised to have a strong summer season.

About 10% of total jobs added were in the PST, Manufacturing, and Information sectors. These sectors are the source of primary and advanced technology jobs. Primary jobs attract wealth from outside the state that is spent locally, they export a significant portion of their goods and services, and they often pay wages that are much greater than the state average.

Probably the hottest topic on the economic front has been the price of housing and rentals. The Case Shiller Home Price Index for Denver indicates that home prices increased by 10.0% over the past year and 1.4% on a month-over-month basis. Rentals have risen at slightly lower rates.

The comparative strength of the Colorado economy over the past five years has caused labor shortages in key occupations, i.e. it is necessary to attract talent from outside Colorado. Out-of -state workers from some parts of the country will experience sticker shock when they look at home prices in the metro area.

On a positive note, increased appreciation in home prices increases the “paper wealth” of individuals. This will cause home owners and landlords to remain confident in the economy and willing to spend money. The increase in prices, and ultimately property taxes, is a two-edged sword. Property owners don’t like the increase, but schools and local governments will see an increase in funding.

At the moment the increase in housing prices does not appear to have deterred job growth. Stay tuned – that may change! It will continue to be an interesting year for the Colorado economy.

Industry Codes with Leading Output per Employee for Colorado

The following list identifies the leading output per employee categories for Colorado. The list has been extracted from an IMPLAN database, www.implan.com. This database divides output and employment into 440 categories.

IMPLAN is an economic analysis tool that uses input-output analysis in combination with regional specific Social Accounting Matrices and Multiplier Models.

Total output for the model is $488,356,072,817 and employment is 3,235,493. Overall output per employee is $150,937.

There were at least 1,000 workers for each of the top 35 categories. A minimum of 1,000 workers was set because many small categories have a high output per employee that may not be sustainable if they were larger. Characteristics of this group of companies are:
• The range of output per worker is $322,539 to $3,206,588.
• Average output per employee is $562,606.
• Total employment is 190,042. This is 5.9% of the state total.
• Total output was $106,918,935,715. This is 21.9% of the state total.
Most of these categories include companies that provide primary jobs. They are mostly manufacturing or advance technology companies.

There were 132 categories with average output per employee greater than $322,539. Each of these categories had fewer than 1,000 workers.
• Total employment is 34,786. This is 1.1% of the state total.
• Total output was $47,425,590,085. This is 9.7% of the state total.
• Average output per employee is $1,363,337.20.
As was the case with the above category, most of these categories include companies that provide primary jobs.

Finally, there were 238 categories with average output per employee less than $322,539.
• Total employment is 3,010,664. This is 93.0% of the state total.
• Total output is $334,011,547,017. This is 68.4% of the state total.
• Average output per employee is $110,943.
This group provides a wide variety of companies and industries. Many of the categories with lower output per employee are retail operations or personal or business services. They are important to society for a variety of reasons, but they are drivers of the economy.

There were 35 categories with no employment or output.

Industry Codes with Leading Output per Employee for Colorado

Rank IndustryCode Description Employment Output/Employee % of State Average
1 366 Lessors of nonfinancial intangible assets 1,664 $3,206,588 2,124%
2 234 Electronic computer manufacturing 1,189 $1,485,686 984%
3 55 Fluid milk and butter manufacturing 1,157 $1,430,300 948%
4 32 Natural gas distribution 1,099 $1,363,518 903%
5 133 Pharmaceutical preparation manufacturing 2,156 $1,347,071 892%
6 235 Computer storage device manufacturing 2,049 $1,174,215 778%
7 170 Iron and steel mills and ferroalloy manufacturing 1,518 $1,144,157 758%
8 243 Semiconductor and related device manufacturing 3,176 $1,078,421 714%
9 71 Breweries 3,651 $1,048,101 694%
10 225 Other engine equipment manufacturing 1,673 $920,406 610%
11 31 Electric power generation, transmission, and distribution 6,651 $802,901 532%
12 349 Cable and other subscription programming 3,596 $791,950 525%
13 28 Drilling oil and gas wells 2,823 $768,501 509%
14 70 Soft drink and ice manufacturing 1,956 $736,120 488%
15 190 Metal can, box, and other metal container (light gauge) manufacturing 1,052 $680,582 451%
16 351 Telecommunications 30,489 $670,023 444%
17 24 Mining gold, silver, and other metal ore 2,377 $585,851 388%
18 236 Computer terminals and other computer peripheral equipment manufacturing 1,769 $541,175 359%
19 345 Software publishers 14,165 $496,019 329%
20 283 Motor vehicle parts manufacturing 1,098 $483,561 320%
21 249 Search, detection, and navigation instruments manufacturing 2,520 $481,246 319%
22 248 Electromedical and electrotherapeutic apparatus manufacturing 3,307 $460,979 305%
23 222 Turbine and turbine generator set units manufacturing 1,214 $437,374 290%
24 333 Transport by rail 2,877 $432,021 286%
25 253 Electricity and signal testing instruments manufacturing 1,364 $429,077 284%
26 287 Guided missile and space vehicle manufacturing 6,128 $426,830 283%
27 158 Glass container manufacturing 465 $405,217 268%
28 254 Analytical laboratory instrument manufacturing 1,109 $388,003 257%
29 354 Monetary authorities and depository credit intermediation activities 31,465 $368,257 244%
30 10 All other crop farming 4,425 $361,804 240%
31 251 Industrial process variable instruments manufacturing 1,094 $347,713 230%
32 20 Extraction of oil and natural gas 34,047 $331,039 219%
33 352 Data processing, hosting, ISP, web search portals and related services 8,766 $328,557 218%
34 343 Book publishers 1,133 $325,470 216%
35 305 Surgical and medical instrument, laboratory and medical instrument manufacturing 4,819 $322,539 214%
Other 3,045,450 $125,248 83%
Total 3,235,493 $150,397

The Economic Impact of the Colorado Retail Trade Industry

This post highlights the economic impact of the Colorado retail trade industry on the economies of Colorado and its twelve major metro counties: Adams, Arapahoe, Boulder, Broomfield, Denver, Douglas, El Paso, Jefferson, Larimer, Mesa, Pueblo, and Weld. It was prepared for the Economic Development Council of Colorado in the Spring of 2015.

Retail Trade is classified in the NAICS 44-45 category. The Retail Trade categories used in this report and their IMPLAN sector numbers are listed below. As can be seen Retail Trade includes everybody from American Furniture Warehouse to Burritos to Go in Broomfield.

320 Retail Stores – Motor vehicle and parts
321 Retail Stores – Furniture and home furnishings
322 Retail Stores – Electronics and appliances
323 Retail Stores – Building material and garden supply
324 Retail Stores – Food and beverage
325 Retail Stores – Health and personal care
326 Retail Stores – Gasoline stations
327 Retail Stores – Clothing and clothing accessories
328 Retail Stores – Sporting goods, hobby, book and music
329 Retail Stores – General merchandise
330 Retail Stores – Miscellaneous
331 Retail Nonstores – Direct and electronic sales

economic impact of the colorado retail trade industry

The key employment findings of the report are:
• There are 309,924 direct employees in the industry, including sole proprietors. This is 9.6% of total state employment.
• Overall, there are 439,315 total (direct, indirect, and induced) employees supported by the Colorado Retail Trade Industry.
• The counties with the greatest number of Direct Retail Trade employees are El Paso, Arapahoe, Denver, and Jefferson.

The key output findings of the report are:
• Average GRP per employee for Colorado is $90,658. Average Retail Direct GRP per employee is $68,404.
• The Retail Trade Sector contributes about $21.2 billion, or 7.2%, to the Direct Colorado GRP, $293 billion.
• Overall, the Retail Trade Sector supports $38.3 billion in GRP, or economic activity.
• The counties with the greatest Direct Retail Output are Arapahoe, El Paso, and Denver.
• The counties with the greatest Direct GRP per Direct Employee are Denver, Arapahoe, Boulder.

The key wage findings of the report are:
• The total direct wages are $10.1 billion, or 5.6% of total wages. Average Direct Retail Wages are lower than the average for all industries.
• Overall, the retail trade industry supports total wages of $16.6 billion.
• The counties with the highest average annual wages for Direct Retail are Denver, Arapahoe, and Jefferson.

Other key points follow:
• The Retail Trade Sector is a major employer in Colorado.
• The Bureau of Labor Statistics reports that Colorado has 175,355 establishments. There are 17,035 establishments in the Retail Trade Sector. This is 9.7% of total employment.
• Average wages and output are below the average for other industries.
• It is difficult for states to develop a competency in the Retail Trade sector even though many states and municipalities rely on retail sales taxes to fund their operations. The Colorado Retail Trade Sector has a location quotient slightly less than 1.0.

For a copy of the report click here.