2021 Colorado Economic Forecast

The following forecast is from the 2021 cber.co Economic Forecast for the United States and Colorado.

Colorado’s real GDP growth rate for 2021 will be slightly higher than the U.S. rate It will return to its pre-pandemic value in late 2021.

Colorado employment posted declines in Q4 2020. The negative trend will continue in Q1 2021. Employment will return to its 2019 level in 2022.

Colorado’s unemployment rate will be greater than most states because unemployment claims will remain high.

Retail sales will rebound in 2021 as a result of pent-up demand. Sales will level off at pre-pandemic levels in 2022.

In 2021 and 2022, inflation will be slightly higher than the U.S. rate.

This image has an empty alt attribute; its file name is image-1.png

The number of passengers through DIA in 2020 was about half of the 2019 total. Domestic flights will return to their 2019 level in 2023. International flights will return to their pre-pandemic level in 2024.

There was an increase in the number of building permits issued in 2020. There will be more permits in 2021 as the population increases. Also, there is a need for affordable housing in the metro areas.

State regulations and reduced demand caused a decline in oil production in 2020. The production of oil will be flat in 2021 and 2022.

cber.co Colorado Economic Forecast – Diverse Growth

The primary focus of most state economic forecasts is to project total state employment.

Over the years cber.co has worked on various Colorado economic forecasts – some were multi-year projections, others were one-year annual totals, and some projected sector totals that were added to derive the state total. The latter approach introduced numerous variables for error.

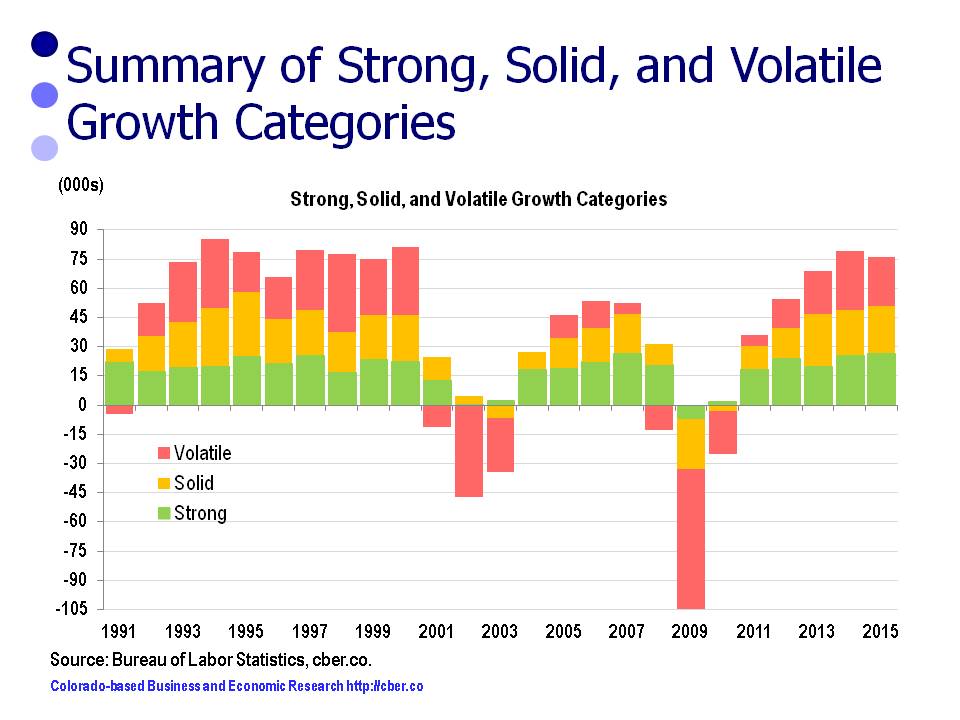
cber.co feels the most accurate forecast is achieved by projecting total employment based on projections for three categories of sectors. Sectors are grouped into three categories based on their past performance.

Projections for the categories and overall employment are based on trends, feedback from business leaders, economic developers, and other economists. The sum of these categories is then used to estimate overall total employment.

Minor adjustments are made and final forecasts are produced for three scenarios. The most likely scenario is used as the final cber.co forecast. This final step helps create a better understanding of upside and downside risk associated with the forecast.

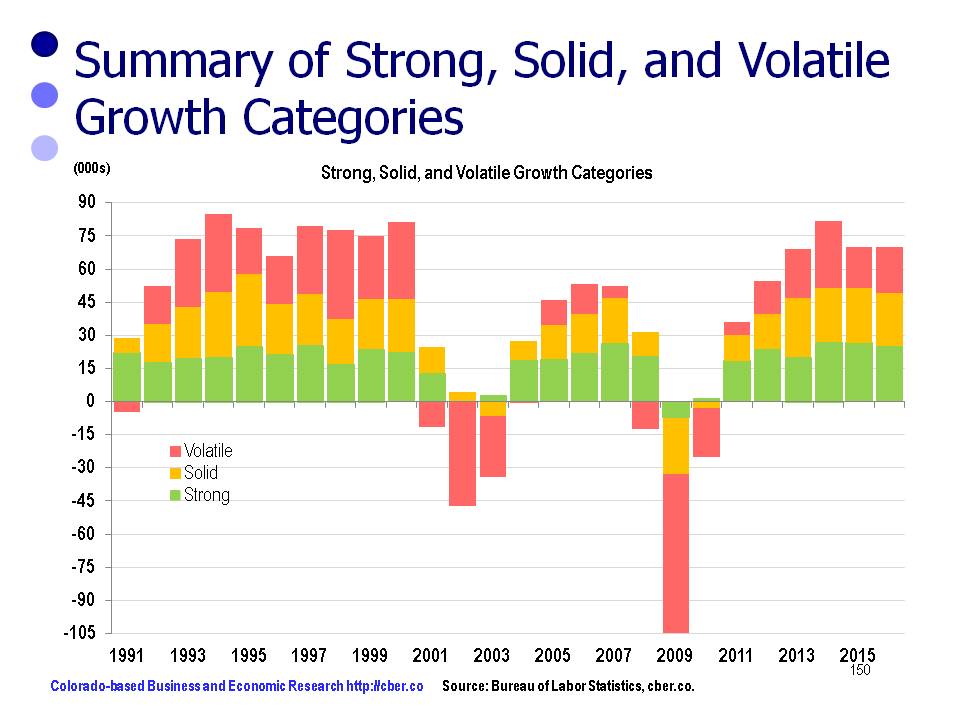
This portfolio approach has made it easy to see that some sectors consistently create jobs at a higher rate of growth, some show solid growth, and others are more volatile. Ultimately, the volatile category tends to have a greater influence on the change in total job growth than the sectors with steady growth.

The most difficult challenge in producing the 2016 forecast was to estimate the 2015 data. The methodology used by BLS to produce the preliminary nonfarm data was flawed. Having said that, the growth of the Strong, Solid, and Volatile Growth Categories will be similar to 2015; however, the total will be slightly less.

The Strong Growth Category of sectors (green) has performed consistently over time. The category added jobs as expected in 2015. Sectors in this category include:
• Professional, Scientific, and Technical Services
• Management of Companies and Enterprises
• Administrative – Business to Business (Not Employment Services)
• Private Education
• Health Care
• Arts, Entertainment, and Recreation
• Other Services.

Recent and projected employment changes for the Strong Growth Category follow:
• 2012 24,000
• 2013 20,100
• 2014 26,900
• 2015 26,700
• 2016 24,000 to 26,000
The 2016 projected rate of growth will be 2.9% to 3.2%, similar to the last two years.

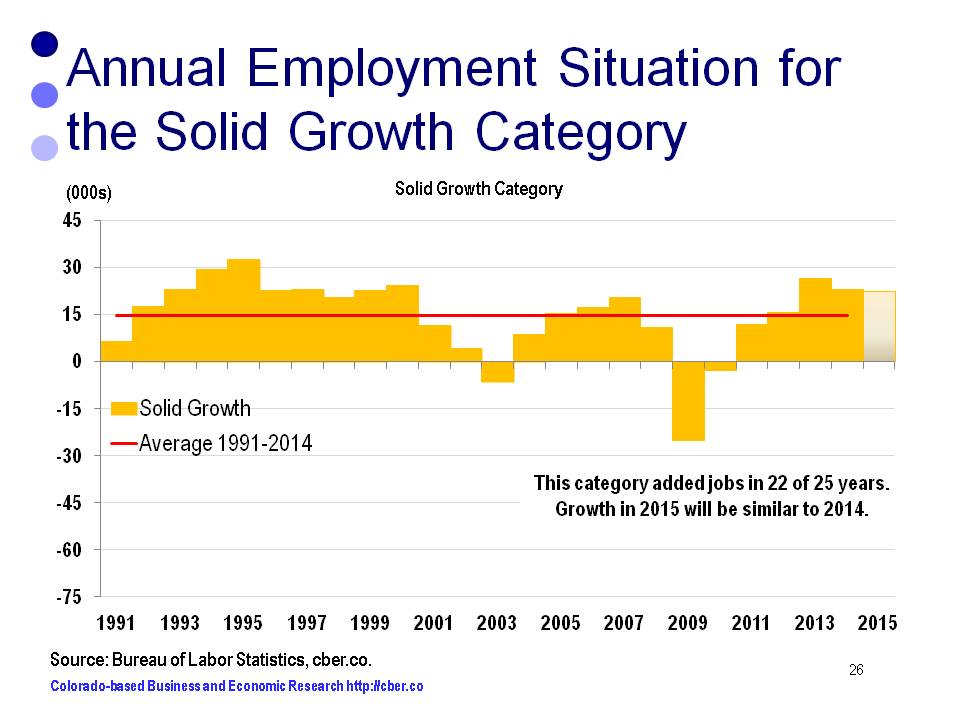
Over time, the Solid Growth Category of sectors (yellow) has been more volatile than the Strong Growth Category and it has grown at a slower pace. In 2015, this category performed as expected. Sectors in this category include:
• Wholesale Trade
• Retail Trade
• State (Not Higher Education)
• Higher Education
• Local (Not K-12 Education)
• K-12 Education
• Accommodations and Food Services

Recent and projected employment changes for the Solid Growth Category follow:
• 2012 15,600
• 2013 26,600
• 2014 24,500
• 2015 24,700
• 2016 23,000 to 25,000
The 2016 projected rate of growth will be 2.3% to 2.5%, similar to the past two years.

Finally, the Volatile Category of sectors (red) was a significant source of growth in 2013 and 2014, but the number of jobs added in 2015 fell off significantly. Sectors in this category include:
• Natural Resources and Mining
• Construction
• Manufacturing
• Transportation, Warehousing, and Utilities
• Employment Services
• Financial Activities
• Information
• Federal Government

Recent and projected employment changes for the Volatile Category follow:
• 2012 15,100
• 2013 22,300
• 2014 30,400
• 2015 21,000
• 2016 20,000 to 22,000.
The 2016 projected rate of growth will be 2.7% to 3.0%, similar to 2015.

The 2016 cber.co Colorado economic forecast portends the state will add 67,000 to 73,000 workers and job growth will be 2.7% to 2.9%.

For additional information about the 2016 cber.co Colorado Economic Forecast click here.
Colorado Economic Forecast

cber.co 2016 Colorado Economic Forecast – Solid Growth

Last week, cber.co released its Colorado economic forecast for 2016. As is the case with most forecasts, the primary focus of the Colorado forecast is employment. As economic developers say, “it all starts with a job.”

Each year the forecast provides an optimistic, pessimistic, and most likely scenario.

The 2016 optimistic scenario calls for:
• U.S. Real GDP growth will be greater than 2.6%.
• Colorado will add more than 73,000 workers, the rate of job growth will be greater than 2.9%.

The projected likelihood of this scenario is 18%. The Colorado economy has experienced solid job growth since 2012; however, given the slowdown in the global economy and the lower price of oil, it is unlikely the state will experience accelerated growth.

The pessimistic scenario calls for:
• U.S. Real GDP growth will be less than 2.3%.
• Less that 67,000 Colorado workers. Job growth will be less than 2.7%.
The projected likelihood of this scenario is 22%. While the global and U.S. economies are expected to see slight growth in output, the Colorado economy could be derailed if the price of oil stays low and the global economy slows further.

The most likely scenario calls for:
• U.S. Real GDP will be 2.3% to 2.7%.
• The U.S. will add at least 2.7 million workers.
• Colorado will add 1.8% of total U.S. jobs added.
• Colorado will add 67,000 to 73,000 workers, job growth will be 2.7% to 2.9%.

Despite downside risks there is a 55% likelihood this forecast will occur. Since 2012 growth has been steady and broad-based. Much of the growth has been in sectors such as tourism, which have an indirect link to the extractive industries.

The bottom line – look for continued job growth in Colorado, but at a slower rate than 2015.

For additional information about the 2016 cber.co Colorado Economic Forecast click here.

colorado economic forecast

2015 cber.co Forecast – Fine Tuning Solid Growth Category

In preparing its annual forecast, cber.co divides the NAICS sectors into three categories. This portfolio approach makes it easy to see that some sectors consistently create jobs at a higher rate of growth, some show solid growth, and others are more volatile. Ultimately, the volatile category tends to have a greater influence on the magnitude of change in total job growth than the sectors with steady growth.
In March 2015 BLS released its benchmark revision of the 2014 data. The changes were more significant than usual.

As a result cber.co fine-tuned the 2015 employment forecast to have a better understanding of categories and sectors that were driving the economy. This brief discussion highlights the revisions to the 2015 cber.co forecast. This post will evaluate the Solid Growth Category.

The Solid Growth Category

Over the past two decades the following sectors generally posted gains. The category posted stronger jobs gains during the 1990s than the 2000s.
• Wholesale Trade
• Retail Trade
• State (Not Higher Education)
• Higher Education
• Local (Not K-12 Education)
• K-12 Education
• Accommodations and Food Services

Total employment for this category was:
1994  685,400 workers, 39.0% of total employment
2004  848,000 workers, 38.9% of total employment
2014  961,100 workers, 39.0% of total employment.

2015 cber.co forecast

Estimated Job Growth

As can be seen below there is a significant difference between the original estimates for 2014 (January 11) and Benchmark revisions for 2014 (March 27).

The original Solid Growth Category estimates/forecast (January 11 Forecast) was + 20,000 to 24,000 Employees.

• 27,600 jobs added in 2013
• 25,200 jobs added in 2014
• 964,000 employees in 2014
• In 2015, between 22,000 and 28,000 workers will be added at a rate of 2.6% to 2.8%. The rate of growth is similar to 2014.

The updated Solid Growth Category estimates/ forecasts, after benchmark revisions (March 27 Forecast) was+ 22,500 to 26,500 Employees.

• 26,700 jobs added in 2013
• 23,300 jobs added in 2014
• 961,100 employees in 2014
• In 2015, between 22,500 and 26,500 workers will be added at a rate of 2.3% to 2.8%

BLS overestimated the growth of jobs in the Solid Growth Category.
As a result changes were made to the 2015 category and total employment projections.

In 2015, the rate of growth will be 2.3% to 2.8%. This rate of growth is similar to 2014 and most years during the 1990s.

The recalibration of the 2015 forecast resulted in the following changes:
• The Strong Growth Category was revised upward by 4,500.
• The Solid Growth Category was revised downward by 1,500.
• The Volatile Category remained unchanged.
• The net change to the 2015 forecast was an upward revision of 3,000; however, the 2015 forecast is for total growth slightly below the 2014 total.

The change in the mix of jobs being added is equally as important as the change in the number of jobs being added.

For further information on the cber.co forecasts click here.

2015 cber.co forecast

cber.co 2015 Colorado Economic Forecast by Category

The primary focus of most state economic forecasts is to project total state employment.

Some economists also produce sector forecasts. They usually add projections for the sectors to derive the state total, an approach that introduces numerous variables for error.

cber.co feels the most accurate forecast is achieved by projecting total employment based on projections for categories of sectors. Sectors are grouped into three categories based on their past performance.

Projections for the categories and overall employment are based on trends, feedback from business leaders, economic developers, and other economists. The sum of these categories is then compared to the projections for overall total employment.

Minor adjustments are made and the final forecast is produced for three scenarios. The most likely scenario is used as the final cber.co forecast. This final step helps create a better understanding of upside and downside risk associated with the forecast.

This portfolio approach has made it easy to see that some sectors consistently create jobs at a higher rate of growth, some show solid growth, and others are more volatile. Ultimately, the volatile category tends to have a greater influence on the amount of change in total job growth than the sectors with steady growth.

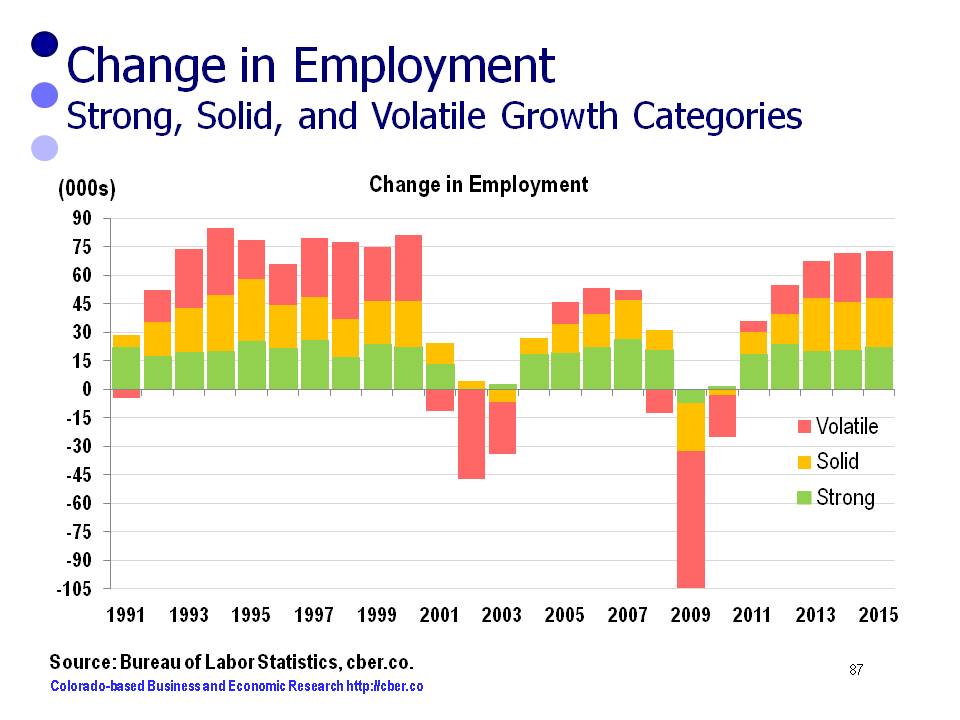
In 2015, the growth of the Strong, Solid, and Volatile Growth Categories will be similar to 2014.

The Strong Growth Category of sectors (green) has performed consistently over time. The category added jobs as expected in 2014. The larger sectors (Health Care, PST, and B-to-B, excluding Temp. Services) grew at a rate faster than the state. Arts, Entertainment, and Recreation, a smaller sector, grew faster than the state.

Recent and projected employment changes for the Strong Growth Category follow:
• 2012 24,000
• 2013 20,000
• 2014 20,900
• 2015 20,000 to 24,000

Over time, the Solid Growth Category of sectors (yellow) has been more volatile than the Strong Growth Category. In 2014, this category performed stronger than anticipated. AFS and K-12 Education expanded at a faster rate than the state.

Recent and projected employment changes for the Solid Growth Category follow:
• 2012 15,600
• 2013 27,600
• 2014 25,200
• 2015 24,000 to 28,000

Finally, the Volatile Category of sectors (red) was a significant source of growth in 2013 and 2014. In 2014 the Construction, Employment Services, Transportation and Warehousing, and the Extractive Industry sectors expanded at a faster rate than the overall state average.

Recent and projected employment changes for the Volatile Category follow:
• 2012 15,100
• 2013 19,800
• 2014 25,600
• 2015 23,000 to 27,000.

In 2015, overall state employment will increase by 2.8% to 3.0% or 70,000 to 76,000 jobs. Average Colorado employment will be 2,525,600 for 2015.

For additional information about the 2015 cber.co Colorado Economic Forecast click here.

Colorado Economic Forecast

Colorado Employment to Continue at Steady Pace in 2015

Later this week, cber.co will release its Colorado economic forecast for 2015. The primary focus of the Colorado forecast is employment within the state. As economic developers say, “it all starts with a job.”

Each year the forecast provides an optimistic, pessimistic, and most likely scenario.

The 2015 optimistic scenario calls for:
• U.S. Real GDP growth will be greater than 2.9%.
• Colorado will add more than 76,000 workers.

The projected likelihood of this scenario is 15%. The Colorado economy has experienced solid job growth since 2012; however, there is nothing to believe that it will experience growth at a significantly greater rate during 2015.

The pessimistic scenario calls for:
• U.S. Real GDP growth will be less than 2.5%.
• Less that 70,000 Colorado workers.

Unfortunately, there is more downside risk to the forecast than upside risk. The projected likelihood of this scenario is 30%. While the global and U.S. economies are expected to see slight growth in output, the Colorado economy could be derailed if the price of oil remains below $65 per barrel (the estimated breakeven point for the Niobrara Oil field) for an extended period.

The most likely scenario calls for:
• U.S. Real GDP will be 2.5% to 2.9%.
• The U.S. will add at least 2.6 million workers.
• Colorado will add 3.0% of total U.S. jobs added.
• Colorado will add 70,000 to 76,000 workers, job growth will be 2.8% to 3.0%.

Despite downside risks associated with lower prices for oil and reduction production in Colorado there is a 55% likelihood this forecast will occur. Since 2012 growth has been steady and broad-based. Much of the growth has been in sectors such as tourism, which have an indirect link to the extractive industries.

Average Colorado employment will be 2,525,600 for 2015.

For additional information about the 2015 cber.co Colorado Economic Forecast click here.
cber.co Colorado Economic Forecast for 2014 – 68,000 to 74,000 Jobs to be Added

In 2013 the state experienced natural disasters and self-inflicted political wounds, yet Colorado employment grew at a faster than expected rate. The cber.co economic forecast points to continued expansion  for 2014.

On a Positive Note…

  • The state population grew at a higher rate than expected in 2013. Stronger growth is on tap for 2014.
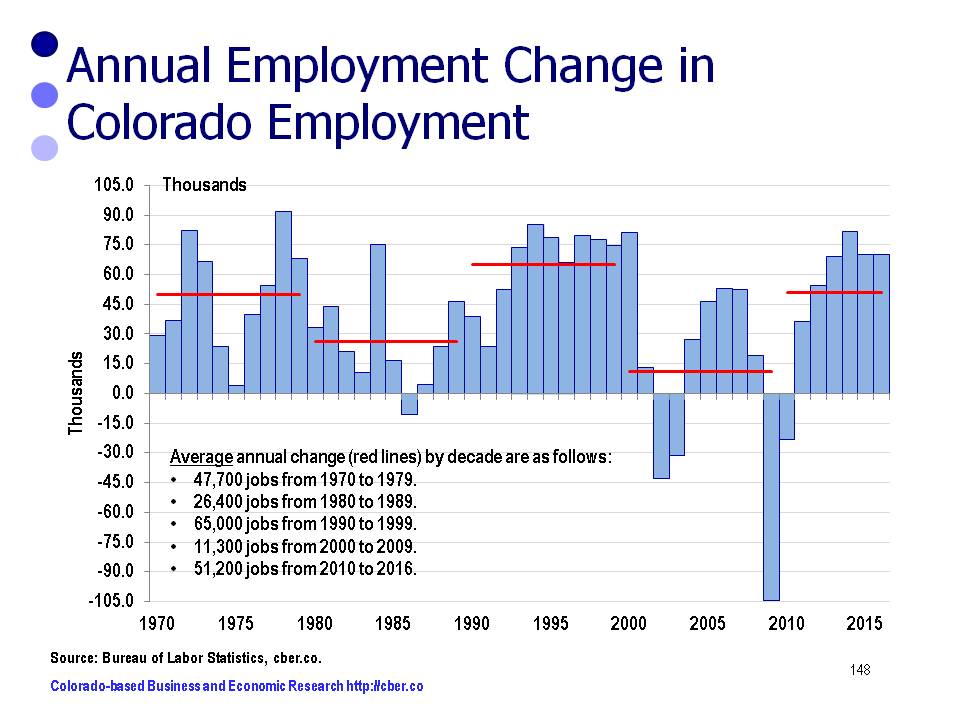
  • The story is the same for employment. In 2013, the state added approximately 68,000 workers and will add another 68,000 to 74,000 in 2014. This represents job growth in the rage of 2.9% to 3.1%.
  • Unemployment will continue to decline, and will be in the range of 5.5% to 5.8% at the end of 2014.
  • In 2013 consumers were delighted that gasoline prices declined. At the moment there is no reason to believe they will rise precipitously (knock on wood).
  • Colorado new car registrations have risen steadily for the period 2010 to 2013. A decline is unlikely in 2014.
  • Colorado’s general fund, particularly sales and income taxes, has been a benefactor of increased population, employment, and wages. Likewise the revenue for city and county governments has improved.

Some Mixed News…

  • Per Capita Personal Income will increase by 3.7% in 2014.  This is slightly less than the rate of growth for the U.S. Over the past two decades the gap between the U.S. PCPI and the state PCPI has closed significantly.
  • In 2014, Colorado inflation will be 3.0%, well above the rate for the U.S.
  • In Colorado, housing prices have increased at a faster rate than the nation. That is great news for home owners, but not so good news for people wanting to enter the housing market.
  • The Construction Sector is slowly improving.  Increased building activity supports growth in multiple sectors and causes greater congestion on the highways. For some, the latter is not desirable.
  • Although the state returned to 2008 peak employment, it will be a long time before the state returns to the 2007 peak number of establishments.

Looking ahead, the economy will build on the foundation established in 2013. Hopefully the state’s leadership will be less dysfunctional.

Click here to review the cber.co forecast and other economic reports.

cber.co forecast

©Copyright 2011 by CBER.

Colorado Legislative Council and OSPB Optimistic About 2014

On September 20th, both the Colorado Legislative Council (CLC) and the Governor’s Office of State Planning and Budgeting (OSPB) released their quarterly economic updates. Their preliminary look at 2014 is positive.

Highlights from the CLC outlook for 2014 are:
• The unemployment rate will drop to 6.9%.
• 55,400 wage and salary jobs will be added.
• Retail trade sales will increase by 5.4%.
• 35,400 home building permits will be issued.
• Inflation will increase by 3.2%.
In summary, CLC feels the state will continue to add jobs at a similar rate to 2013, but unemployment will not decline substantially. Retail trade sales will show strong growth and there will be a modest increase in home building permits. Inflation may become an issue.

Highlights from the OSPB outlook for 2014 are:
• The unemployment rate will decline to 6.5%.
• 57,500 wage and salary jobs will be added.
• Retail trade sales will increase by 5.4%.
• 37,300 home building permits will be issued.
• Inflation will increase by 2.4%.
Job growth will be similar to 2013, which will lead to a slight decline in unemployment. Retail trade sales will show strong growth and the housing market will post modest gains. Inflation will remain in check.

For more details, check out the CLC quarterly report  and the OSPB report by clicking here. Both groups produce comprehensive economic updates on a quarterly basis. They are “must read” material for anyone interested in the state economy. The reports are released around the 20th of the month in March, June, September, and December.

©Copyright 2011 by CBER.

CBER Colorado Economic Forecast 2013 – Growth Rate Similar in Year Ahead

CBER recently released its forecast of the Colorado economy and at the risk of sounding like a broken record, 2013 will look a lot like 2012 and 2011.

  • U.S. Real GDP will be in the range of 1.9% to 2.3%
  • The U.S. will add 1.9 to 2.1 million workers
  • Colorado will account for 2.5% of U.S. jobs added
  • Colorado will add 45,000 to 55,000 workers.

Since the end of the recession, Colorado employment has had five false starts. Despite serious national and international headwinds, the state may finally have enough momentum to begin showing solid, sustained job growth beginning in the second half of 2013.

Strong Growth Category ( About 32% of total employment)

This category has consistently posted strong growth over the past two decades. In 2013, job growth will be 2.9% to 3.1%, slightly below the category’s annualized growth rate of 3.25% for 1990 to 2011.

Limited Growth Sectors (about  40% of total employment)

This category has consistently posted solid growth over the past two decades (Annualized rates for the sectors range between 1.1% to 2.2%.) In 2013, job growth will be 1.4% to 1.6%, slightly below the category’s annualized growth rate of 1.85% for 1990 to 2011.

Volatile Growth Sectors (28% of total employment)

This category has been inconsistent in its growth rates over the past two decades. It is expected to add jobs at a rate of 2.1% to 2.3%. This is above the category’s annualized growth rate of about 0.79% for 1990 to 2011. This variance from the average is a reflection of the category’s  volatility.

©Copyright 2011 by CBER.

State Economic Agencies Point to Slower Growth in 2013

The Colorado Legislative Council (CLC) and the Governor’s Office of State Planning and Budgeting (OSPB) recently released their Q3 economic updates. As can be surmised by their names, CLC and OSPB provide comprehensive economic information and forecasts to inform discussion about the state and national economies.

Their most current updates show the two groups are upbeat about the economy for 2012. At this point, they are much less optimistic about the prospects for 2013.

CLC
National Employment
2012  1.3% growth and 133,100,000 employees
2013  0.6% growth and 133,900,000 employees

National Unemployment
2012   8.3%
2013   9.1%

State Employment
2012  1.7% growth and  2,296,600 employees
2013   0.7% growth and 2,312,700 employees

State Unemployment
2012   8.3%
2013   9.4%

OSPB

National Employment
2012  1.3% growth and 133,000,000 employees
2013   0.8% growth and 134,100,000 employees

National Unemployment
2012  8.3%
2013  8.2%

State Employment
2012  1.7%  growth and  2,296,700 employees
2013  1.0%  growth and 2,320,300 employees

State Unemployment
2012  8.0%
2013  7.8%

There are notable differences between the two forecasts for 2013. This begs the question, “Are the two groups intentionally presenting best and worst case scenarios or are their differing viewpoints a legitimate indication of the diverse landscape?”

For more information about updates from OSPB click here.

To view the forecast for CLC click here.

For the most latest cber.co monthly update for Colorado click here.


©Copyright 2011 by CBER.