Boulder County and Larimer County Business Development

Both Boulder County and Larimer County are the source of innovation and entrepreneurship that helps drive the Colorado economy.

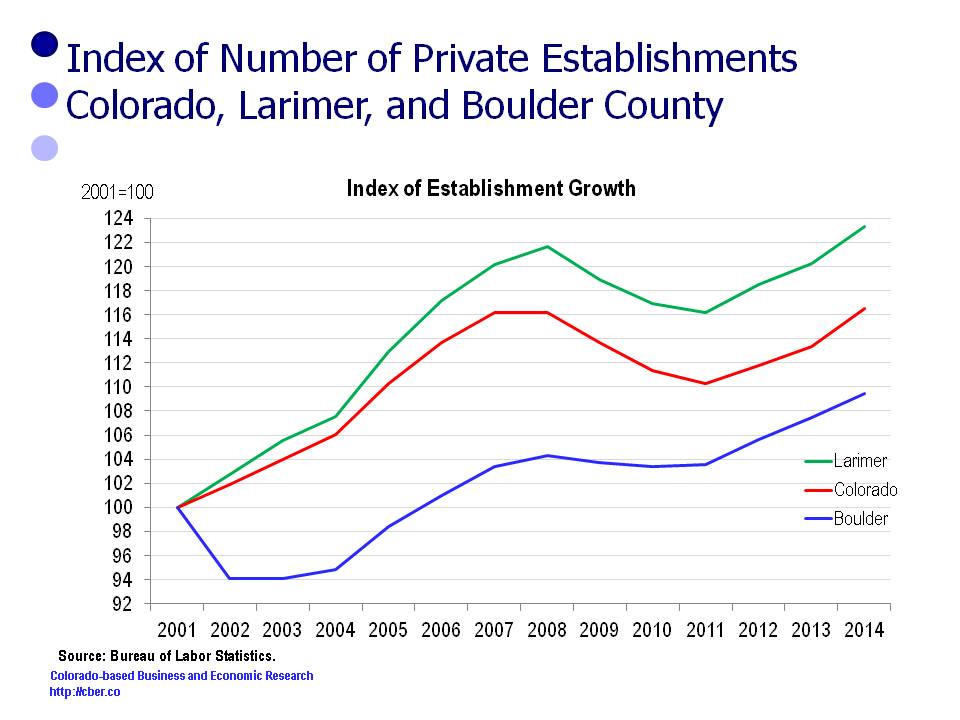
This analysis compares changes in the unemployment rate, population growth, the number of private sector establishments, and employment. It shows how the growth patterns for the two counties are significantly different for these demographics.

In summary, this comparison shows that:
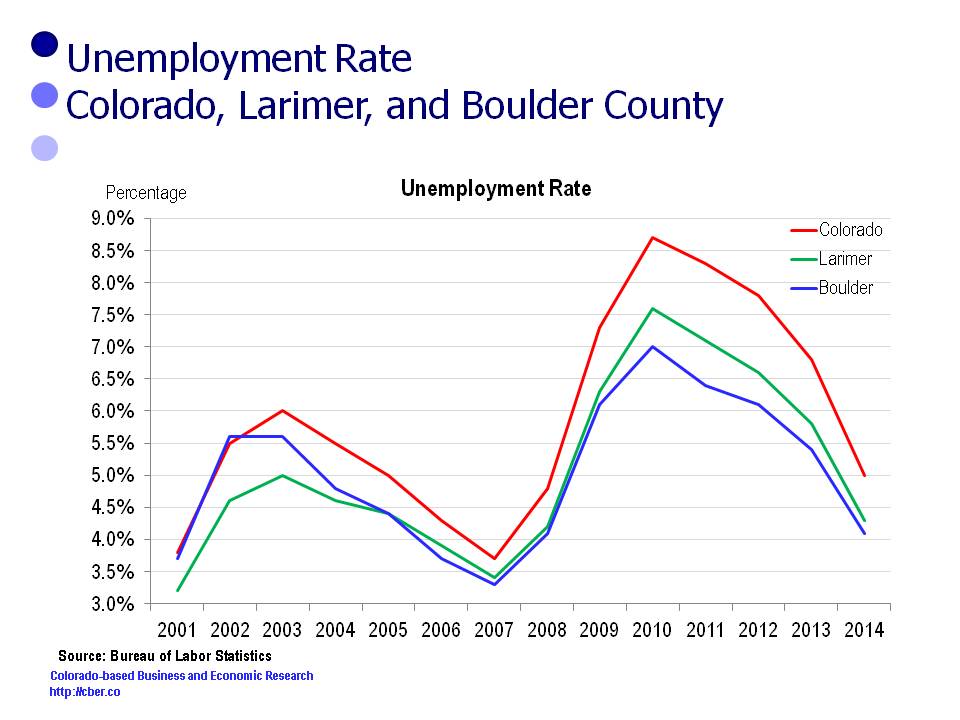
• Since 2001, Boulder County and Larimer County have usually had unemployment rates below the state – which is a mixed blessing.
• Since 2001, the population, employment, and number of private sector establishments for Boulder County have grown below the rates for Colorado and Larimer County.
Finally, this analysis poses questions that relate to the changes in these data sets.

Unemployment Rate

Typically, the unemployment rates for both Boulder and Larimer County are below the rate for the state.Boulder County and Larimer County
Population

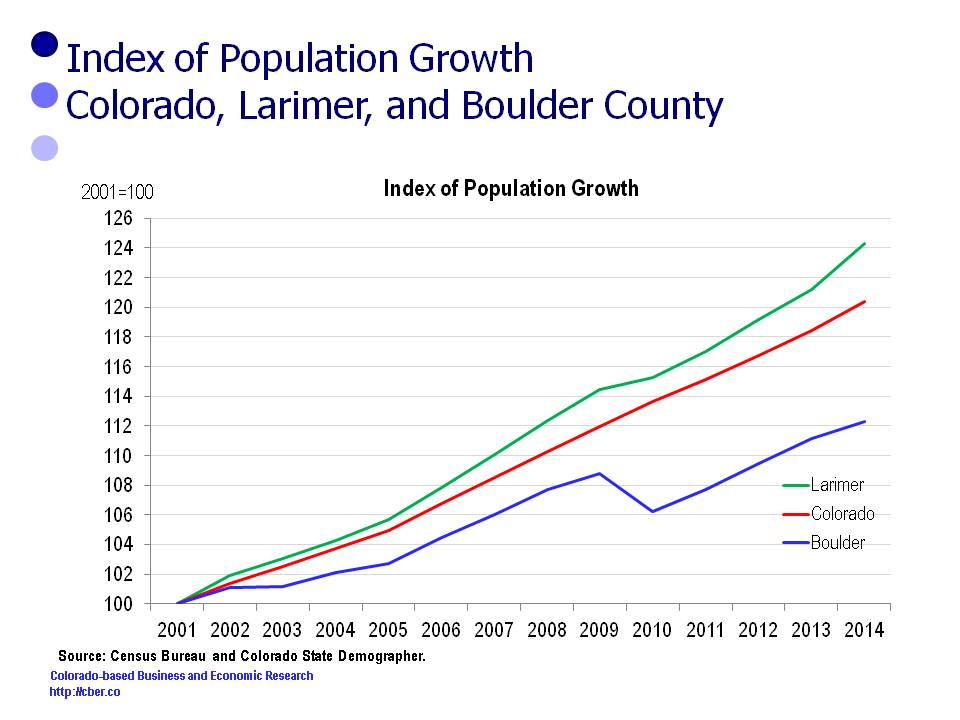
In 2001 Larimer County population was 260,746. It increased by 63,376 and was 324,122 in 2014.
In 2001 the Colorado population was 4,444,513. It increased by 906,059 and was 5,350,572 in 2014.
In 2001 Boulder County population was 278,981. It increased by 34,352 and was 313,333 in 2014.

For this period the rates of change in the population follow:
• Larimer County 24.3%
• Colorado 20.4%
• Boulder County 12.3%.

Boulder County and Larimer County

Establishments

In 2001 there were 8,479 Larimer County establishments. The number increased by 1,976 to 10,455 in 2014.
In 2001 there were 151,025 Colorado establishments. The number increased by 24,957 to 175,992 in 2014.
In 2001 there were 12,335 Boulder County establishments. The number increased by 1,165 to 13,500 in 2014.

For this period the rate of change in the number of establishments follows:
• Larimer County 23.0%
• Colorado 16.5%
• Boulder County 9.4%.

Boulder County and Larimer County

Employment

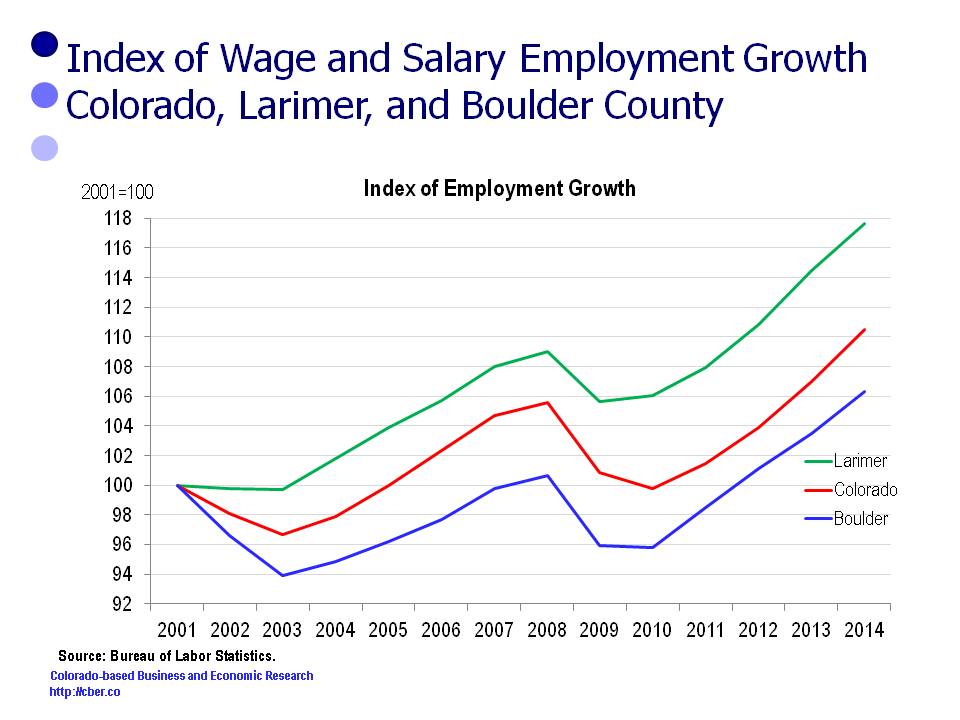
In 2001 Larimer County employment was 126,300. It increased by 22,300 and was 148,600 in 2014.
In 2001 Colorado employment was 2,226,800. It increased by 234,000 and was 2,460,800 in 2014.
In 2001 Boulder County employment was 166,200. It increased by 10,500 and was 176,700 in 2014.

For this period the rate of change in the employment follows:
• Larimer County 17.6%
• Colorado 10.5%
• Boulder County 6.3%.

Boulder County and Larimer County

Implications

The following questions arise when looking at the changes in the unemployment rate, population, the number of private sector establishments, and employment in Boulder County and Larimer County. (Boulder County is also the Boulder MSA and Larimer County is the Fort Collins MSA).

• How do organizations in Boulder and Fort Collins find qualified workers when the regional unemployment rate is lower than the state and other MSAs? Do they have established training programs? Do they recruit workers from other companies (in-state or out-of-state)? Do they provide their workers premium compensation packages?
• Why is the rate of growth for the Boulder population lower than Fort Collins and the state? Is this a result of a lack of affordable and attainable housing in Boulder? Will the completion of improvements to the 36 corridor make it easier for workers to commute to Boulder? Can commuters afford to use it?
• Why are the number of new business establishments in Boulder growing at a slower rate than Colorado and Fort Collins? Is there a lack of adequate commercial space? Is commercial real estate too expensive in Boulder? Why are other areas more attractive? Is it too expensive to operate a business in Boulder? Is it necessary to export innovative ideas out of Boulder so companies can be successful? Why do companies stay in Boulder
• Why is the employment growth rate for Boulder lower than the state and Fort Collins?

This analysis of data for Larimer, Boulder, and Colorado shows that communities have varied business development policies and priorities that have been successful in different ways.
Boulder is #1 – Most Highly Educated and Greatest Number of Toilets

Rankings are fun… Whether it is being recognized as a party school,  highly educated, or fit, Boulder is #1. Recently, Boulder also laid claim to another title. Boulder is #1 for having the greatest number of toilets per capita.number one

To digress briefly…

Some economists and data geeks are obsessed with producing rankings. If you give them a data series, they will open their Excel spreadsheet, plug the data in, and sort it. In no time they will produce a new set of rankings.

Rankings have high entertainment value. They can be used for bragging rights and they can be used for creating taglines to promote a variety of causes, both good and bad. Some Coloradans use the tagline, “Colorado ranks ahead of only Mississippi in funding for education,” to solicit support for the increased funding. The tagline tugs at heartstrings or parents with young children, but it does not clearly represent reality.

Rankings are also useful for creating a feel-good/put-down statement. Consider the bumper sticker that states, “My dog is smarter than your honor student and my cat is smarter than my dog.” My cat is ranked #1, my dog is ranked #2, and your honor student is at the bottom of the pile. I can feel good about my cat and you should feel bad about your honor student. Take that!

Rankings of economic data have value if they are used for comparative or analytical purposes such as showing the strengths or weaknesses of a region as a means of addressing a challenge or opportunity. For example, if Colorado has a high concentration of companies that conduct research in lasers, a discussion about the competencies of these companies can be used to attract and retain photonics, aerospace, and bioscience companies in Colorado.

Back to the issue in the first paragraph…Boulder is #1!

Recently, Redfin.com, a real estate company, produced a report entitled “Tons of Toilets: Which City Sits atop the Throne?” Like many rankings, this one had high entertainment value.

At the top of the list is Boulder with 305,200 toilets or 1.02 toilets per person. Approximately 5.3 million gallons of water are flushed daily.

Second on the list is Washington, D.C. with almost 5.5 million toilets or .98 toilets per person. Approximately 95.6 million gallons of water are flushed daily.

Denver is ranked 6th on the list with almost 2.4 million toilets or .94 toilets per person. About 41.8 million gallons of water are flushed daily.

Shortly after the rankings were released my inbox filled up with e-mails from peers. They were quick to point out the correlation between the rankings of the education levels of these cities to their toilets per capita rankings. Don’t worry, their comments are not appropriate for this document and have been flushed down the toilet.

Like most other rankings, the listing of the race to the top of the throne was used to promote a cause. In this case, the rankings were intended to draw potential customers to the Redfin website – and it worked. I was quickly reminded that I cannot afford to live in Boulder.

This ranking was fun and it was harmless, but it provides a lesson. It is important to be vigilant when reading and using rankings. More often than not, they have limited value unless they are used with other data to make a valid and constructive point.


Northern Colorado Leads MSA Job Growth

The Northern Colorado Metropolitan Statistical Areas (MSAs) are leading job growth for Colorado. Through five months of 2014, the leaders in MSA job growth were Greeley and Fort Collins.

The MSA job growth rates for five months follow:

  • Greeley 5.4%
  • Fort Collins 3.5%
  • Boulder 3.1%
  • Denver 2.8%
  • Pueblo 2.1%
  • Grand Junction 1.4%
  • Colorado Springs 1.2%

The rate of growth for the state was 2.9%.

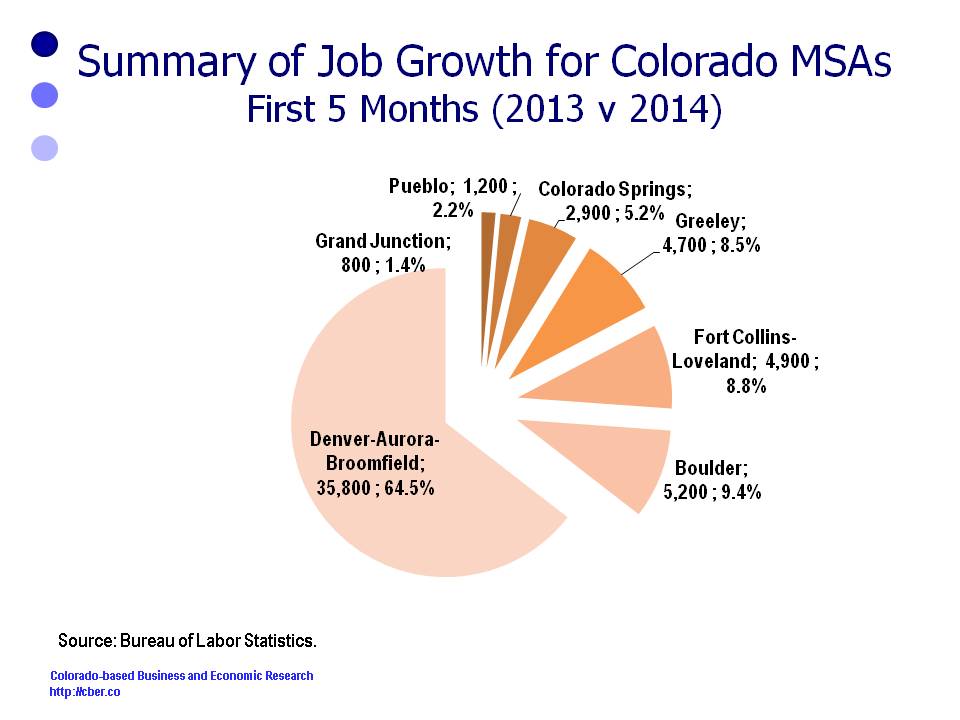
The MSA job growth for five months follows:

  • Denver 35,800
  • Boulder 5,200
  • Fort Collins 4,900
  • Greeley 4,700
  • Colorado Springs 2,900
  • Pueblo 1,200
  • Grand Junction 800.

For the first five months of 2014 Colorado added about 67,100 workers compared to the same period in 2013. About 11,600 were outside the seven MSAs.

As expected Denver added the greatest number of jobs. The percentage of MSA job growth follows:

  • Denver 64.5%
  • Boulder 9.4%
  • Fort Collins 8.8%
  • Greeley 8.5%
  • Colorado Springs 5.2%
  • Pueblo 2.2%
  • Grand Junction 1.4%

Combined, the Northern Colorado MSAs added 17.3% of all jobs. The state’s seven MSAs accounted for about 83% of total job growth in the state for this period.

Though most of the state’s land mass is rural, most of the job growth is in the seven MSAs.

MSA Job Growth for Colorado


State’s Flagship University one of Nation’s Top Underperformers

Higher education is critical to the future of the U.S as a world leader. Our universities educate the future leaders, athletes, scientists, and bartenders. As well research in conducted that helps the country maintain its competitive advantage in innovation and global output.

On December 12, U.S. News and World Report released a report listing the country’s top higher education overperformers and underperformers. The over/under ratings compare the schools overall ranking and the peer assessment ranking. If the peer assessment ranking is higher than the overall ranking, then the school is an overperformer. If the peer assessment is lower, then the institution is an underperfomer. The authors stated that overperformers do better on a relative basis in the following key academic statistical indicators: admissions selectivity, financial and faculty resources, graduation and retention rates, alumni giving and graduation rate performance.

Most of the overperformers are small research universities which tend to be located in the Midwest or East Coast. On the other hand many of the underperformers are large public universities located in the Midwest or West Coast.

At the time the University of Colorado joined the PAC-12 Athletic Conference, CU President Benson got in hot water for discussing the academic strength of the PAC-12 and the academic weakness of certain schools in the Big 12. Ironically, there are only two schools from the former Big 12 Conference on the list of underperformers and they are five PAC-12 schools, including CU Boulder, on the list of underperformers. Hopefully, the mention of the two CU campuses on the underperformer list will be addressed.

There are a variety of reasons schools may be underperformers, some of those reasons relate to deficiencies in the universities, while others relate to idiosyncrasies in the ranking process. There are flaws in reports such as those produced by U.S. News just as there are flaws in the system used to determine the national collegiate football champion. Having said that, the rankings provide universities with a set of metrics for evaluating their systems and processes and improving services to their students.

The Overperformers

University

Overperformance Value

Maryville University of St. Louis

99

University of La Verne (CA)

85

St. John Fisher College (NY)

82

Andrews University (MI)

79

Biola University (CA)

77

Azusa Pacific University (CA)

73

Edgewood College (WI)

70

Stevens Institute of Technology (NJ)

70

University of St. Thomas (MN)

70

Yeshiva University (NY)

70

University of Tulsa (OK)

66

Immaculata University (PA)

64

Adelphi University (NY)

59

St. Mary’s University of Minnesota

58

Mississippi State University

57

Indiana University of Pennsylvania

54

University of Dayton (OH)

54

University of the Pacific (CA)

54

Widener University (PA)

50

SUNY College of Environmental Science and Forestry

47


The Underperformers

University

Underperformance Value

Arizona State University

-71

University of Arizona

-68

University of Montana

-68

University of Colorado–Denver

-57

Virginia Commonwealth University

-50

University of North Carolina–Charlotte

-49

University of New Mexico

-48

University of Colorado–Boulder

-46

University of Oregon

-44

Oregon State University

-41

University of Maryland–Baltimore County

-41

George Mason University (VA)

-40

University of Illinois–Chicago

-37

University of Kansas

-36

Indiana University–Bloomington

-35

Montana State University

-35

San Diego State University

-35

University of Alabama–Birmingham

-35

University of Missouri–Kansas City

-35

Kansas State University

-34

 Source: U.S. News Analysis Shows Universities Where Reputation, Rank Don’t Match

by Diane Tolis and Robert J. Morse December 12, 2013.

©Copyright 2011 by CBER.

Why are People Moving Out of Boulder County?

Boulder County is the hub of Colorado’s high-tech industry.  It is the home of IBM, Ball Aerospace, and several federal labs and a host of other high-tech companies. At times the Boulder economy is like the city’s image – it sometimes moves to the beat of a different drummer. For instance, the unemployment in the county is typically lower than that of the state, average annual wages are much higher than the state average, and the county economy often lags the state when entering recessions.

As well, the county population increased by 0.7% during the 2000s, a little over half the rate of growth for the state. That is not particularly surprising given the high prices of housing in the City of Boulder and the image that it has developed as a “no growth” city (Boulder is the dominant city in the county). Between 2000 and 2010, the county population increased about 19,232 people. About  84% of that growth occurred in 4 years,  2001 and 2006-2008.

Looking more closely, it can be seen that during the first half of the past decade, the natural rate of increase for the county was between 2,000 and 2,400 people a year (The natural rate of increase is births minus deaths). The rate tapered off during the second half of the decade and ranged between 1,600 and 1,900. All together the natural rate changed by 20,296 people.

The shocker is that there was negative net migration during this period (Net migration is the difference between the number of people who move in and the number who move out). In other words, the hospitals and funeral homes were busy, but apparently the moving vans were busier.

So what does this mean for the county? At first glance, the implications could be significant – it could affect schools, tax receipts, and services provided. Stay tuned as the story unfolds in the months ahead.


©Copyright 2011 by CBER.

Metro Counties a Drag on Colorado Economy

Colorado added 6,200 net employees during the 10-year period (2001 to 2010). This is in sharp contrast to the previous 10 years (1991 to 2000) when the state gained almost 700,000 workers.

During the go-go 90s, payrolls in the Denver MSA increased by more than 355,000 followed by gains of about 95,000 in rural Colorado. Almost 93,000 jobs were added in El Paso County (Colorado Springs MSA) and another 57,000 in Boulder County (Boulder MSA).

At the risk of being repetitious… the state added only 6,200 workers between 2001 and 2010.

During this period the Denver MSA lost 20,000 workers, the Boulder MSA shed 4,900, and Colorado Springs payrolls decreased by 3,600. Employment in the state’s top three MSAs declined by 28,500 workers. The drop-off in Denver and Boulder began in 2002 and continued throughout the decade, whereas it started in 2007 for Colorado Springs. This was around the time Intel and other high-tech and semiconductor companies left the area.

At the risk of being repetitious… rural Colorado and the smaller MSAs were the only areas to add workers during the decade. Given the weakness in Colorado’s three major metro areas, it seems why the state is struggling to add jobs at a sustained level in 2011.

©Copyright 2011 by CBER.