In October, the Bureau of Labor Statistics reported the Colorado Mining Sector employed about 35,000 workers, or about 1.4% of the state’s 2,534,600 wage and salary employees.
In 2014 the GDP for the Colorado Mining Sector was $19 billion, or 6.2% of the 2014 Colorado GDP. More importantly, the Mining Sector accounted for about 18.2% of the growth in the state’s GDP.
In a nutshell, mining employment is a small portion of total employment in Colorado. On the other hand, the industry makes a major contribution to the GDP.
The Oil and Gas Industry accounts for about 75% of the employment and GDP total.
With that as a background, it is easy to see why state leaders were concerned when the price for a barrel of oil plummeted to below $40 per barrel in a matter of months.
To make matters worse, the Bureau of Labor Statistics may have overstated employment in the Oil and Gas industry by as much as 4,000 workers. In other words, the data for the state does not appear to have measured the direct, indirect, and induced impact of lower employment caused by lower prices for a barrel of oil.
A quick analysis using IMPLAN shows the loss of 3,200 oil and gas workers and 800 support workers would result in a loss of $4.2 billion in economic activity and a total loss of 12,486 jobs. The direct average annual wages for the oil and gas industry are $96,425 and the direct average annual output per worker is $701,480.
The Bureau of Labor Statistics will update wage and salary data for 2015 in its benchmark revisions next March. At that point we will have a better look at the magnitude of the layoffs in the Mining Sector in 2015.
While we are anxiously awaiting the update, the reduction in mining employment is not a number we really want to see – it will be ugly!
About a year ago the Colorado Oil and Gas Industry was turned upside down. Almost overnight the price for a barrel of oil plummeted.
Since dropping, prices for a barrel of oil have remained low, rig count has dropped, employment has declined, BUT production has remained at record levels. At some point the disruption will become more settled and Colorado will move forward with a smaller oil and gas industry.
Projected revisions to the BLS employment data for Colorado suggest the oil and gas industry could be reduced by 1,000 jobs for 2015. Although the industry is small from an employment perspective, it is significant in terms of gross domestic product for the state and MSAs. This is particularly true in Mesa, Weld, and Denver counties. Much of the drilling occurs in Mesa and Weld counties and many of the headquarters or company offices are located in the Denver MSA.
The IMPLAN model is designed to show how changes in employment or sales could impact the state economy. In this case, the Colorado Labor Market Information group has produced projections suggesting there will be a loss of 1,000 jobs in the oil and gas industry for 2015. The IMPLAN model indicates this will cause an additional loss of 1,800 indirect and induced jobs. In addition there will be a combined loss of $657 million in direct, indirect, and induced sales in the Colorado economy.
To date the robust mix of industries in Colorado has offset the job losses in the extractive industries. That is likely to continue for the remainder of the year and into 2016.
The extractive industries have been a critical part of the Colorado economy for more than 150 years. The sector has been responsible for high-paying jobs in rural areas that have in turn stimulated growth in other sectors. In addition, the fuel, minerals, and metals have been utilized in ways that have improved our quality of life and made the United States a leader in innovation.
In 2014, the estimated value of the state’s extractive industries was projected to be $17.2 billion, broken down as follows:
• $7.0 billion – natural gas
• $6.7 billion – crude oil
• $2.2 billion – minerals
• $0.9 billion – coal
• $0.4 billion – carbon dioxide.
Despite its importance, the extractive industries have faced significant challenges.
“The Event”
For many years, the extractive industries were allowed to focus almost exclusively on extraction. Without regulation, pressure from industry members, or outside groups, insufficient attention has been paid to the impact of the extraction process.
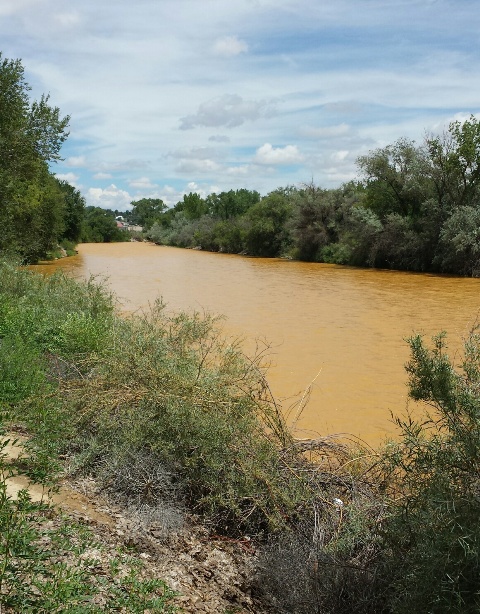
This was evident when waste from Gold King Mine, near Silverton, recently spilled into Cement Creek. The plume of dirty, yellow water slowly made its way into the Animas River, which flows through Durango, Colorado and Farmington, New Mexico on its way to Lake Powell.
“The event” included a spill that contained a variety of pollutants and it was reported to be similar in volume to six Olympic- sized swimming pools. Within a week, the plume had passed through New Mexico. In Durango the pollutants either settled to the bottom of the river or the volume in the Animas River was great enough to dilute them or push them downstream. As a result, water tests indicated the concentration of pollutants had returned to acceptable pre-event levels – whatever that means.
The reaction to “the event” has been varied:
• Some think it is a disaster, catastrophe, and travesty.
• Initially, some were concerned because of the damage to the environment. As soon as the governor drank from the river, they rearranged their priorities and became concerned about the damage to local rafting companies and tourism businesses.
• Others have taken a wait and see attitude. They have asked, “What is the long-term damage?”
• There are a group of people who are focused on they blame game. They want to blame the mining industry, political parties, special interest groups, and government for “the event”. Others have gone so far as to speculate that “the event” was planned as a part of a conspiracy between the government and mining companies.
• From a historical perspective, “the event” is old news. For decades there have been pollutants in the Animas River as a result of runoff (Mother Nature) and leakage from mines. It wasn’t that long ago that the Smelter Mountain Mill, located in the south end of Durango, produced uranium for the Manhattan project.
Colorado Geological Survey
The website of the Colorado Geological Survey addresses the challenges they face in overseeing the industry.
“Prior to 1977 there were virtually no laws in the United States requiring that mines be reclaimed when mining was completed. Today the Colorado Division of Reclamation Mining and Safety is responsible for assuring that mined lands are restored under the Colorado Mined Land Reclamation Act and the Colorado Land Reclamation Act for the Extraction of Construction Materials. However, prior to those laws, when mining was completed, the companies just walked away leaving piles of waste and dug out holes. Thus, Colorado was left with an estimated 23,000 abandoned mine lands (AML).
Abandoned mines present very dangerous physical hazards to the public. High priority physical hazards identified by the Colorado Geological Survey for the USFS AML inventory are being jointly mitigated by the USFS and the Colorado Division of Reclamation, Mining, and Safety (DRMS). Mine workings are notorious for containing “bad air” including carbon monoxide, carbon dioxide, and hydrogen sulfide. These gases can kill unwary explorers of these old mines by asphyxiation. The old workings and structures can be very unstable and collapse without warning. Dangerous sites close to public access are being safeguarded through filling, capping, or gating the abandoned mine openings with engineered structures.”
Addressing the Challenges
Many in the state and the Four Corners areas will focus on the perspectives mentioned above. The verbiage from the Colorado Geological Survey shows this is not a simple problem, with a simple solution.
Colorado’s extractive industries are critical to the state’s economy and to the security and innovative leadership of the United States. Oil and coal are the backbone of the country’s transportation and utilities system. Rare and heavy metals are essential for the aerospace, biosciences, renewable energy, health care, transportation, defense, and environmental industries.
It is necessary for the country, including Colorado, to continue to drill for oil and gas and extract minerals and metals from the earth. Since 1977, government agencies and companies have been held to stricter standards for monitoring the impact of the extraction process. As has been recently demonstrated in Silverton, the efforts to monitor and manage pollutants are not perfect. The important point is that efforts are being made and they will be improved after “the event.”
With good fortune and sufficient funding, the state will remain diligent in its efforts to deal with the 23,000 abandoned mines.
Good luck to the local, state, and federal officials, agencies, companies, and special interest groups who will address the challenges facing the extractive industries in the years ahead.
The Animas River in Farmington, New Mexico as the plume of water from the Gold King Mine passed through town.
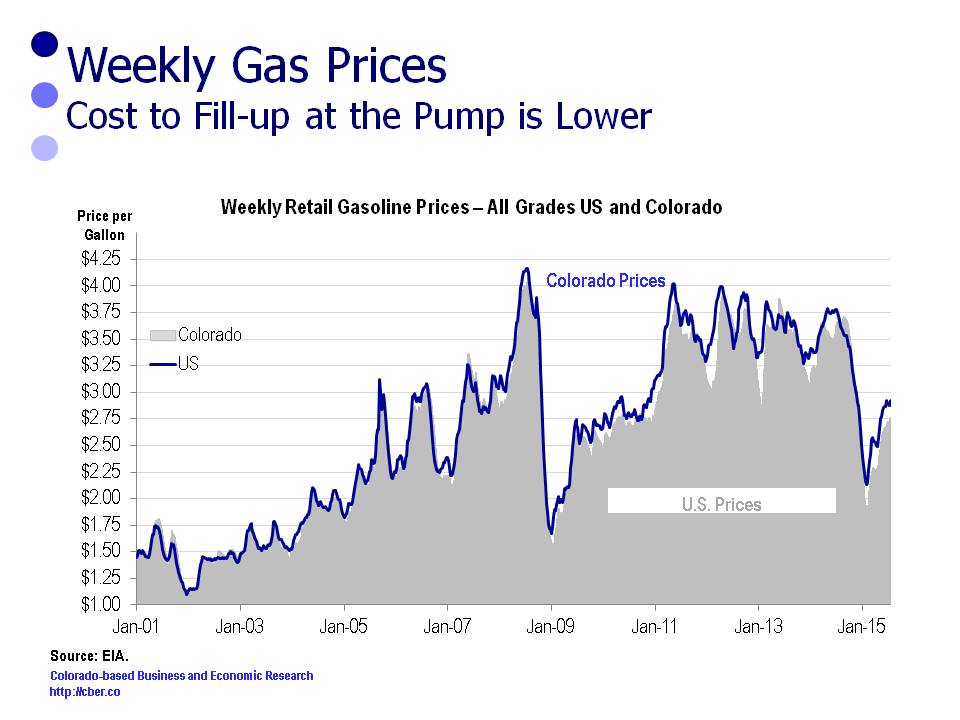
About a year ago, the price for a barrel of oil dropped like a rock. Consumers salivated because they knew lower gas prices were on the horizon. In the 2015 cber.co Colorado Economic Forecast it was projected that consumers would save an average of one dollar a gallon from lower prices at the pump, or a total of $780.
The following calculations were made to determine the difference in cost to purchase gasoline for the periods July to June (2013-14 and 2014-15). The annual cost assumes that a person fills a car with 15 gallons of gas per week, or 780 gallons per year.
The costs and the savings for the United States are listed below.
2013-14
• 780 gallons, average price per gallon $3.51
• Total cost = $2,774.69
2014-15
• 780 gallons, average price per gallon $2.88
• Total cost = $2,281.63
• The 2014-15 costs were $493.05 less than 2013-14.
The costs and the savings for Colorado are listed below.
2013-14
• 780 gallons, average price per gallon $3.41
• Total cost = $2,692.02
• The costs in Colorado were $82.67 less than the U.S.
2014-15
• 780 gallons, average price per gallon $2.80
• Total cost = $2,213.51
• The costs in Colorado were $68.12 less than the U.S.
• The 2014-15 costs were $478.51 less than 2013-14.
Check back in six months to see if gas prices remained low and how much lower they were than last year.
Source: EIA.gov – All Formulations and All Grades.
The recent release of BLS wage and salary employment data for Colorado showed that after four months the state is on track to add 71,400 workers. This is slightly below the cber.co forecast range of 73,000 to 79,000.
The softness in job growth may be attributed to the decrease in the price of oil, which bottomed out at $43 per barrel on March 17. A prominent Boulder economist has stated that average annual state employment for the year would fall to 40,000 because of the decline in oil prices. So far, the impact has been minimal.
In April there were 34,400 jobs (NSA) in the Mining and Logging Sector, which includes the mining and oil and gas industries. This is down about 1,300 jobs from December but about 1,800 jobs above the April 2014 total. The sector had record employment this past December.
Some of the factors that have affected demand are:
• Over time global demand for oil has declined, in part because of increased energy efficiency and an increase in the number of alternate sources. That decrease is expected to continue in the future.
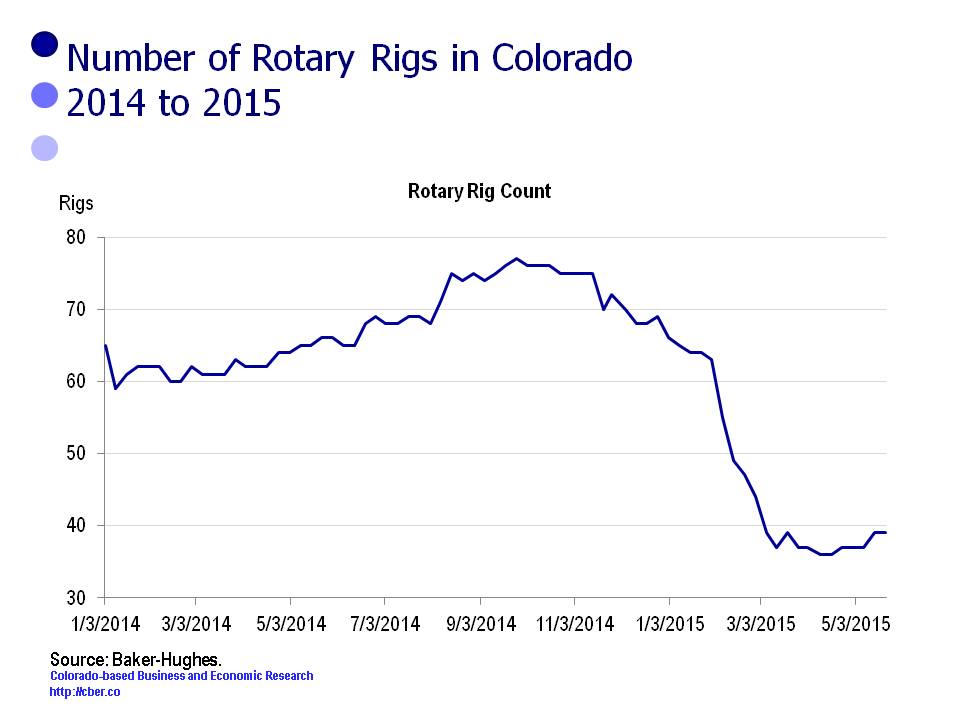
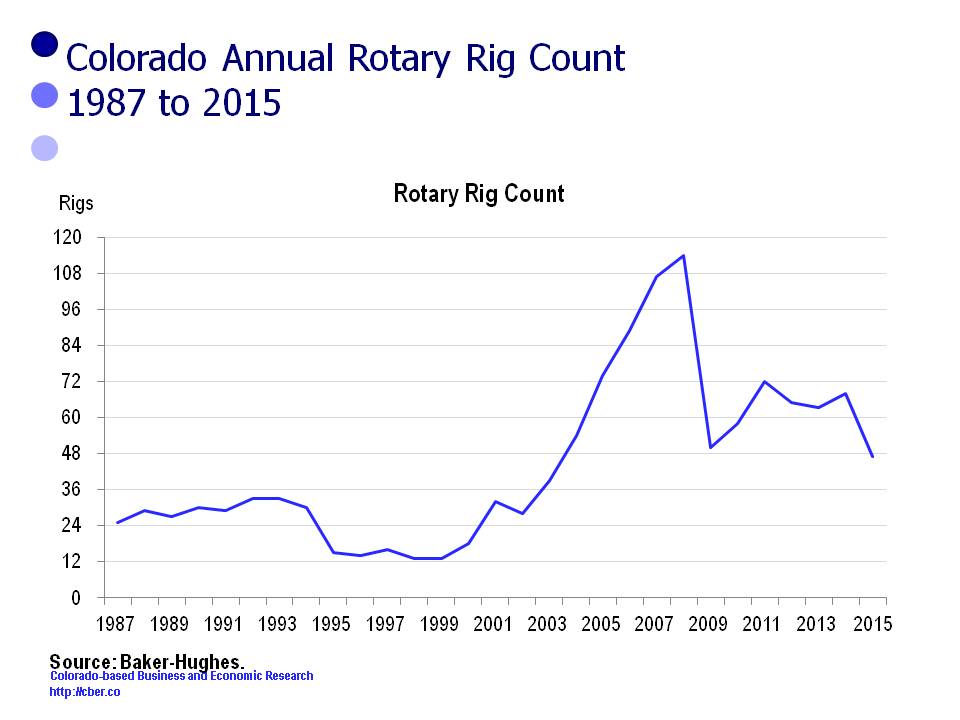
• The number of Colorado rigs in operation has dropped sharply in the past six months.
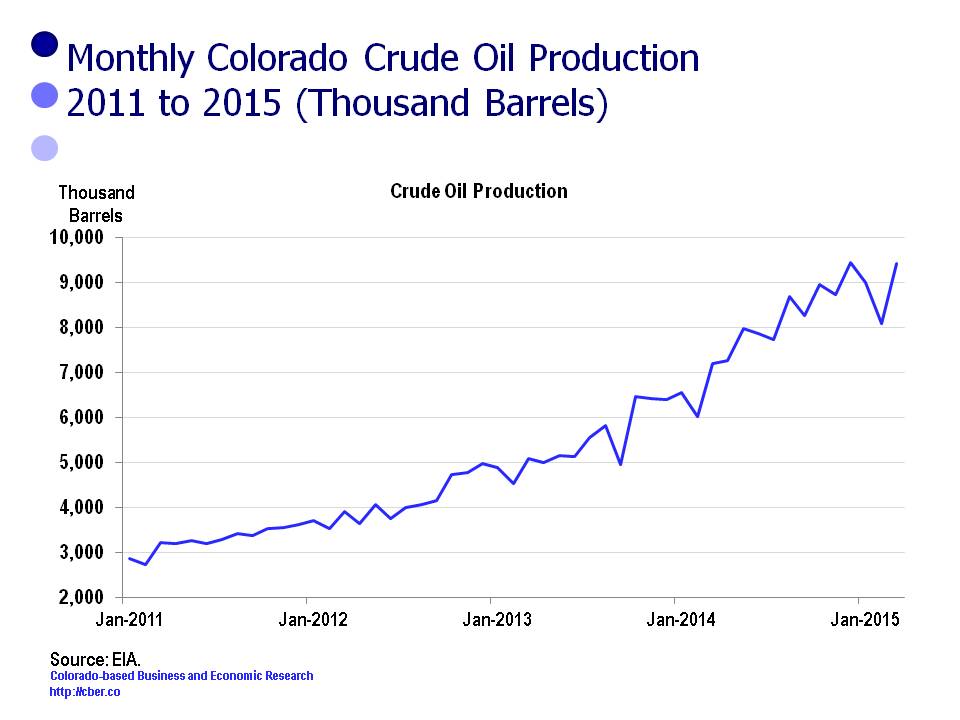
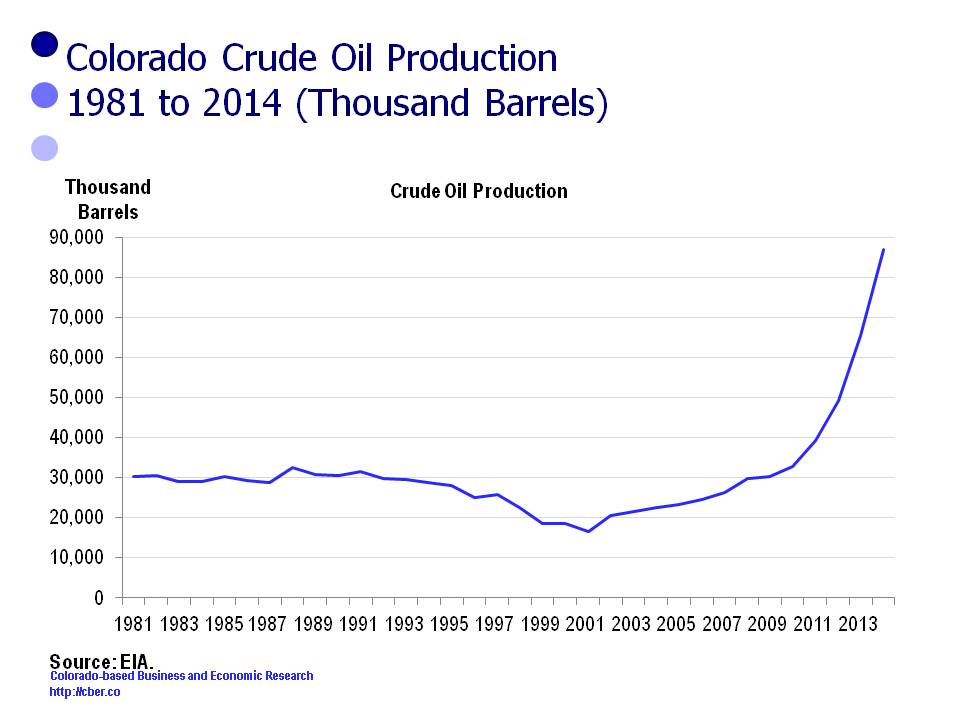
• Oil production in Colorado reached a record high in 2014. Despite the decline in oil prices, monthly production has remained near record levels; however, at some point reduced production is expected if prices remain suppressed for an extended period.
• Nationally, Colorado is a second-tier state for production; however, the oil and gas industry is a significant contributor to the state’s Gross Domestic Product. Today, the U.S. is producing about 80% of the oil used domestically, a significant change from five years ago. This means that Colorado producers will continue to drill, although production may be at lower levels.
• The price per barrel and the breakeven point are less critical than they were five years ago. Producers have become more efficient by reducing overhead and adopting improved technology such as super-fracking. In addition they have capped wells that are older or less efficient. Through increased efficiencies, companies have been able to lower the break-even point for many of their plays and adjust to lower prices per barrel.
• Since March 17th, the price per barrel has risen and reached $60 per barrel in early May. The consensus is that it will remain around that level for the remainder of the year.
These factors will have the following implications on the state:
• Colorado has a diverse energy industry. It is a strong second tier oil and gas state, it has companies that manufacturer solar and wind energy equipment, and significant energy research is conducted locally. Because energy is critical to the security of the U.S., the state will benefit from having a balanced energy portfolio.
• The reduction in the number of rigs will result in a fewer workers in the industry and its supply chain.
• Because production has remained at a high level, the industry’s contribution to the state GDP may not be as adversely impacted as originally thought.
• Oil and gas companies are evolving in a manner similar to manufacturing and other industries – they are becoming much more efficient. Increased efficiencies are expected to continue and many of the jobs that are being eliminated will not return.
Increased efficiencies will allow American companies to continue to be competitive, which in turn will help the U.S. be an “energy independent” nation. In a convoluted way, the Colorado oil and gas industry may actually benefit in the long run from the recent drop in the price of oil.
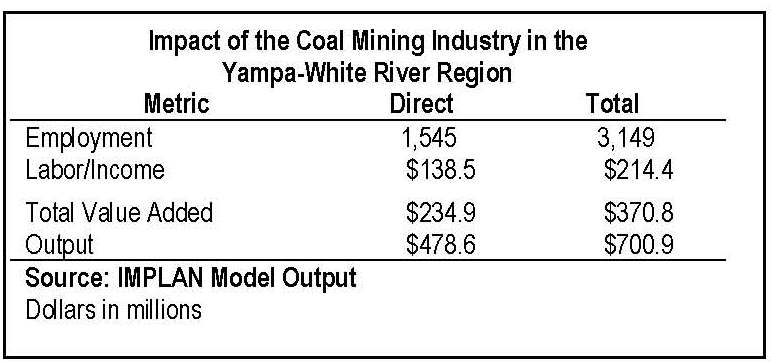
This post summarizes the economic impact of the coal mining industry in the Yampa-White River Region (Moffat County, Rio Blanco County, and Routt County) of Northwest Colorado and the state. It will focus on the two North American Industrial Classification System (NAICS) Sectors 211111 – Bituminous Coal Surface Mining and 212112 – Bituminous Coal Underground Mining, which are included in IMPLAN category 21.
The key employment findings of the report are:
• There are 1,545 direct employees in the Yampa-White River Region working in the coal mining industry. Overall there are 3,149 employees in the Yampa-White River Region working in the coal mining industry (direct, indirect, and induced).
• There are 3,469 direct employees in the state coal mining industry. Overall there are 8,467 employees working in the state coal mining industry (direct, indirect, and induced).
The key output findings of the report are:
• Direct output within the Yampa-White River Region associated with the coal industry is slightly less than $478 million. Direct output within the region associated with the coal industry is slightly less than $701 million (direct, indirect, and induced).
• Direct statewide output for the coal industry is slightly less than $1,052.1million. Direct statewide output for the coal industry is $1,838.0 million (direct, indirect, and induced).
To gain an appreciation for what these numbers mean and the impact of the coal mining industry, it is important to put them in perspective.
• At the state level, the coal mining industry is small. It is one of 405 industries, it accounts for .11% of total direct employment and .37% of total direct output. The industry has a higher than average output for employee level than other industries.
• At the industry level, the Yampa-White River Region employs 44.5% of the direct employees in the state’s coal mining industry. In addition, it accounts for 45.5% of the state’s direct coal mining output.
• At the regional level, the coal mining industry accounts for 4.6% of the region’s total direct employees, but it is responsible for 17.4% of the region’s total direct output. Clearly, output per worker for the sector is greater than the average.
• There are 188 industries in the Yampa-White River Region compared to 405 for the state. The region is less diversified than the state, which accentuates the importance of dominant role the coal mining industry plays in the Yampa-White River economy.
• Average wages, without supplements, for the region are $84,544 for surface mining and $90,132 for underground mining. Average wages are well above the state average for all industries. About 73% of the direct workers in the region are wage and salary employees.
There has been concern by some that the freefall in the price of a barrel of oil last year would cause a sharp downturn in the Colorado economy.
In fact, the University of Colorado Leeds School of Business has projected that the loss of oil and gas jobs will cause total employment to grow at a rate less than 2.0% this year. That means that average employment for the year would be less than 50,000. It would also mean that average job growth for the last three quarters of the year would be at most 41,000 jobs.
The 2015 cber.co forecast projected a slight decline in the rate of growth (+73,000 to 79,000 jobs), in part because of uncertainty in the oil and gas industry. It seems unlikely the decline will be as severe as projected by the Leeds School.
A frequently quoted data set is rig count. The data shows a sharp drop-off in the number of rigs. The immediate reaction is that “the sky is falling.”
Industry experts state this decline in the number of rigs has occurred, in part, because companies have taken their older and poorer performing rigs off-line to increase their efficiency. This is no different than the Denver Broncos cutting Champ Bailey. A decrease in the number of rigs will eventually point to a decline in the number of employees.
In addition, some companies are adopting improved technology, which has the potential to make the drilling process much more efficient and environmentally friendly. Increased efficiency means that when some of these jobs go away they won’t ever come back. In that sense, the oil and gas industry is moving down the same path as manufacturing and other industries.
Another interesting data set is oil production.
Colorado oil production reached records levels in 2014 and is expected to remain strong through Q1 2015. Levels of production may drop off in Q2 as storage becomes an issue.
Another issue affecting production levels is demand. Global demand for oil has been declining as alternate sources of energy have become more available. In addition, more efficient automobiles and other devices have reduced consumption. Despite the decline in demand, the U.S. has become less dependent on foreign countries for our oil supplies. In turn that will drive demand for U.S. oil.
Looking ahead – employment in the Colorado oil and gas industry will either grow at a slower rate or decline slightly in 2015. The state economy is on solid enough footing that many of those lost jobs will be offset by increases in other industries such as construction, finance, and manufacturing.
In short, the Colorado Oil and Gas Industry is in a state of flux, but it is unlikely that volatility will cause a noticeable downturn in state employment.
Thank goodness for the mining and real estate industries! From an output perspective these industries are the primary drivers of the Colorado economy.
In 2013, Colorado’s nominal GDP was $294.4 billion (most current data available). The state’s economy expanded by $157.1 billion between 1997 and 2013 (1997 is the first year that data was available). Between 2009 and 2013 the GDP expanded by $46.3 billion.
The Great Recession had a major impact on the way the economy expanded. This is evident when comparing the contribution to output for the periods 1997 to 2013 and 2009 to 2013.
Between 1997 and 2013 the contribution to GDP was broken down as follows:
• Goods Producing 20.5%
• Service Producing 68.6%
• Private sector (Goods + Services) 89.0%
• Government 11.0%
Between 1997 and 2013 the annualized rate of growth for the GDP follows:
• Total 4.9%
• Private 5.0%
• Government 4.1%
Between 2009 and 2013 the contribution to GDP was broken down as follows:
• Goods Producing 28.0%
• Service Producing 65.5%
• Private sector (Goods + Service) 93.6%
• Government 6.4%
Between 2009 and 2013 the annualized rate of growth for the GDP follows:
• Total 4.4%
• Private 4.7%
• Government 2.2%
Thank goodness for the Goods Producing Sectors (Agriculture, Mining, Construction, and Manufacturing)!
Industry
2013 GDP (millions)
2013 minus 1997
% of Total
2013 minus 2009
% of Total
All industry total
$294,443
$157,072
$46,266
Private industries
$258,217
$139,860
89.0%
$43,287
93.6%
Goods Producing
$57,447
$32,144
20.5%
$12,964
28.0%
Service Producing
$200,771
$107,718
68.6%
$30,325
65.5%
Government
$36,226
$17,212
11.0%
$2,979
6.4%
The following two tables provide more detail by industry.
The following table shows more detail by industry sector. It is sorted in descending order by the column 2013 minus 1997.
Industry
2013 GDP (millions)
2013 minus 1997
% of Total
2013 minus 2009
% of Total
Real estate and rental and leasing
$40,194
$21,355
13.6%
$6,895
14.9%
Mining
$19,848
$17,964
11.4%
$8,518
18.4%
Government
$36,226
$17,212
11.0%
$2,979
6.4%
Professional, scientific, and technical services
$26,355
$16,084
10.2%
$4,233
9.1%
Information
$21,578
$12,019
7.7%
$1,407
3.0%
Health care and social assistance
$17,438
$10,503
6.7%
$2,262
4.9%
Wholesale trade
$15,915
$7,818
5.0%
$2,606
5.6%
Retail trade
$16,105
$6,926
4.4%
$1,965
4.2%
Manufacturing
$21,600
$6,657
4.2%
$2,171
4.7%
Finance and insurance
$14,480
$6,067
3.9%
$2,436
5.3%
Accommodation and food services
$9,409
$5,255
3.3%
$1,769
3.8%
Management of companies and enterprises
$6,207
$5,106
3.3%
$1,550
3.4%
Construction
$11,820
$4,861
3.1%
$208
0.4%
Administrative and waste management
$8,653
$4,308
2.7%
$1,090
2.4%
Transportation and warehousing
$7,984
$4,094
2.6%
$1,598
3.5%
Other services
$6,549
$2,784
1.8%
$605
1.3%
Agriculture, forestry, fishing, and hunting
$4,179
$2,662
1.7%
$2,067
4.5%
Arts, entertainment, and recreation
$3,848
$2,029
1.3%
$890
1.9%
Utilities
$3,798
$1,782
1.1%
$646
1.4%
Educational services
$2,258
$1,588
1.0%
$373
0.8%
The following table shows more detail by industry sector. It is sorted in descending order by the column 2013 minus 2009.
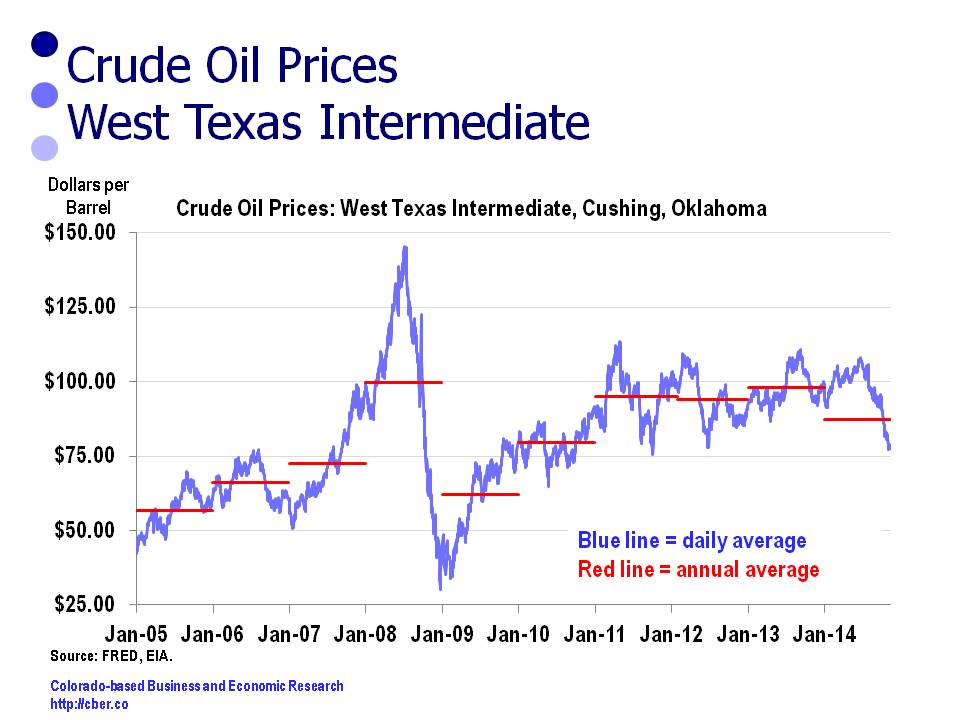
Since 2005, average annual prices for crude oil have ranged from $56 to $100 per barrel (red lines in the chart below). Daily fluctuations are clearly much more volatile (blue lines in chart below), $30 to $146.
Lower crude prices will mean a barrel of oil will be in the range of $40 to $60 per barrel through mid-2015 as supply continues to exceed the demand.
In the near-term, lower crude prices will have a minimal impact on producers in Colorado. If lower prices continue through the middle of next year, contract workers and small companies will be the first to “feel the pain.” A reduction in production could have a ripple effect on other industries that begins with the construction, retail, and finance industries.
Consumers will experience a small benefit because of lower prices for fuel costs; however, the oil production companies will experience lower profit margins and the state will collect less revenue from severance taxes. Overall, the net economic effect of lower crude prices on the state will likely be negative.
Looking ahead to 2015 there are three issues that will impact the economy in 2015: healthcare, extractive industries, and wages.
Healthcare
The healthcare industry may play an important role in the economy in 2015.
• First, there are shortages of workers in many key positions. This may affect the care consumers receive from their service providers and it may increase the costs of doing business.
• Second, providers are being pushed by Obamacare and insurance companies to reduce the fees they charge. In turn, this may reduce their margins.
• Third, it was recently announced that Colorado employers will face an 8% increase in the cost of insurance. Likely, a portion of that increase will be passed on to workers. That could reduce that amount of discretionary income, which in turn could reduce retail consumption.
• In addition, it has been announced that Connect for Health Colorado, will reduce subsidies. In other words, many Coloradans will have to pay significantly more for coverage, go without healthcare, or pay a fine to the government. Coloradans will face sticker shock when they get their health insurance bills in 2015.
Extractive Industries and Prices of Oil and Gasoline
The extractive industries will continue to face challenges in 2015. Fracking is still an issue in Colorado that will not go away. Local governments are pushing to have greater control over the way the extractive industries operate in their jurisdiction.
In addition, the price of oil has trended downward for the past six months. If these trends continue, it may impact production in Colorado, which will hit the smaller companies first. It will also impact severance taxes paid to the state government.
At the same time consumers have enjoyed lower prices at the pump. Their gasoline bills for 2013 and 2014 will be similar. If lower prices continue into 2015, consumers may notice a reduction in their annual gasoline bill in the range of $400 to $800 for the year.
If prices at the pump continue to decline Colorado consumers will be the benefactors, but state coffers suffer. Typically the negative impact for the state outweighs the positive impact on the consumer.
Wages
Typically, when unemployment dips below the natural rate of employment, 4.5% to 5.0%, there is usually upward pressure on wages. Overall that has not been the case in Colorado.
Between 2007 and 2014
• The Denver Boulder Greeley CPI (DBG) increased at an annualized rate of 2.4%
• The Private Sector Average Weekly Wages (AWW) increased by an annualized rate of 1.7%.
Inflation for this period grew at a faster rate than private wages for this period.
Between 2013 and 2014
• The DBG CPI is projected to increase by 2.8%/
• The Private Sector AWW will increase by 2.0%.
The Construction and Financial Activities are isolated sectors that have seen strong wage growth in the last couple of years because the demand for qualified employees has exceeded the supply of workers.
Construction Wages
• Between 2008 and 2012 AWW declined. In 2013 it increased by 11.0% followed by an increase of 11% in 2014. Construction businesses have found that it has been necessary to raise wages this amount to attract workers. Ultimately these labor costs will be passed on to consumers.
Financial Activities
• The financial activities sector has also had strong wage growth, 5.0% annualized growth, from 2007 to 2014. Between 2007 and 2010 Average Weekly Wages decreased, but they have increased significantly since. AWW will increase by 7.3% in 2014
On the other hand, 2014 inflation growth will exceed the change in wages for Manufacturing, Tourism, and Professional and Business Services. These three industries are critical to the state economy for different reasons.
Watch for healthcare, extractive industries, and wages to impact the Colorado Economy in 2015 – and the impact may not always be positive.